Expected goals

Last updated

In association football, expected goals (xG) is a performance metric used to evaluate football team and player performance. [1] It can be used to represent the probability of a scoring opportunity that may result in a goal. [2] It is also used in ice hockey. [3] [4] [5]

Contents

What is xG?

The expected goals metric is generally calculated by determining the likelihood of a shot being scored based on various factors, taken from the moment before the player shoots. These factors may vary depending on the statistical model, but include the distance to the goal, angle, quality of the shot, and other characteristics. Each shot is then given a probabilistic value, representing how many times that shot is likely to be scored based on similar shots. For example, a shot with a value of .3 goals is likely to be scored about 3 out of every 10 times. [6] The expected goals metric has become more common with the increase of data analytics in sports, as analysts based the metric on accumulated years of sports data. [7]

History and application of xG

Association football

Characteristics of the goal moment determining xG: coordinates, quality, body part, interference from the opponent (G. Kravtsov."Applied Statistics"). XG calculation activity.jpg
Characteristics of the goal moment determining xG: coordinates, quality, body part, interference from the opponent (G. Kravtsov."Applied Statistics").

There is some debate about the origin of the term expected goals. Vic Barnett and his colleague Sarah Hilditch referred to "expected goals" in their 1993 paper that investigated the effects of artificial pitch (AP) surfaces on home team performance in association football in England. [8] Their paper included this observation:

Quantitatively we find for the AP group about 0.15 more goals per home match than expected and, allowing for the lower than expected goals against in home matches, an excess goal difference (for home matches) of about 0.31 goals per home match. Over a season this yields about 3 more goals for, an improved goal difference of about 6 goals. [9]

Jake Ensum, Richard Pollard and Samuel Taylor (2004) reported their study of data from 37 matches in the 2002 World Cup in which 930 shots and 93 goals were recorded. [10] Their research sought "to investigate and quantify 12 factors that might affect the success of a shot". Their logistic regression identified five factors that had a significant effect on determining the success of a kicked shot: distance from the goal; angle from the goal; whether or not the player taking the shot was at least 1 m away from the nearest defender; whether or not the shot was immediately preceded by a cross; and the number of outfield players between the shot-taker and goal. [10] They concluded "the calculation of shot probabilities allows a greater depth of analysis of shooting opportunities in comparison to recording only the number of shots". [10] In a subsequent paper (2004), Ensum, Pollard and Taylor combined data from the 1986 and 2002 World Cup competitions to identify three significant factors that determined the success of a kicked shot: distance from the goal; angle from the goal; and whether or not the player taking the shot was at least 1 m away from the nearest defender. [11] More recent studies have identified similar factors as relevant for xG metrics. [12]

Howard Hamilton (2009) proposed "a useful statistic in soccer" that "will ultimately contribute to what I call an 'expected goal value' — for any action on the field in the course of a game, the probability that said action will create a goal". [13]

Sander Itjsma (2011) discussed "a method to assign different value to different chances created during a football match" and in doing so concluded: [14]

we now have a system in place in order to estimate the overall value of the chances created by either team during the match. Knowing how many goals a team is expected to score from its chances is of much more value than just knowing how many attempts to score a goal were made. Other applications of this method of evaluation would be to distinguish a lack of quality attempts created from a finishing problem or to evaluate defensive and goalkeeping performances. And a third option would be to plot the balance of play during the match in terms of the quality of chances created in order to graphically represent how the balance of play evolved during the match. [14]

Sarah Rudd (2011) discussed probable goal scoring patterns (P(Goal)) in her use of Markov chains for tactical analysis (including the proximity of defenders) from 123 games in the 2010-2011 English Premier League season. [15] In a video presentation of her paper at the 2011 New England Symposium of Statistics in Sport, Rudd reported her use of analysis methods to compare "expected goals" with actual goals and her process of applying weightings to incremental actions for P(goal) outcomes. [16]

In April 2012, Sam Green wrote about 'expected goals' in his assessment of Premier League goalscorers. [17] He asked "So how do we quantify which areas of the pitch are the most likely to result in a goal and therefore, which shots have the highest probability of resulting in a goal?". He added:

If we can establish this metric, we can then accurately and effectively increase our chances of scoring and therefore winning matches. Similarly, we can use this data from a defensive perspective to limit the better chances by defending key areas of the pitch. [17]

Green proposed a model to determine "a shot's probability of being on target and/or scored". With this model "we can look at each player's shots and tally up the probability of each of them being a goal to give an expected goal (xG) value". [17]

Ice hockey

In 2004, Alan Ryder shared a methodology for the study of the quality of an ice hockey shot on goal. His discussion started with this sentence “Not all shots on goal are created equal”. [18] Ryder's model for the measurement of shot quality was:

  • Collect the data and analyze goal probabilities for each shooting circumstance
  • Build a model of goal probabilities that relies on the measured circumstance
  • For each shot, determine its goal probability
  • Expected Goals: EG = the sum of the goal probabilities for each shot
  • Neutralize the variation in shots on goal by calculating Normalized Expected Goals
  • Shot Quality Against

Ryder concluded:

The model to get to expected goals given the shot quality factors is simply based on the data. There are no meaningful assumptions made. The analytic methods are the classics from statistics and actuarial science. The results are therefore very credible. [19]

In 2007, [3] Ryder issued a product recall notice for his shot quality model. He presented “a cautionary note on the calculation of shot quality” and pointed to “data quality problems with the measurement of the quality of a hockey team’s shots taken and allowed”. [3]

He reported:

I have been worried that there is a systemic bias in the data. Random errors don’t concern me. They even out over large volumes of data. But I do think that ... the scoring in certain rinks has a bias towards longer or shorter shots, the most dominant factor in a shot quality model. And I set out to investigate that possibility. [3]

The term 'expected goals' appeared in a paper about ice hockey performance presented by Brian Macdonald [4] at the MIT Sloan Sports Analytics Conference in 2012. Macdonald's method for calculating expected goals was reported in the paper:

We used data from the last four full NHL seasons. For each team, the season was split into two halves. Since midseason trades and injuries can have an impact on a team’s performance, we did not use statistics from the first half of the season to predict goals in the second half. Instead, we split the season into odd and even games, and used statistics from odd games to predict goals in even games. Data from 2007-08, 2008-09, and 2009-10 was used as the training data to estimate the parameters in the model, and data from the entire 2010-11 was set aside for validating the model. The model was also validated using 10-fold cross-validation. Mean squared error (MSE) of actual goals and predicted goals was our choice for measuring the performance of our models. [4]

Related Research Articles

<span class="mw-page-title-main">Elo rating system</span> Method for calculating relative skill levels of players

The Elo rating system is a method for calculating the relative skill levels of players in zero-sum games such as chess. It is named after its creator Arpad Elo, a Hungarian-American physics professor.

In probability theory, odds provide a measure of the likelihood of a particular outcome. When specific events are equally likely, odds are calculated as the ratio of the number of events that produce that outcome to the number that do not. Odds are commonly used in gambling and statistics.

Pythagorean expectation is a sports analytics formula devised by Bill James to estimate the percentage of games a baseball team "should" have won based on the number of runs they scored and allowed. Comparing a team's actual and Pythagorean winning percentage can be used to make predictions and evaluate which teams are over-performing and under-performing. The name comes from the formula's resemblance to the Pythagorean theorem.

<span class="mw-page-title-main">Association football tactics and skills</span> Notable football skills and tactics

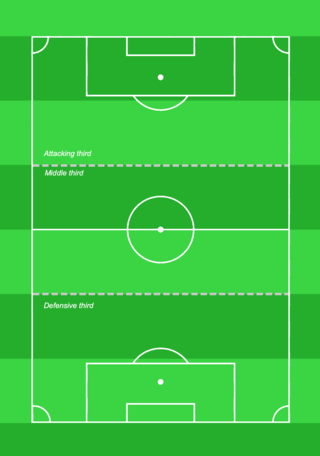
Team tactics as well as individual skills are integral for playing association football. In theory, association football is a very simple game, as illustrated by Kevin Keegan's namely assertion that his tactics for winning a match were to "score more goals than the opposition". Tactical prowess within the sport is nonetheless a craftsmanship of its own, and one of the reasons why managers are paid well on the elite level. Well-organised and ready teams are often seen beating teams with more skillful players on paper. Manuals and books generally cover not only individual skills but tactics as well.

Credibility theory is a branch of actuarial mathematics concerned with determining risk premiums. To achieve this, it uses mathematical models in an effort to forecast the (expected) number of insurance claims based on past observations. Technically speaking, the problem is to find the best linear approximation to the mean of the Bayesian predictive density, which is why credibility theory has many results in common with linear filtering as well as Bayesian statistics more broadly.

A parlay, accumulator, combo bet, or multi is a single bet that links together two or more individual wagers, usually seen in sports betting. Winning the parlay is dependent on all of those wagers winning together. If any of the bets in the parlay lose, the entire parlay loses. If any of the plays in the parlay ties, or "pushes", the parlay reverts to a lower number of wagers with the payout odds reducing accordingly. Parlay bets are high-risk, high-reward; linking the possibilities drastically reduces the chance of the bet paying off overall. The benefit of the parlay is that there are much higher pay-offs, although as usual, casinos and bookkeepers offering parlays often exploit the poor calculation of gamblers by not increasing the pay-out as much as the odds truly demand, with the effect of the house edge increasing in parlays.

The outcome bias is an error made in evaluating the quality of a decision when the outcome of that decision is already known. Specifically, the outcome effect occurs when the same "behavior produce[s] more ethical condemnation when it happen[s] to produce bad rather than good outcome, even if the outcome is determined by chance."

<span class="mw-page-title-main">1995 Football League Cup final</span> Football match

The 1995 Football League Cup Final was a football match played between Liverpool and Bolton Wanderers on 2 April 1995 at Wembley Stadium, London. It was the final match of the 1994–95 Football League Cup, the 35th staging of the Football League Cup, a football competition for the 92 teams in the Premier League and The Football League. Liverpool were appearing in their seventh final, they had previously won four and lost twice. Bolton were appearing in their first final.

<span class="mw-page-title-main">2005 UEFA Super Cup</span> Football match

The 2005 UEFA Super Cup was an association football match between Liverpool of England and CSKA Moscow of Russia on 26 August 2005 at Stade Louis II, Monaco, the annual UEFA Super Cup contested between the winners of the UEFA Champions League and UEFA Cup. Liverpool were appearing in the Super Cup for the fifth time, having won the competition in 1977 and 2001. CSKA Moscow were appearing in the Super Cup for the first time, the first Russian team to appear in the competition.

Shot Quality is a term used in the statistical analysis of ice hockey to indicate the probability that a given shot will result in a goal, based on factors such as the distance of the shot taken, the type of shot and other factors such as the number of players on the ice for each team. It is used to isolate the impact of goaltending performance. By comparing the number of goals allowed to the total of the Shot Quality figures for each shot against, a goaltender can be rated relative to average performance across the league.

Thorold Charles Reep was a British analyst credited with creating the long ball game, which has characterised English football.

<span class="mw-page-title-main">2001 FA Charity Shield</span> Football match

The 2001 FA Charity Shield was the 79th FA Charity Shield, an annual football match played between the winners of the previous season's Premier League and FA Cup. The match was contested between Liverpool, winners of the 2000–01 FA Cup and Manchester United, who won the 2000–01 Premier League on 12 August 2001. It was the first Shield match to be held at the Millennium Stadium following the closure of Wembley Stadium for reconstruction. It was also the final time that the match was played under the FA Charity Shield name, as it was renamed to the FA Community Shield the following year.

<span class="mw-page-title-main">1981 Intercontinental Cup</span> Football match

The 1981 Intercontinental Cup was an association football match between Liverpool of England and Flamengo of Brazil on 13 December 1981 at the National Stadium in Tokyo, Japan. The annual Intercontinental Cup was contested between the winners of the European Cup and Copa Libertadores. Flamengo qualified for the Intercontinental Cup for the first time following their Copa Libertadores Cup success. Liverpool were also appearing in their first Intercontinental Cup. They had declined to take part in 1977 and 1978 after they won the European Cup. On 27 October 2017, following a meeting held in Kolkata, India, the FIFA Council recognised the winners of Intercontinental Cup as world champions.

Advanced Football Analytics was a website dedicated to the analysis of the National Football League (NFL) using mathematical and statistical methods. The site's lead author was noted football researcher and analyst Brian Burke. Burke is a regular contributor to The New York Times' NFL coverage, The Washington Post's Commanders coverage, and supplies research for other notable publications and writers.

Statistical Football prediction is a method used in sports betting, to predict the outcome of football matches by means of statistical tools. The goal of statistical match prediction is to outperform the predictions of bookmakers, who use them to set odds on the outcome of football matches.

Winning and Score Predictor (WASP) is a calculation tool used in cricket to predict scores and possible results of a limited overs match, e.g. One Day and Twenty 20 matches.

<span class="mw-page-title-main">Evaluation of binary classifiers</span> Statistics and machine learning concept

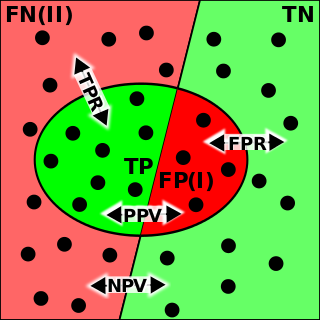
The evaluation of binary classifiers compares two methods of assigning a binary attribute, one of which is usually a standard method and the other is being investigated. There are many metrics that can be used to measure the performance of a classifier or predictor; different fields have different preferences for specific metrics due to different goals. For example, in medicine sensitivity and specificity are often used, while in computer science precision and recall are preferred. An important distinction is between metrics that are independent on the prevalence, and metrics that depend on the prevalence – both types are useful, but they have very different properties.

In ice hockey, analytics is the analysis of the characteristics of hockey players and teams through the use of statistics and other tools to gain a greater understanding of the effects of their performance. Three commonly used basic statistics in ice hockey analytics are "Corsi" and "Fenwick", both of which use shot attempts to approximate puck possession, and "PDO", which is often considered a measure of luck. However, new statistics are being created every year, with "RAPM", regularized adjusted plus-minus, and "xG", expected goals, being created very recently in regards to hockey even though they have been around in other sports before. RAPM tries to isolate a players play driving ability based on multiple factors, while xG tries to show how many goals a player should be expected to add to their team independent of shooting and goalie talent.

Sports analytics are collections of relevant historical statistics that can provide a competitive advantage to a team or individual. Through the collection and analysis of these data, sports analytics inform players, coaches and other staff in order to facilitate decision making both during and prior to sporting events. The term "sports analytics" was popularized in mainstream sports culture following the release of the 2011 film, Moneyball, in which Oakland Athletics General Manager Billy Beane relies heavily on the use of baseball analytics, building upon and extending the established practice of Sabermetrics, to build a competitive team on a minimal budget.

Pitch quantification is the attempt to describe the quality of a pitch using a single numeric value based on quantifiable aspects of an individual baseball pitch. There are two main kinds of pitch quantification. The first is outcome oriented. This means that the result of a given pitch is a component used to calculate the overall numeric value that describes the quality of the pitch. The other kind of pitch quantification does not consider the outcome of a pitch when calculating quality. Rather, it is batter independent. Its quality can be assessed without regard to what the batter does with the pitch.

References

  1. "xG stats for teams and players from the TOP European leagues". understat.com.
  2. "Expected goals in soccer". Eindhoven University of Technology research portal. Retrieved 2020-09-27.
  3. 1 2 3 4 Ryder, Alan (2007). "Product Recall Notice for 'Shot Quality'" (PDF). Retrieved 5 January 2018.
  4. 1 2 3 Macdonald, Brian (March 2012). "An Expected Goals Model for Evaluating NHL Teams and Players" (PDF). Retrieved 3 January 2018.
  5. Goldman, Shayna. "Comparing public expected goal models: How they work and what we should take away from them". The Athletic. Retrieved 30 April 2024.
  6. Carey, Mark; Worville, Tom. "The Athletic's football analytics glossary: explaining xG, PPDA, field tilt and how to use them". The Athletic. Retrieved 30 April 2024.
  7. Kloke, Joshua. "Understanding expected goals and how they impact Toronto FC". The Athletic. Retrieved 30 April 2024.
  8. Barnett, Vic; Hilditch, S (1993). "The Effect of an Artificial Pitch Surface on Home Team Performance in Football (Soccer)". Journal of the Royal Statistical Society. Series A (Statistics in Society). 156 (1): 39–50. doi:10.2307/2982859. JSTOR   2982859.
  9. Barnett, Vic; Hilditch, S (1993). "The Effect of an Artificial Pitch Surface on Home Team Performance in Football (Soccer)". Journal of the Royal Statistical Society. Series A (Statistics in Society). 156 (1): 47. doi:10.2307/2982859. JSTOR   2982859.
  10. 1 2 3 Ensum, Jake; Pollard, Richard; Taylor, Samuel (2004). "Applications of logistic regression to shots at goal in association football: calculation of shot probabilities, quantification of factors and player/team". Journal of Sports Sciences. 22 (6): 504.
  11. Pollard, Richard; Ensum, Jake; Taylor, Samuel (2004). "Estimating the probability of a shot resulting in a goal: The effects of distance, angle and space". International Journal of Soccer and Science. 2 (1): 50–55.
  12. "An examination of expected goals and shot efficiency in soccer" (PDF). Universidad de Alicante.
  13. Hamilton, Howard (8 January 2009). "Moneyball and soccer" . Retrieved 6 February 2018.
  14. 1 2 Itjsma, Sander (13 July 2011). "A chance is a chance is a chance?" . Retrieved 4 January 2018.
  15. Rudd, Sarah (24 September 2011). "A Framework for Tactical Analysis and Individual Offensive Production Assessment in Soccer Using Markov Chains" (PDF). Retrieved 7 February 2018.
  16. 2011 NESSIS - Talk by Sarah Rudd on YouTube
  17. 1 2 3 Green, Sam (12 April 2012). "Assessing the performance of Premier League goalscorers" . Retrieved 4 January 2018.
  18. Ryder, Alan (January 2004). "Shot quality" (PDF). p. 2. Retrieved 4 January 2018.
  19. Ryder, Alan (January 2004). "Shot quality" (PDF). p. 15. Retrieved 5 January 2018.

Further reading