Fan chart (time series)

Last updated

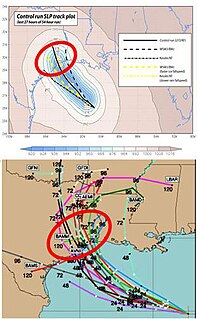
In time series analysis, a fan chart is a chart that joins a simple line chart for observed past data, by showing ranges for possible values of future data together with a line showing a central estimate or most likely value for the future outcomes. As predictions become increasingly uncertain the further into the future one goes, these forecast ranges spread out, creating distinctive wedge or "fan" shapes, hence the term. Alternative forms of the chart can also include uncertainty for past data, such as preliminary data that is subject to revision.

Time series Sequence of data over time

A time series is a series of data points indexed in time order. Most commonly, a time series is a sequence taken at successive equally spaced points in time. Thus it is a sequence of discrete-time data. Examples of time series are heights of ocean tides, counts of sunspots, and the daily closing value of the Dow Jones Industrial Average.

A line chart or line plot or line graph is a type of chart which displays information as a series of data points called 'markers' connected by straight line segments. It is a basic type of chart common in many fields. It is similar to a scatter plot except that the measurement points are ordered and joined with straight line segments. A line chart is often used to visualize a trend in data over intervals of time – a time series – thus the line is often drawn chronologically. In these cases they are known as run charts.

Contents

The term "fan chart" was coined by the Bank of England, which has been using these charts and this term since 1997 in its "Inflation Report" [1] [2] to describe its best prevision of future inflation to the general public. Fan charts have been used extensively in finance and monetary policy, for instance to represent forecasts of inflation.

Bank of England Central bank of the United Kingdom

The Bank of England is the central bank of the United Kingdom and the model on which most modern central banks have been based. Established in 1694 to act as the English Government's banker, and still one of the bankers for the Government of the United Kingdom, it is the world's eighth-oldest bank. It was privately owned by stockholders from its foundation in 1694 until it was nationalised in 1946.

Inflation increase in the general price level of goods and services in an economy over a period of time

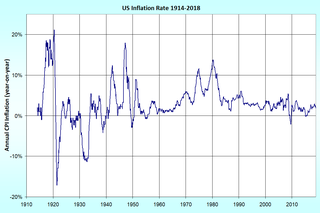
In economics, inflation is a sustained increase in the general price level of goods and services in an economy over a period of time. When the general price level rises, each unit of currency buys fewer goods and services; consequently, inflation reflects a reduction in the purchasing power per unit of money – a loss of real value in the medium of exchange and unit of account within the economy. The measure of inflation is the inflation rate, the annualized percentage change in a general price index, usually the consumer price index, over time. The opposite of inflation is deflation, a sustained decrease in the general price level of goods and services.

Finance Academic discipline studying businesses and investments

Finance is a field that is concerned with the allocation (investment) of assets and liabilities over space and time, often under conditions of risk or uncertainty. Finance can also be defined as the art of money management. Participants in the market aim to price assets based on their risk level, fundamental value, and their expected rate of return. Finance can be split into three sub-categories: public finance, corporate finance and personal finance.

Hypothetical Fan Chart of the Inflation Rate FanChartInfl.jpg
Hypothetical Fan Chart of the Inflation Rate

Implementation

Predicted future values can be diagrammed in various ways; most simply, by a single predicted value, and an upper and lower range around that (three lines total), or by various future intervals, depicted by varying degrees of shading (darkest near the center of the range, fainter near the ends of the range).

There are several ways to represent the forecast density depending on the shape of the forecasting distribution.

Normal distribution probability distribution

In probability theory, the normaldistribution is a very common continuous probability distribution. Normal distributions are important in statistics and are often used in the natural and social sciences to represent real-valued random variables whose distributions are not known. A random variable with a Gaussian distribution is said to be normally distributed and is called a normal deviate.

The mode of a set of data values is the value that appears most often. If X is a discrete random variable, the mode is the value x at which the probability mass function takes its maximum value. In other words, it is the value that is most likely to be sampled.

Median quantile

The median is the value separating the higher half from the lower half of a data sample. For a data set, it may be thought of as the "middle" value. For example, in the data set {1, 3, 3, 6, 7, 8, 9}, the median is 6, the fourth largest, and also the fourth smallest, number in the sample. For a continuous probability distribution, the median is the value such that a number is equally likely to fall above or below it.

In the Bank of England’s implementation it is assumed that the forecast distribution is a two piece normal or split normal density. [6] This density results from joining the two halves of corresponding normal densities with the same mode but different variances. As a result, the split normal density is non-symmetric and uni-modal. In this case, inflation forecast fan charts are usually accompanied with the balance of risks, the probability that the future inflation falls below its modal forecast. In this way, central banks that employ inflation targeting report to the general public not only the more likely forecasts of the inflation rate but also its balance of risks! [7]

In probability theory and statistics, the split normal distribution also known as the two-piece normal distribution results from joining at the mode the corresponding halves of two normal distributions with the same mode but different variances. It is claimed by Johnson et al. that this distribution was introduced by Gibbons and Mylroie and by John. But these are two of several independent rediscoveries of the Zweiseitige Gauss'sche Gesetz introduced in the posthumously published Kollektivmasslehre (1897) of Gustav Theodor Fechner (1801-1887), see Wallis (2014). Surprisingly, another rediscovery has appeared more recently in a finance journal.

Inflation targeting is a monetary policy regime in which a central bank has an explicit target inflation rate for the medium term and announces this inflation target to the public. The assumption is that the best that monetary policy can do to support long-term growth of the economy is to maintain price stability. The central bank uses interest rates, its main short-term monetary instrument.

The split normal density is completely characterized by three parameters, the mode, variance and skewness. Therefore, the fan chart ranges depend on these parameters only. [4] [5] [6] and [8]

In a central bank that employs inflation targeting, the three moments of the inflation forecast distribution are determined as follows:

Related Research Articles

Histogram graphical representation of the distribution of numerical data

A histogram is an accurate representation of the distribution of numerical data. It is an estimate of the probability distribution of a continuous variable and was first introduced by Karl Pearson. It differs from a bar graph, in the sense that a bar graph relates two variables, but a histogram relates only one. To construct a histogram, the first step is to "bin" the range of values—that is, divide the entire range of values into a series of intervals—and then count how many values fall into each interval. The bins are usually specified as consecutive, non-overlapping intervals of a variable. The bins (intervals) must be adjacent, and are often of equal size.

In probability theory and statistics, kurtosis is a measure of the "tailedness" of the probability distribution of a real-valued random variable. In a similar way to the concept of skewness, kurtosis is a descriptor of the shape of a probability distribution and, just as for skewness, there are different ways of quantifying it for a theoretical distribution and corresponding ways of estimating it from a sample from a population. Depending on the particular measure of kurtosis that is used, there are various interpretations of kurtosis, and of how particular measures should be interpreted.

Skewness measure of the asymmetry of random variables

In probability theory and statistics, skewness is a measure of the asymmetry of the probability distribution of a real-valued random variable about its mean. The skewness value can be positive or negative, or undefined.

Uncertainty situation which involves imperfect and/or unknown information

Uncertainty refers to epistemic situations involving imperfect or unknown information. It applies to predictions of future events, to physical measurements that are already made, or to the unknown. Uncertainty arises in partially observable and/or stochastic environments, as well as due to ignorance, indolence, or both. It arises in any number of fields, including insurance, philosophy, physics, statistics, economics, finance, psychology, sociology, engineering, metrology, meteorology, ecology and information science.

Beta distribution Technical aspects: Beta Distribution

In probability theory and statistics, the beta distribution is a family of continuous probability distributions defined on the interval [0, 1] parametrized by two positive shape parameters, denoted by α and β, that appear as exponents of the random variable and control the shape of the distribution. It is a special case of the Dirichlet distribution.

In mathematics, a moment is a specific quantitative measure of the shape of a function. It is used in both mechanics and statistics. If the function represents physical density, then the zeroth moment is the total mass, the first moment divided by the total mass is the center of mass, and the second moment is the rotational inertia. If the function is a probability distribution, then the zeroth moment is the total probability, the first moment is the mean, the second central moment is the variance, the third standardized moment is the skewness, and the fourth standardized moment is the kurtosis. The mathematical concept is closely related to the concept of moment in physics.

Multimodal distribution

In statistics, a bimodal distribution is a continuous probability distribution with two different modes. These appear as distinct peaks in the probability density function, as shown in Figures 1 and 2.

Most of the terms listed in Wikipedia glossaries are already defined and explained within Wikipedia itself. However, glossaries like this one are useful for looking up, comparing and reviewing large numbers of terms together. You can help enhance this page by adding new terms or writing definitions for existing ones.

Ensemble forecasting

Ensemble forecasting is a method used in numerical weather prediction. Instead of making a single forecast of the most likely weather, a set of forecasts is produced. This set of forecasts aims to give an indication of the range of possible future states of the atmosphere. Ensemble forecasting is a form of Monte Carlo analysis. The multiple simulations are conducted to account for the two usual sources of uncertainty in forecast models: (1) the errors introduced by the use of imperfect initial conditions, amplified by the chaotic nature of the evolution equations of the atmosphere, which is often referred to as sensitive dependence on initial conditions; and (2) errors introduced because of imperfections in the model formulation, such as the approximate mathematical methods to solve the equations. Ideally, the verified future atmospheric state should fall within the predicted ensemble spread, and the amount of spread should be related to the uncertainty (error) of the forecast. In general, this approach can be used to make probabilistic forecasts of any dynamical system, and not just for weather prediction.

Skew normal distribution

In probability theory and statistics, the skew normal distribution is a continuous probability distribution that generalises the normal distribution to allow for non-zero skewness.

In statistics, a trimmed estimator is an estimator derived from another estimator by excluding some of the extreme values, a process called truncation. This is generally done to obtain a more robust statistic, and the extreme values are considered outliers. Trimmed estimators also often have higher efficiency for mixture distributions and heavy-tailed distributions than the corresponding untrimmed estimator, at the cost of lower efficiency for other distributions, such as the normal distribution.

The generalized normal distribution or generalized Gaussian distribution (GGD) is either of two families of parametric continuous probability distributions on the real line. Both families add a shape parameter to the normal distribution. To distinguish the two families, they are referred to below as "version 1" and "version 2". However this is not a standard nomenclature.

Beta rectangular distribution

In probability theory and statistics, the beta rectangular distribution is a probability distribution that is a finite mixture distribution of the beta distribution and the continuous uniform distribution. The support is of the distribution is indicated by the parameters a and b, which are the minimum and maximum values respectively. The distribution provides an alternative to the beta distribution such that it allows more density to be placed at the extremes of the bounded interval of support. Thus it is a bounded distribution that allows for outliers to have a greater chance of occurring than does the beta distribution.

Probability distribution fitting or simply distribution fitting is the fitting of a probability distribution to a series of data concerning the repeated measurement of a variable phenomenon.

References

  1. Bank of England, Inflation Report Archived 13 August 2010 at the Wayback Machine
  2. 1 2 Britton, E.; Fisher, P. & J. Whitley (1998). The Inflation Report Projections: Understanding the Fan Chart (PDF). Bank of England Quarterly Bulletin. Retrieved 15 March 2011.
  3. Casella, G.; Berger, R. (2002). Statistical Inference (second ed.). Duxbury Press.
  4. 1 2 Julio, J. M. (2007). The Fan Chart: The Technical Details Of The New Implementation. Banco de la República. Retrieved 11 September 2010, direct link
  5. 1 2 Julio, J. M. (2009). The HPD Fan Chart with Data Revisions (PDF). Banco de la República. Retrieved 8 March 2011, link to software
  6. 1 2 John, S. (1982). "The three-parameter two-piece normal family of distributions and its fitting". Communications in Statistics - Theory and Methods. 11 (8): 879–885. doi:10.1080/03610928208828279.
  7. 1 2 Blix, M.; P. Sellin (1998). Uncertainty Bands for Inflation Forecasts (Working paper). Sveriges Riksbank. Archived from the original on 15 July 2011. Retrieved 2011-03-11.
  8. Kotz, S. Johnson, M. and N. Balakrishnan (1994). Continuous univariate distributions. 1. John Wiley & Sons. Retrieved 11 March 2011.CS1 maint: Multiple names: authors list (link)