Financial economics is the branch of economics characterized by a "concentration on monetary activities", in which "money of one type or another is likely to appear on both sides of a trade". Its concern is thus the interrelation of financial variables, such as share prices, interest rates and exchange rates, as opposed to those concerning the real economy. It has two main areas of focus: asset pricing and corporate finance; the first being the perspective of providers of capital, i.e. investors, and the second of users of capital. It thus provides the theoretical underpinning for much of finance.
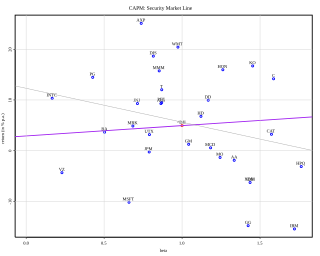
In finance, the capital asset pricing model (CAPM) is a model used to determine a theoretically appropriate required rate of return of an asset, to make decisions about adding assets to a well-diversified portfolio.

The efficient-market hypothesis (EMH) is a hypothesis in financial economics that states that asset prices reflect all available information. A direct implication is that it is impossible to "beat the market" consistently on a risk-adjusted basis since market prices should only react to new information.

Eugene Francis "Gene" Fama is an American economist, best known for his empirical work on portfolio theory, asset pricing, and the efficient-market hypothesis.
In finance, arbitrage pricing theory (APT) is a multi-factor model for asset pricing which relates various macro-economic (systematic) risk variables to the pricing of financial assets. Proposed by economist Stephen Ross in 1976, it is widely believed to be an improved alternative to its predecessor, the capital asset pricing model (CAPM). APT is founded upon the law of one price, which suggests that within an equilibrium market, rational investors will implement arbitrage such that the equilibrium price is eventually realised. As such, APT argues that when opportunities for arbitrage are exhausted in a given period, then the expected return of an asset is a linear function of various factors or theoretical market indices, where sensitivities of each factor is represented by a factor-specific beta coefficient or factor loading. Consequently, it provides traders with an indication of ‘true’ asset value and enables exploitation of market discrepancies via arbitrage. The linear factor model structure of the APT is used as the basis for evaluating asset allocation, the performance of managed funds as well as the calculation of cost of capital. Furthermore, the newer APT model is more dynamic being utilised in more theoretical application than the preceding CAPM model. A 1986 article written by Gregory Connor and Robert Korajczyk, utilised the APT framework and applied it to portfolio performance measurement suggesting that the Jensen coefficient is an acceptable measurement of portfolio performance.
In finance, the beta is a statistic that measures the expected increase or decrease of an individual stock price in proportion to movements of the stock market as a whole. Beta can be used to indicate the contribution of an individual asset to the market risk of a portfolio when it is added in small quantity. It refers to an asset's non-diversifiable risk, systematic risk, or market risk. Beta is not a measure of idiosyncratic risk.
In finance, statistical arbitrage is a class of short-term financial trading strategies that employ mean reversion models involving broadly diversified portfolios of securities held for short periods of time. These strategies are supported by substantial mathematical, computational, and trading platforms.
In finance, a portfolio is a collection of investments.
Active management is an approach to investing. In an actively managed portfolio of investments, the investor selects the investments that make up the portfolio. Active management is often compared to passive management or index investing.
A market anomaly in a financial market is predictability that seems to be inconsistent with theories of asset prices. Standard theories include the capital asset pricing model and the Fama-French Three Factor Model, but a lack of agreement among academics about the proper theory leads many to refer to anomalies without a reference to a benchmark theory. Indeed, many academics simply refer to anomalies as "return predictors", avoiding the problem of defining a benchmark theory.
Momentum investing is a system of buying stocks or other securities that have had high returns over the past three to twelve months, and selling those that have had poor returns over the same period.
Sheridan Dean Titman is a professor of finance at the University of Texas at Austin, where he holds the McAllister Centennial Chair in Financial Services at the McCombs School of Business. He received a B.S. degree (1975) from the University of Colorado and an M.S. (1978) and Ph.D. (1981) from Carnegie Mellon University.
In finance, momentum is the empirically observed tendency for rising asset prices or securities return to rise further, and falling prices to keep falling. For instance, it was shown that stocks with strong past performance continue to outperform stocks with poor past performance in the next period with an average excess return of about 1% per month. Momentum signals have been used by financial analysts in their buy and sell recommendations.
In asset pricing and portfolio management the Fama–French three-factor model is a statistical model designed in 1992 by Eugene Fama and Kenneth French to describe stock returns. Fama and French were colleagues at the University of Chicago Booth School of Business, where Fama still works. In 2013, Fama shared the Nobel Memorial Prize in Economic Sciences for his empirical analysis of asset prices. The three factors are (1) market excess return, (2) the outperformance of small versus big companies, and (3) the outperformance of high book/market versus low book/market companies. There is academic debate about the last two factors.
A period of financial distress occurs when the price of a company or an asset or an index of a set of assets in a market is declining with the danger of a sudden crash of value occurring, either because the company is experiencing increasing problems of cash flow or a deteriorating credit balance or because the price had become too high as a result of a speculative bubble that has now peaked.

In investing and finance, the low-volatility anomaly is the observation that low-volatility stocks have higher returns than high-volatility stocks in most markets studied. This is an example of a stock market anomaly since it contradicts the central prediction of many financial theories that taking higher risk must be compensated with higher returns.
In portfolio management, the Carhart four-factor model is an extra factor addition in the Fama–French three-factor model, proposed by Mark Carhart. The Fama-French model, developed in the 1990, argued most stock market returns are explained by three factors: risk, price and company size. Carhart added a momentum factor for asset pricing of stocks. The Four Factor Model is also known in the industry as the Monthly Momentum Factor (MOM). Momentum is the speed or velocity of price changes in a stock, security, or tradable instrument.
The joint hypothesis problem is the problem that testing for market efficiency is difficult, or even impossible. Any attempts to test for market (in)efficiency must involve asset pricing models so that there are expected returns to compare to real returns. It is not possible to measure 'abnormal' returns without expected returns predicted by pricing models. Therefore, anomalous market returns may reflect market inefficiency, an inaccurate asset pricing model or both.
Factor investing is an investment approach that involves targeting quantifiable firm characteristics or “factors” that can explain differences in stock returns. Security characteristics that may be included in a factor-based approach include size, low-volatility, value, momentum, asset growth, profitability, leverage, term and carry.
Style drift occurs when a mutual fund's actual and declared investment style differs. A mutual fund’s declared investment style can be found in the fund prospectus which investors commonly rely upon to aid their investment decisions. For most investors, they assumed that mutual fund managers will invest according to the advertised guidelines, this is however, not the case for a fund with style drift. Style drift is commonplace in today’s mutual fund industry, making no distinction between developed and developing markets according to studies in the United States by Brown and Goetzmann (1997) and in China as reported in Sina Finance.
