Frequency format hypothesis

Last updated

The frequency format hypothesis is the idea that the brain understands and processes information better when presented in frequency formats rather than a numerical or probability format. Thus according to the hypothesis, presenting information as 1 in 5 people rather than 20% leads to better comprehension. The idea was proposed by German scientist Gerd Gigerenzer, after compilation and comparison of data collected between 1976 and 1997.

Contents

Origin

Automatic encoding

Certain information about one's experience is often stored in the memory using an implicit encoding process. Where did you sit last time in class? Do you say the word hello or charisma more? People are very good at answering such questions without actively thinking about it or not knowing how they got that information in the first place. This was the observation that lead to Hasher and Zacks' 1979 study on frequency.

Through their research work, Hasher and Zacks found out that information about frequency is stored without the intention of the person. [1] Also, training and feedback does not increase ability to encode frequency. [2] Frequency information was also found to be continually registered in the memory, regardless of age, ability or motivation. [1] [3] The ability to encode frequency also does not decrease with old age, depression or multiple task requirements. [4] They called this characteristic of the frequency encoding as automatic encoding. [2]

Infant study

Another important evidence for the hypothesis came through the study of infants. In one study, 40 newborn infants were tested for their ability to discriminate between 2 dots versus 3 dots and 4 dots versus 6 dots. [5] Even though infants were able to make the discrimination between 2 versus 3 dots, they were not able to distinguish between 4 versus 6 dots. The tested new born infants were only 21 hours to 144 hours old.

Similarly in another study, to test whether infants could recognize numerical correspondences, Starkey et al. designed a series of experiments in which 6 to 8 month old infants were shown pairs of either a display of two objects or a display of three objects. [6] While the displays were still visible, infants heard either two or three drumbeats. Measurement of looking time revealed that the infants looked significantly longer toward the display that matched the number of sounds.

The contingency rule

Later on, Barbara A. Spellmen from University of Texas describes the performance of humans in determining cause and effects as the contingency rule ΔP, defined as

P = P(E|C) - P(E|~C)

where P(E|C) is the probability of the effect given the presence of the proposed cause and P(E|~C) is the probability of the effect given the absence of the proposed cause. [7] Suppose we wish to evaluate the performance of a fertilizer. If the plants bloomed 15 out of 20 times when the fertilizer was used, and only 5 out of 20 plants bloomed in the absence of the fertilizer. In this case

    P(E|C) = 15/20 = 0.75     P(E|~C)=  5/20 = 0.25     ΔP = P(E|C) - P(E|~C)     ΔP = 0.75 - 0.25        = 0.50

The ΔP value as a result is always bound between -1 and 1. Even though the contingency rule is a good model of what humans do in predicting one event causation of another, when it comes to predicting outcomes of events with multiple causes, there exists a large deviation from the contingency rule called the cue-interaction-effect.

Cue-interaction-effect

In 1993 Baker Mercer and his team used video games to demonstrate this effect. Each test subject is given the task of helping a tank travel across a mine field using a button that sometimes worked correctly in camouflaging and sometimes did not. [8] As a second cause a spotter plane, a friend or an enemy would sometimes fly over the tank. After 40 trials, the test subjects were asked to evaluate the effectiveness of the camouflage and the plane in helping the tank through the minefield. They were asked to give it a number between -100 and 100.

Mathematically, there are two contingency values possible for the plane: the plane was either irrelevant to tank's success, then ΔP=0(.5/0 condition) and the plane was relevant to the plane's success, ΔP=1 (.5/1 condition). Even though the ΔP for the camouflage in either condition is 0.5, the test subjects evaluated the ΔP of camouflage to be much higher in the .5/0 condition than in the .5/1 condition. The results are shown in table below.

ConditionΔPplaneΔPcamouflageCamouflage rating given
0.5/00.549
0.5/11.5-6

In each case, the test subjects are very good in noticing when two events occur together. [9] When the plane is relevant to the camouflage success, they mark the camouflage success high and when the plane doesn't affect the camouflage's success, they mark the camouflage's success value low.

Gigerenzer contributions

Several experiments have been performed that shows that ordinary and sometimes skilled people make basic probabilistic fallacies, especially in the case of Bayesian inference quizzes. [10] [11] [12] [13] Gigerenzer claims that the observed errors are consistent with the way we acquired mathematical abilities during the course of human evolution. [14] [15] Gigerenzer argues that the problem with these quizzes is the way the information is presented. During these quizzes the information is presented in percentages. [16] [17] Gigerenzer argues that presenting information in frequency format would help in solving these puzzles accurately. He argues that evolutionary the brain physiologically evolved to understand frequency information better than probability information. Thus if the Bayesian quizzes were asked in frequency format, then test subjects would be better at it. Gigerenzer calls this idea the frequency format hypothesis in his published paper titled "The psychology of good judgment: frequency formats and simple algorithms". [14]

Supporting arguments

Evolutionary perspective

Gigerenzer argued that from an evolutionary point of view, a frequency method was easier and more communicable compared to conveying information in probability format. [14] He argues that probability and percentages are rather recent forms of representation as opposed to frequency. The first known existence of a representative form of percentages is in the seventeenth century. [18] He also argues that more information is given in the case of frequency representation. For instance, conveying data as 50 out of 100, using the frequency form, as opposed to saying 50%, using the probability format, gives the users more information about the sample size. This can in turn make the data and results more reliable and more appealing.

Elaborate encoding

An explanation given as to why people choose encounter frequency is that in the case of frequencies, the subjects are given vivid descriptions, while with probabilities only a dry number is given to the subject. [19] Therefore, in the case of frequency, subjects are given more recall cues. This could in turn mean that the frequency encounters are remembered by the brain more often than in the case of probability numbers. Thus this might be a reason why people in general intuitively choose frequency encountered choices rather than probability based choices.

Sequential input

Yet another explanation offered by the authors is the fact that in the case of frequency, people often come across them multiple times and have a sequential input, compared to a probability value, which is given in one time. [19] From John Medina’s Brain Rules, sequential input can lead to a stronger memory than a onetime input. This can be a primary reason why humans choose frequency encounters over probability. [20]

Easier storage

Another rationale provided in justifying the frequency format hypothesis is that using frequencies makes it easier to keep track and update a database of events. For example, if an event happened 3 out of 6 times, the probability format would store this as 50%, whereas in frequency format it is stored as 3 out of 6. Now imagine that the event does not happen this time. The frequency format can be updated to 3 out of 7. However, for the probability format updating is extremely harder.

Classifying information

Frequency representation can also be helpful in keeping track of classes and statistical information. Picture a scenario where every 500 out of 1000 people die due to lung cancer. However, 40 of those 1000 were smokers and 20 out of the 40 had a genetic condition predisposed to possible lung cancer. Such class division and information storage can only be done using frequency format, since a number .05% probability of having lung cancer does not give any information or allow to calculate such information.

Refuting arguments

Nested-sets hypothesis

Frequency-format studies tend to share a confound -- namely that when presenting frequency information, the researchers also make clear the reference class they are referring to. For example, consider these three different ways to formulate the same problem: [21] [10]

Probability Format

"Consider a test to detect a disease that a given American has a 1/1000 chance of getting. An individual that does not have the disease has a 50/1000 chance of testing positive. An individual that does have the disease will definitely test positive.

What is the chance that a person found to have a positive result actually has the disease, assuming that you nothing about the person’s symptoms or signs? _____%"

Frequency Format

"One out of every 1000 Americans has disease X. A test has been developed to detect when a person has disease X. Every time the test is given to a person who has the disease, the test comes out positive. But sometimes the test also comes out positive when it is given to a person who is completely healthy. Specifically, out of every 1000 people who are perfectly healthy, 50 of them test positive for the disease.

Imagine we have assembled a random sample of 1000 Americans. They were selected by lottery. Those who conducted the lottery had no information about the health status of any of these people.

Given the information above, on average, how many people who test positive for the disease actually have the disease? _____out of_____."

Probability Format Highlighting Set-Subset Structure of the Problem

"The prevalence of disease X among Americans is 1/1000. A test has been developed to detect when a person has disease X. Every time the test is given to a person who has the disease, the test comes out positive. But sometimes the test also comes out positive when it is given to a person who is completely healthy. Specifically, the chance is 50/1000 that someone who is perfectly healthy would test positive for the disease.

Imagine we have just given the test to a random sample of Americans. They were selected by lottery. Those who conducted the lottery had no information about the health status of any of these people.

What is the chance that a person found to have a positive result actually has the disease? _____%"

All three problems make clear the set of 1/1000 Americans who have the disease and that the test has perfect sensitivity (100% of people with the disease will receive a positive test) and that 50/1000 healthy people will receive a positive test (e.g., false positives). However, the latter two formats additionally highlights the separate classes within the population (e.g., positive test (with disease/without disease), negative test (without disease)), and therefore makes it easier for people to choose the correct class (people with a positive test) to reason with (thus generating something close to the correct answer—1/51/~2%.) Both frequency and Probability format highlighting set-subset structures lead to similar rates of correct answers, whereas the probability format alone leads to fewer correct answers (as people are likely to rely on the incorrect class in this case.) Research has also shown that one can reduce performance in the frequency format by disguising the set-subset relationships in the problem (just as in the standard probability format), thus demonstrating that it is not, in fact, the frequency format, but instead, the highlighting of the set-subset structure that improves judgments. [10]

Ease of comparison

Critics of the frequency format hypothesis argue that probability formats allow for much easier comparison than frequency format representation of data. In some cases, using frequency formats actually does allow for easy comparison. If team A wins 19 of its 29 games, and another team B wins 10 of its 29 games, one can clearly see that team A is much better than team B. However comparison in frequency format is not always this clear and easy. If team A won 19 out of its 29 games, comparing this team with team B that won 6 out of its 11 games becomes much harder in frequency format. But, in the probability format, one could say since 65.6%(19/29) is greater than 54.5%, one could much easily compare the two.

Memory burden

Tooby and Cosmides had argued that frequency representation helps update data easier each time one gets new data. [22] However this involves updating both numbers. Referring back to the example of teams, if team A won its 31st game, note that both the number of games won(20->21) and the number of games played(30->31) has to be updated. In the case of probability the only number to be updated is the single percentage number. Also, this number could be updated over the course of 10 games instead of updating each game, which cannot be done in the case of frequency format.

Related Research Articles

A statistical hypothesis test is a method of statistical inference used to decide whether the data at hand sufficiently support a particular hypothesis. Hypothesis testing allows us to make probabilistic statements about population parameters.

<span class="mw-page-title-main">Cognitive bias</span> Systematic pattern of deviation from norm or rationality in judgment

A cognitive bias is a systematic pattern of deviation from norm or rationality in judgment. Individuals create their own "subjective reality" from their perception of the input. An individual's construction of reality, not the objective input, may dictate their behavior in the world. Thus, cognitive biases may sometimes lead to perceptual distortion, inaccurate judgment, illogical interpretation, or what is broadly called irrationality.

<span class="mw-page-title-main">Prosecutor's fallacy</span> Fallacy of statistical reasoning

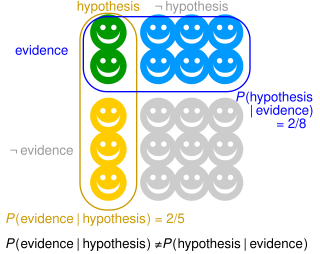
The prosecutor's fallacy is a fallacy of statistical reasoning involving a test for an occurrence, such as a DNA match. A positive result in the test may paradoxically be more likely to be an erroneous result than an actual occurrence, even if the test is very accurate. The fallacy is named because it is typically used by a prosecutor to exaggerate the probability of a criminal defendant's guilt. The fallacy can be used to support other claims as well – including the innocence of a defendant.

Confirmation bias is the tendency to search for, interpret, favor, and recall information in a way that confirms or supports one's prior beliefs or values. People display this bias when they select information that supports their views, ignoring contrary information, or when they interpret ambiguous evidence as supporting their existing attitudes. The effect is strongest for desired outcomes, for emotionally charged issues, and for deeply entrenched beliefs. Confirmation bias cannot be eliminated, but it can be managed, for example, by education and training in critical thinking skills.

<span class="mw-page-title-main">Chi-squared test</span> Statistical hypothesis test

A chi-squared test is a statistical hypothesis test used in the analysis of contingency tables when the sample sizes are large. In simpler terms, this test is primarily used to examine whether two categorical variables are independent in influencing the test statistic. The test is valid when the test statistic is chi-squared distributed under the null hypothesis, specifically Pearson's chi-squared test and variants thereof. Pearson's chi-squared test is used to determine whether there is a statistically significant difference between the expected frequencies and the observed frequencies in one or more categories of a contingency table. For contingency tables with smaller sample sizes, a Fisher's exact test is used instead.

The availability heuristic, also known as availability bias, is a mental shortcut that relies on immediate examples that come to a given person's mind when evaluating a specific topic, concept, method, or decision. This heuristic, operating on the notion that, if something can be recalled, it must be important, or at least more important than alternative solutions not as readily recalled, is inherently biased toward recently acquired information.

Hindsight bias, also known as the knew-it-all-along phenomenon or creeping determinism, is the common tendency for people to perceive past events as having been more predictable than they were.

The mere-exposure effect is a psychological phenomenon by which people tend to develop a preference for things merely because they are familiar with them. In social psychology, this effect is sometimes called the familiarity principle. The effect has been demonstrated with many kinds of things, including words, Chinese characters, paintings, pictures of faces, geometric figures, and sounds. In studies of interpersonal attraction, the more often people see a person, the more pleasing and likeable they find that person.

The conjunction fallacy is an inference from an array of particulars, in violation of the laws of probability, that a conjoint set of two or more conclusions is likelier than any single member of that same set. It is a type of formal fallacy.

<span class="mw-page-title-main">Base rate fallacy</span> Error in thinking which involves under-valuing base rate information

The base rate fallacy, also called base rate neglect or base rate bias, is a type of fallacy in which people tend to ignore the base rate in favor of the individuating information . Base rate neglect is a specific form of the more general extension neglect.

The recognition heuristic, originally termed the recognition principle, has been used as a model in the psychology of judgment and decision making and as a heuristic in artificial intelligence. The goal is to make inferences about a criterion that is not directly accessible to the decision maker, based on recognition retrieved from memory. This is possible if recognition of alternatives has relevance to the criterion. For two alternatives, the heuristic is defined as:

If one of two objects is recognized and the other is not, then infer that the recognized object has the higher value with respect to the criterion.

<span class="mw-page-title-main">Gerd Gigerenzer</span> German cognitive psychologist

Gerd Gigerenzer is a German psychologist who has studied the use of bounded rationality and heuristics in decision making. Gigerenzer is director emeritus of the Center for Adaptive Behavior and Cognition (ABC) at the Max Planck Institute for Human Development and director of the Harding Center for Risk Literacy, both in Berlin.

Cue validity is the conditional probability that an object falls in a particular category given a particular feature or cue. The term was popularized by Beach (1964), Reed (1972) and especially by Eleanor Rosch in her investigations of the acquisition of so-called basic categories.

The negativity bias, also known as the negativity effect, is a cognitive bias that, even when of equal intensity, things of a more negative nature have a greater effect on one's psychological state and processes than neutral or positive things. In other words, something very positive will generally have less of an impact on a person's behavior and cognition than something equally emotional but negative. The negativity bias has been investigated within many different domains, including the formation of impressions and general evaluations; attention, learning, and memory; and decision-making and risk considerations.

In probability and statistics, the base rate is the class of probabilities unconditional on "featural evidence" (likelihoods).

<span class="mw-page-title-main">Psychology of reasoning</span> Study of how people reason

The psychology of reasoning is the study of how people reason, often broadly defined as the process of drawing conclusions to inform how people solve problems and make decisions. It overlaps with psychology, philosophy, linguistics, cognitive science, artificial intelligence, logic, and probability theory.

Metamemory or Socratic awareness, a type of metacognition, is both the introspective knowledge of one's own memory capabilities and the processes involved in memory self-monitoring. This self-awareness of memory has important implications for how people learn and use memories. When studying, for example, students make judgments of whether they have successfully learned the assigned material and use these decisions, known as "judgments of learning", to allocate study time.

Heuristics is the process by which humans use mental short cuts to arrive at decisions. Heuristics are simple strategies that humans, animals, organizations, and even machines use to quickly form judgments, make decisions, and find solutions to complex problems. Often this involves focusing on the most relevant aspects of a problem or situation to formulate a solution. While heuristic processes are used to find the answers and solutions that are most likely to work or be correct, they are not always right or the most accurate. Judgments and decisions based on heuristics are simply good enough to satisfy a pressing need in situations of uncertainty, where information is incomplete. In that sense they can differ from answers given by logic and probability.

Social heuristics are simple decision making strategies that guide people's behavior and decisions in the social environment when time, information, or cognitive resources are scarce. Social environments tend to be characterised by complexity and uncertainty, and in order to simplify the decision making process, people may use heuristics, which are decision making strategies that involve ignoring some information or relying on simple rules of thumb.

Intuitive statistics, or folk statistics, refers to the cognitive phenomenon where organisms use data to make generalizations and predictions about the world. This can be a small amount of sample data or training instances, which in turn contribute to inductive inferences about either population-level properties, future data, or both. Inferences can involve revising hypotheses, or beliefs, in light of probabilistic data that inform and motivate future predictions. The informal tendency for cognitive animals to intuitively generate statistical inferences, when formalized with certain axioms of probability theory, constitutes statistics as an academic discipline.

References

  1. 1 2 Hasher, L.; Zacks, R. (1984). "Automatic processing of fundamental information: the case of frequency of occurrence". The American Psychologist. 39 (12): 1372–1388. doi:10.1037/0003-066x.39.12.1372. PMID   6395744.
  2. 1 2 Hasher, Lynn; Zacks, Rose T. (1979). "Automatic and effortful processes in memory". Journal of Experimental Psychology: General. 108 (3): 356–388. doi:10.1037/0096-3445.108.3.356.
  3. Hasher, L.; Chromiak, W. (1977). "The processing of frequency information: An automatic mechanism?". Journal of Verbal Learning and Verbal Behavior. 16 (2): 173–184. doi:10.1016/s0022-5371(77)80045-5.
  4. Hasher
  5. Antell, S. E.; Keating, D. P. (1983). "Perception of numerical invariance in neonates". Child Development. 54 (3): 695–701. doi:10.2307/1130057. JSTOR   1130057. PMID   6851716.
  6. Starkey, P.; Spelke, E.; Gelman, R. (1990). "Numerical abstraction by human infants". Cognition. 36 (2): 97–127. doi:10.1016/0010-0277(90)90001-z. PMID   2225757. S2CID   706365.
  7. Spellman, B. A. (1996). "Acting as intuitive scientists: Contingency judgments are made while controlling for alternative potential causes". Psychological Science. 7 (6): 337–342. doi:10.1111/j.1467-9280.1996.tb00385.x. S2CID   143455322.
  8. Baker, A.G.; Mercier, Pierre; Vallée-Tourangeau, Frédéric; Frank, Robert; Pan, Maria (1993). "Selective Associations and Causality Judgments: Presence of a Strong Causal Factor May Reduce Judgments of a Weaker One". Journal of Experimental Psychology: Learning, Memory, and Cognition. 19 (2): 414–432. doi:10.1037/0278-7393.19.2.414.
  9. A.G. Baker, Robin A. Murphy, Associative and Normative Models of Causal Induction: Reacting to Versus Understanding Cause, In: David R. Shanks, Douglas L. Medin and Keith J. Holyoak, Editor(s), Psychology of Learning and Motivation, Academic Press, 1996, Volume 34, Pages 1-45, ISSN 0079-7421, ISBN   978-0-12-543334-1, doi : 10.1016/S0079-7421(08)60557-5
  10. 1 2 3 Sloman, S. A.; Over, D.; Slovak, L.; Stibel, J. M. (2003). "Frequency illusions and other fallacies". Organizational Behavior and Human Decision Processes. 91 (2): 296–309. CiteSeerX   10.1.1.19.8677 . doi:10.1016/s0749-5978(03)00021-9.
  11. Birnbaum, M. H.; Mellers, B. A. (1983). "Bayesian inference: Combining base rates with opinions of sources who vary in credibility". Journal of Personality and Social Psychology. 45 (4): 792–804. doi:10.1037/0022-3514.45.4.792.
  12. Murphy, G. L.; Ross, B. H. (2010). "Uncertainty in category-based induction: When do people integrate across categories?". Journal of Experimental Psychology: Learning, Memory, and Cognition. 36 (2): 263–276. doi:10.1037/a0018685. PMC   2856341 . PMID   20192530.
  13. Sirota, M.; Juanchich, M. (2011). "ROLE OF NUMERACY AND COGNITIVE REFLECTION IN BAYESIAN REASONING WITH NATURAL FREQUENCIES". Studia Psychologica. 53 (2): 151–161.
  14. 1 2 3 Gigerenzer, G (1996). "The psychology of good judgment. frequency formats and simple algorithms". Medical Decision Making. 16 (3): 273–280. doi:10.1177/0272989X9601600312. PMID   8818126. S2CID   14885938.
  15. Gigerenzer, G. (2002). Calculated risks, how to know when numbers deceive you. (p. 310). New York: Simon & Schuster.
  16. Daston, L.; Gigerenzer, G. (1989). "The Problem of Irrationality". Science. 244 (4908): 1094–5. doi:10.1126/science.244.4908.1094. PMID   17741045.
  17. Reyna, V. F.; Brainerd, C. J. (2008). "Numeracy, ratio bias, and denominator neglect in judgments of risk and probability". Learning and Individual Differences. 18 (1): 89–107. doi:10.1016/j.lindif.2007.03.011.
  18. Hacking, I. (1986). The emergence of probability, a philosophical study of early ideas about probability, induction and statistical inference. London: Cambridge Univ Pr.
  19. 1 2 Obrecht, N. A.; Chapman, G. B.; Gelman, R. (2009). "An encounter frequency account of how experience affects likelihood estimation". Memory & Cognition. 37 (5): 632–643. doi: 10.3758/mc.37.5.632 . PMID   19487755.
  20. Medina, J. (2010). Brain rules, 12 principles for surviving and thriving at work, home, and school. Seattle, WA: Pear Pr.
  21. Cosmides, L; Tooby, J (1996). "Are humans good intuitive statisticians after all? Rethinking some conclusions from the literature on judgment under uncertainty". Cognition. 58 (1): 1–73. doi:10.1016/0010-0277(95)00664-8. S2CID   18631755.
  22. Cosmides, L.; Tooby, J. (1996). "Are humans good intuitive statisticians after all? Rethinking some conclusions from the literature on judgment under uncertainty". Cognition. 58: 1–73. CiteSeerX   10.1.1.131.8290 . doi:10.1016/0010-0277(95)00664-8. S2CID   18631755.