
Remote sensing is the acquisition of information about an object or phenomenon without making physical contact with the object, in contrast to in situ or on-site observation. The term is applied especially to acquiring information about Earth and other planets. Remote sensing is used in numerous fields, including geophysics, geography, land surveying and most Earth science disciplines ; it also has military, intelligence, commercial, economic, planning, and humanitarian applications, among others.

The Landsat program is the longest-running enterprise for acquisition of satellite imagery of Earth. It is a joint NASA / USGS program. On 23 July 1972, the Earth Resources Technology Satellite was launched. This was eventually renamed to Landsat 1 in 1975. The most recent, Landsat 9, was launched on 27 September 2021.

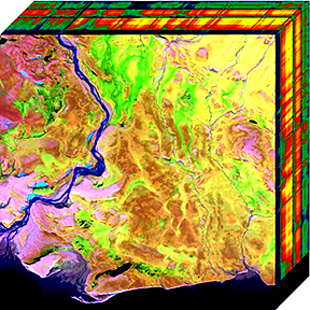
False color refers to a group of color rendering methods used to display images in color which were recorded in the visible or non-visible parts of the electromagnetic spectrum. A false-color image is an image that depicts an object in colors that differ from those a photograph would show. In this image, colors have been assigned to three different wavelengths that human eyes cannot normally see.

Satellite images are images of Earth collected by imaging satellites operated by governments and businesses around the world. Satellite imaging companies sell images by licensing them to governments and businesses such as Apple Maps and Google Maps.

Landsat 3 is the third satellite of the Landsat program. It was launched on March 5, 1978, with the primary goal of providing a global archive of satellite imagery. Unlike later Landsat satellites, Landsat 3 was managed solely by NASA. Landsat 3 decommissioned on September 7, 1983, beyond its design life of one year. The data collected during Landsat 3's lifetime was used by 31 countries. Countries that cannot afford their own satellite are able to use the data for ecological preservation efforts and to determine the location of natural resources.

Multispectral imaging captures image data within specific wavelength ranges across the electromagnetic spectrum. The wavelengths may be separated by filters or detected with the use of instruments that are sensitive to particular wavelengths, including light from frequencies beyond the visible light range, i.e. infrared and ultra-violet. It can allow extraction of additional information the human eye fails to capture with its visible receptors for red, green and blue. It was originally developed for military target identification and reconnaissance. Early space-based imaging platforms incorporated multispectral imaging technology to map details of the Earth related to coastal boundaries, vegetation, and landforms. Multispectral imaging has also found use in document and painting analysis.
In imaging spectroscopy each pixel of an image acquires many bands of light intensity data from the spectrum, instead of just the three bands of the RGB color model. More precisely, it is the simultaneous acquisition of spatially coregistered images in many spectrally contiguous bands.

The normalized difference vegetation index (NDVI) is a widely-used metric for quantifying the health and density of vegetation using sensor data. It is calculated from spectrometric data at two specific bands: red and near-infrared. The spectrometric data is usually sourced from remote sensors, such as satellites.
Hyperspectral imaging collects and processes information from across the electromagnetic spectrum. The goal of hyperspectral imaging is to obtain the spectrum for each pixel in the image of a scene, with the purpose of finding objects, identifying materials, or detecting processes. There are three general types of spectral imagers. There are push broom scanners and the related whisk broom scanners, which read images over time, band sequential scanners, which acquire images of an area at different wavelengths, and snapshot hyperspectral imagers, which uses a staring array to generate an image in an instant.
The FLuorescence EXplorer (FLEX) is a planned mission by the European Space Agency to launch a satellite to monitor the global steady-state chlorophyll fluorescence in terrestrial vegetation. FLEX was selected for funding on 19 November 2015 and will be launched on a Vega C rocket from Guiana Space Centre in mid-2025.

Landsat 2 is the second satellite of the Landsat program. The spacecraft originally carried a designation of ERTS-B but was renamed "Landsat 2" prior to its launch on January 22, 1975. The objective of the satellite was to acquire global, seasonal data in medium resolution from a near-polar, Sun-synchronous orbit. The satellite, built by General Electric, acquired data with the Return Beam Vidicon (RBV) and the Multispectral Scanner (MSS). Despite having a design life of one year, Landsat 2 operated for over seven years, finally ceasing operations on February 25, 1982.
Electro-optical MASINT is a subdiscipline of Measurement and Signature Intelligence, (MASINT) and refers to intelligence gathering activities which bring together disparate elements that do not fit within the definitions of Signals Intelligence (SIGINT), Imagery Intelligence (IMINT), or Human Intelligence (HUMINT).

Landsat 8 is an American Earth observation satellite launched on 11 February 2013. It is the eighth satellite in the Landsat program; the seventh to reach orbit successfully. Originally called the Landsat Data Continuity Mission (LDCM), it is a collaboration between NASA and the United States Geological Survey (USGS). NASA Goddard Space Flight Center in Greenbelt, Maryland, provided development, mission systems engineering, and acquisition of the launch vehicle while the USGS provided for development of the ground systems and will conduct on-going mission operations. It comprises the camera of the Operational Land Imager (OLI) and the Thermal Infrared Sensor (TIRS), which can be used to study Earth surface temperature and is used to study global warming.
The marine optical buoy (MOBY) measures light at and very near the sea surface in a specific location over a long period of time, serving as part of an ocean color observation system. Satellites are another component of the system, providing global coverage through remote sensing; however, satellites measure light above the Earth's atmosphere, becoming subject to interference from the atmosphere itself and other light sources. The Marine Optical Buoy helps alleviate that interference and thus improve the quality of the overall ocean color observation system.
Multispectral remote sensing is the collection and analysis of reflected, emitted, or back-scattered energy from an object or an area of interest in multiple bands of regions of the electromagnetic spectrum. Subcategories of multispectral remote sensing include hyperspectral, in which hundreds of bands are collected and analyzed, and ultraspectral remote sensing where many hundreds of bands are used. The main purpose of multispectral imaging is the potential to classify the image using multispectral classification. This is a much faster method of image analysis than is possible by human interpretation.
Video spectroscopy combines spectroscopic measurements with video technique. This technology has resulted from recent developments in hyperspectral imaging. A video capable imaging spectrometer can work like a camcorder and provide full frame spectral images in real-time that enables advanced mobility and hand-held imaging spectroscopy. Unlike hyperspectral line scanners, a video spectrometer can spectrally capture randomly and quickly moving objects and processes. The product of a conventional hyperspectral line scanner has typically been called a hyperspectral data cube. A video spectrometer produces a spectral image data series at much higher speeds (1 ms) and frequencies (25 Hz) that is called a hyperspectral video. This technology can initiate novel solutions and challenges in spectral tracking, field spectroscopy, spectral mobile mapping, real-time spectral monitoring and many other applications.

Hakeem Muata Oluseyi is an American astrophysicist, cosmologist, inventor, educator, science communicator, author, actor, veteran, and humanitarian.

Remote sensing is used in the geological sciences as a data acquisition method complementary to field observation, because it allows mapping of geological characteristics of regions without physical contact with the areas being explored. About one-fourth of the Earth's total surface area is exposed land where information is ready to be extracted from detailed earth observation via remote sensing. Remote sensing is conducted via detection of electromagnetic radiation by sensors. The radiation can be naturally sourced, or produced by machines and reflected off of the Earth surface. The electromagnetic radiation acts as an information carrier for two main variables. First, the intensities of reflectance at different wavelengths are detected, and plotted on a spectral reflectance curve. This spectral fingerprint is governed by the physio-chemical properties of the surface of the target object and therefore helps mineral identification and hence geological mapping, for example by hyperspectral imaging. Second, the two-way travel time of radiation from and back to the sensor can calculate the distance in active remote sensing systems, for example, Interferometric synthetic-aperture radar. This helps geomorphological studies of ground motion, and thus can illuminate deformations associated with landslides, earthquakes, etc.

The moment distance index (MDI) is a shape-based metric or shape index that can be used to analyze spectral reflectance curves and waveform LiDAR, proposed by Salas and Henebry in 2014. In the case of spectral data, the shape of the reflectance curve should unmask fine points of the spectra usually not considered by existing band-specific indices. It has been used to identify spectral regions for chlorophyll and carotenoids, detect greenhouses using WorldView-2, Landsat, and Sentinel-2 satellite data, identify greenhouse crops, compute canopy heights, estimate green vegetation fraction, and optimize Fourier-transform infrared (FTIR) scans for soil spectroscopy.

Tropospheric Emissions: Monitoring of Pollution (TEMPO) is a space-based spectrometer designed to measure air pollution across greater North America at a high resolution and on an hourly basis. The ultraviolet–visible spectrometer will provide hourly data on ozone, nitrogen dioxide, and formaldehyde in the atmosphere.