Related Research Articles
Sales are activities related to selling or the number of goods sold in a given targeted time period. The delivery of a service for a cost is also considered a sale. A period during which goods are sold for a reduced price may also be referred to as a "sale".
A marketing plan may be part of an overall business plan. Solid marketing strategy is the foundation of a well-written marketing plan so that goals may be achieved. While a marketing plan contains a list of actions, without a sound strategic foundation, it is of little use to a business.

Direct marketing is a form of communicating an offer, where organizations communicate directly to a pre-selected customer and supply a method for a direct response. Among practitioners, it is also known as direct response marketing. By contrast, advertising is of a mass-message nature.
Affiliate marketing is a marketing arrangement in which affiliates receive a commission for each visit, signup or sale they generate for a merchant. This arrangement allows businesses to outsource part of the sales process. It is a form of performance-based marketing where the commission acts as an incentive for the affiliate; this commission is usually a percentage of the price of the product being sold, but can also be a flat rate per referral.

A pie chart is a circular statistical graphic which is divided into slices to illustrate numerical proportion. In a pie chart, the arc length of each slice is proportional to the quantity it represents. While it is named for its resemblance to a pie which has been sliced, there are variations on the way it can be presented. The earliest known pie chart is generally credited to William Playfair's Statistical Breviary of 1801.

Infographics are graphic visual representations of information, data, or knowledge intended to present information quickly and clearly. They can improve cognition by utilizing graphics to enhance the human visual system's ability to see patterns and trends. Similar pursuits are information visualization, data visualization, statistical graphics, information design, or information architecture. Infographics have evolved in recent years to be for mass communication, and thus are designed with fewer assumptions about the readers' knowledge base than other types of visualizations. Isotypes are an early example of infographics conveying information quickly and easily to the masses.

A performance indicator or key performance indicator (KPI) is a type of performance measurement. KPIs evaluate the success of an organization or of a particular activity in which it engages. KPIs provide a focus for strategic and operational improvement, create an analytical basis for decision making and help focus attention on what matters most.
In marketing, lead generation is the initiation of consumer interest or enquiry into the products or services of a business. A lead is the contact information and, in some cases, demographic information of a customer who is interested in a specific product or service.
Service Merchandise was a retail chain of catalog showrooms carrying jewelry, toys, sporting goods, and electronics. The company, which first began in 1934 as a five-and-dime store, was in existence for 68 years before ceasing operations in 2002.
In online marketing, a landing page, sometimes known as a "lead capture page", "single property page", "static page", "squeeze page" or a "destination page", is a single web page that appears in response to clicking on a search engine optimized search result, marketing promotion, marketing email or an online advertisement. The landing page will usually display directed sales copy that is a logical extension of the advertisement, search result or link. Landing pages are used for lead generation. The actions that a visitor takes on a landing page is what determines an advertiser's conversion rate. A landing page may be part of a microsite or a single page within an organization's main web site.

Demand-chain management (DCM) is the management of relationships between suppliers and customers to deliver the best value to the customer at the least cost to the demand chain as a whole. Demand-chain management is similar to supply-chain management but with special regard to the customers.
Business support systems (BSS) are the components that a telecommunications service provider uses to run its business operations towards customers.
Lead management is a set of methodologies, systems, and practices designed to generate new potential business clientele, generally operated through a variety of marketing campaigns or programs. Lead management facilitates a business's connection between its outgoing consumer advertising and the responses to that advertising. These processes are designed for business-to-business and direct-to-consumer strategies. Lead management is in many cases a precursor to sales management, customer relationship management and customer experience management. This critical connectivity facilitates business profitability through the acquisition of new customers, selling to existing customers, and creating a market brand. This process has also accurately been referred to as customer acquisition management.
Path analysis, is the analysis of a path, which is a portrayal of a chain of consecutive events that a given user or cohort performs during a set period of time while using a website, online game, or eCommerce platform. As a subset of behavioral analytics, path analysis is a way to understand user behavior in order to gain actionable insights into the data. Path analysis provides a visual portrayal of every event a user or cohort performs as part of a path during a set period of time.
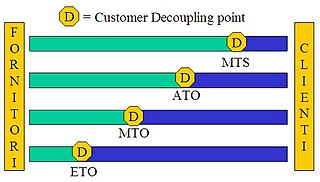
Order fulfillment is in the most general sense the complete process from point of sales inquiry to delivery of a product to the customer. Sometimes, it describes the more narrow act of distribution or the logistics function. In the broader sense, it refers to the way firms respond to customer orders.
Lead scoring is a methodology used to rank prospects against a scale that represents the perceived value each lead represents to the organization. The resulting score is used to determine which leads a receiving function will engage, in order of priority.
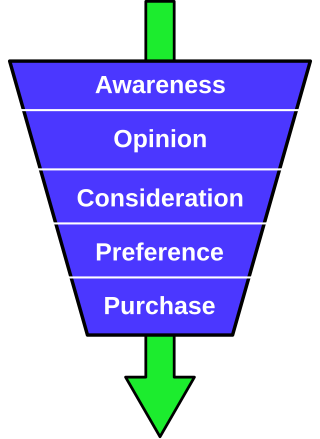
The purchase funnel, or purchasing funnel, is a consumer-focused marketing model that illustrates the theoretical customer journey toward the purchase of a good or service.
Email remarketing refers to the email systems used by merchants to follow up with website visitors who do not make a desired purchase action. It is a development of email marketing that aims to re-attract website viewers or customers. In other words, the whole idea of email remarketing is attracting customers or users back for purchase, growing repeated customers.
Marketing automation refers to software platforms and technologies designed for marketing departments and organizations to more effectively market on multiple channels online and automate repetitive tasks.
Lead validation is the process by which sales leads generated by internet marketing campaigns are separated from other types of conversions. Lead validation is crucial for effective internet marketing management; without it, companies can neither accurately evaluate the results of, nor efficiently improve, their SEO, PPC, display advertising, email, content marketing and social media campaigns.
References
- ↑ Crystal Reports 10: The Complete Reference. McGraw-Hill Professional. 2004.
- ↑ SQL Server 2008 Books Online. Microsoft. 2008.
- ↑ "Funnel Chart". AnyChart JavaScript Chart Documentation.
- ↑ Van Leeuwen, Matthys (2009). Managing Multi-Channel Orders with OrderCore - Enabling a Customer Focus in Order Fulfillment. Lulu. p. 34. ISBN 978-0-557-03968-5.
This article needs additional citations for verification .(March 2009) |