
Sexism is prejudice or discrimination based on one's sex or gender. Sexism can affect anyone, but primarily affects women and girls. It has been linked to gender roles and stereotypes, and may include the belief that one sex or gender is intrinsically superior to another. Extreme sexism may foster sexual harassment, rape, and other forms of sexual violence. Discrimination in this context is defined as discrimination toward people based on their gender identity or their gender or sex differences. An example of this is workplace inequality. Sexism may arise from social or cultural customs and norms.
A gender gap, a relative disparity between people of different genders, is reflected in a variety of sectors in many societies. There exist differences between men and women as reflected in social, political, intellectual, cultural, scientific or economic attainments or attitudes.
Achievement gaps in the United States are observed, persistent disparities in measures of educational performance among subgroups of U.S. students, especially groups defined by socioeconomic status (SES), race/ethnicity and gender. The achievement gap can be observed through a variety of measures, including standardized test scores, grade point average, dropout rates, college enrollment, and college completion rates. The gap in achievement between lower income students and higher income students exists in all nations and it has been studied extensively in the U.S. and other countries, including the U.K. Various other gaps between groups exist around the globe as well.

The Programme for International Student Assessment (PISA) is a worldwide study by the Organisation for Economic Co-operation and Development (OECD) in member and non-member nations intended to evaluate educational systems by measuring 15-year-old school pupils' scholastic performance on mathematics, science, and reading. It was first performed in 2000 and then repeated every three years. Its aim is to provide comparable data with a view to enabling countries to improve their education policies and outcomes. It measures problem solving and cognition.

The National Assessment of Educational Progress (NAEP) is the largest continuing and nationally representative assessment of what U.S. students know and can do in various subjects. NAEP is a congressionally mandated project administered by the National Center for Education Statistics (NCES), within the Institute of Education Sciences (IES) of the U.S. Department of Education. The first national administration of NAEP occurred in 1969. The National Assessment Governing Board (NAGB) is an independent, bipartisan board that sets policy for NAEP and is responsible for developing the framework and test specifications.The National Assessment Governing Board, whose members are appointed by the U.S. Secretary of Education, includes governors, state legislators, local and state school officials, educators, business representatives, and members of the general public. Congress created the 26-member Governing Board in 1988.
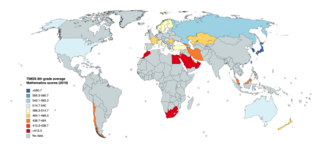
The IEA's Trends in International Mathematics and Science Study (TIMSS) is a series of international assessments of the mathematics and science knowledge of students around the world. The participating students come from a diverse set of educational systems in terms of economic development, geographical location, and population size. In each of the participating educational systems, a minimum of 4,000 to 5,000 students is evaluated. Contextual data about the conditions in which participating students learn mathematics and science are collected from the students and their teachers, their principals, and their parents via questionnaires.
Mathematical anxiety, also known as math phobia, is a feeling of tension and anxiety that interferes with the manipulation of numbers and the solving of mathematical problems in daily life and academic situations. This is, arguably, distinct from statistics anxiety where the negative state is the result of encountering statistics at any level but related to but distinct from mathematical anxiety.

The variability hypothesis, also known as the greater male variability hypothesis, is the hypothesis that males generally display greater variability in traits than females do.
Gender inequality is the social phenomenon in which people are not treated equally on the basis of gender. This inequality can be caused by gender discrimination or sexism. The treatment may arise from distinctions regarding biology, psychology, or cultural norms prevalent in the society. Some of these distinctions are empirically grounded, while others appear to be social constructs. While current policies around the world cause inequality among individuals, it is women who are most affected. Gender inequality weakens women in many areas such as health, education, and business life. Studies show the different experiences of genders across many domains including education, life expectancy, personality, interests, family life, careers, and political affiliation. Gender inequality is experienced differently across different cultures and also affects non-binary people.

Sex differences in education are a type of sex discrimination in the education system affecting both men and women during and after their educational experiences. Men are more likely to be literate on a global average, although higher literacy scores for women are prevalent in many countries. Women are more likely to achieve a tertiary education degree compared to men of the same age. Men tended to receive more education than women in the past, but the gender gap in education has reversed in recent decades in most Western countries and many non-Western countries.

Many scholars and policymakers have noted that the fields of science, technology, engineering, and mathematics (STEM) have remained predominantly male with historically low participation among women since the origins of these fields in the 18th century during the Age of Enlightenment.

Women in Finland enjoy a "high degree of equality" and "traditional courtesy" among men. In 1906, the women of Finland became the first women in Europe to be granted the right to vote. There are many women in Finland who hold prominent positions in Finnish society, in the academics, in the field of business, and in the government of Finland. An example of powerful women in Finnish politics is Tarja Halonen, who became the first female president of the country. In religion, where most of the Finnish people are members of the Evangelical Lutheran Church of Finland, women can be ordained as priests. In terms of finance, Finnish women have been described as "usually independent financially". The Telegraph wrote in 2006:
Finnish women are much more outgoing and approachable than the men and often command three or four languages. Their position in society and business is well-respected and superior to that of women in most other cultures.
Sex differences in human intelligence have long been a topic of debate among researchers and scholars. It is now recognized that there are no significant sex differences in general intelligence, though particular subtypes of intelligence vary somewhat between sexes.
The Programme for International Student Assessment has had several runs before the most recent one in 2012. The first PISA assessment was carried out in 2000. The results of each period of assessment take about one year and a half to be analysed. First results were published in November 2001. The release of raw data and the publication of technical report and data handbook only took place in spring 2002. The triennial repeats follow a similar schedule; the process of seeing through a single PISA cycle, start-to-finish, always takes over four years. 470,000 15-year-old students representing 65 nations and territories participated in PISA 2009. An additional 50,000 students representing nine nations were tested in 2010.
Sex differences in education in the United States refers to the specific issues, such as gender-based discrimination related to coursework and use of disciplinary action, that American students of all genders encounter. Furthermore, while sex differences in education explains the prevalence of gender-based differences in education on a global scale, the American education system includes specific forms of gender discrimination dissimilar to other countries.

Female education in STEM refers to child and adult female representation in the educational fields of science, technology, engineering, and mathematics (STEM). In 2017, 33% of students in STEM fields were women.

The gender-equality paradox is the finding that various gender differences in personality and occupational choice are larger in more gender equal countries. Larger differences are found in Big Five personality traits, Dark Triad traits, self-esteem, depression, personal values, occupational and educational choices. This phenomenon is seemingly paradoxical because one would expect the differences to be reduced as countries become more gender egalitarian. Such a paradox has been discussed by numerous studies ranging from science, mathematics, reading, personality traits, basic human values and vocational interests.

Sustainable Development Goal 4 is about quality education and is among the 17 Sustainable Development Goals established by the United Nations in September 2015. The full title of SDG 4 is "Ensure inclusive and equitable quality education and promote lifelong learning opportunities for all".
Gender parity is a statistical measure used to describe ratios between men and women, or boys and girls, in a given population. Gender parity may refer to the proportionate representation of men and women in a given group, also referred to as sex ratio, or it may mean the ratio between any quantifiable indicator among men against the same indicator among women.
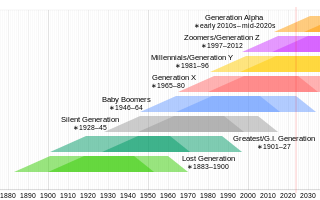
Generation Z, colloquially also known as zoomers, is the demographic cohort succeeding Millennials and preceding Generation Alpha. Researchers and popular media use the mid-to-late 1990s as starting birth years and the early 2010s as ending birth years. This article focuses specifically on the education of Generation Z.