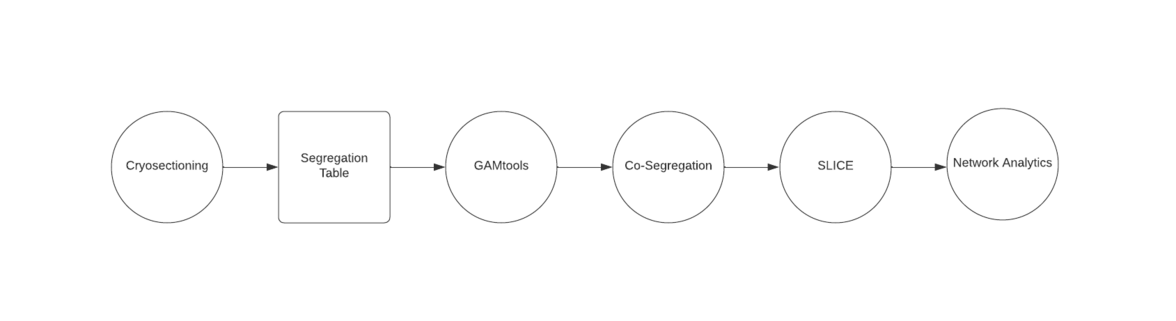
In molecular biology, genome architecture mapping (GAM) is a cryosectioning method to map colocalized DNA regions in a ligation independent manner. [1] [2] It overcomes some limitations of Chromosome conformation capture (3C), as these methods have a reliance on digestion and ligation to capture interacting DNA segments. [3] GAM is the first genome-wide method for capturing three-dimensional proximities between any number of genomic loci without ligation. [1]
Contents
- Cryosection and laser microdissection
- Data analysis - bioinformatic tools
- GAMtools
- Data analysis methods
- Overview
- SLICE
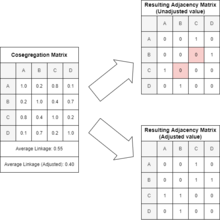
- Co-segregation and normalized linkage
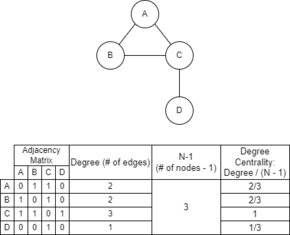
- Graph analysis approach
- Advantages
- References
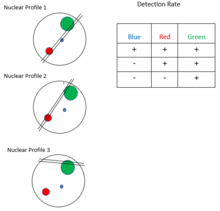
The sections that are found using the cryosectioning method mentioned above are referred to as nuclear profiles. The information that they provide relates to their coverage across a genome. A large set of values can be produced that represents the strength of nuclear profiles’ presence within a genome. Based on how large or small the coverage across a genome is, judgements can be made involving chromatin interactions, nuclear profile location within the nucleus being cryosectioned, and chromatin compaction levels. [4]
To be able to visualize this information, certain methods can be implemented using the raw data given by a table that shows whether or not nuclear profiles are detected in a genomic window, the genomic windows being represented within a certain chromosome. With a 1 representing a detection within a window and a 0 representing no detection, subsets of data can be obtained and interpreted by creating graphs, charts, heatmaps, and other visualization methods that allow these subsets to be seen in ways other than binary detection methods. By using a more graphic approach to interpreting the data obtained with cryosectioning, it is possible to see interactions that would have otherwise not been seen before.
Some examples of how these visuals can be interpreted include bar graphs that show the radial position and chromatin compaction levels of nuclear profiles, they can be split into categories to give a generalization of how often nuclear profiles are detected within a genomic window. A radar chart is a circular graph that represents the percentages of occurrence within a number of variables. In the sense of genomic information, radar charts can be used to show how genomic windows are represented within “features” of the genome that are part of certain regions that make it up. These charts can be made to compare groups of nuclear profiles with each other and their differences in how they occur within these features is shown graphically. Heatmaps are another form of visual representation where individual values in a table are shown by cells that take on different colors based on their value. This allows for trends to be seen within a table by the display of groups of similar colors or the lack of.
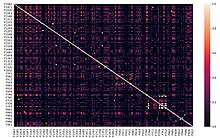
The heatmap to the right represents the relationship between nuclear profiles based on a calculated Jaccard Index where the values ranging from 0-1 are the degree of similarity between two nuclear profiles. Showing this similarity can help to display where certain groups of nuclear profiles are more common within a genome. In this heatmap the diagonal white line of cells is expected because these cells indicate where nuclear profiles intersect themselves and are therefore the most similar as possible to each other, which gives them a value of 1. In addition to the white diagonal line of cells, a cluster of other lightly colored cells can be observed in the bottom right of the heatmap. This grouping of nuclear profiles display high similarity using the Jaccard Index. This means that the nuclear profiles are present in a greater number of genomic windows than others.

The bar graph to the right represents the percentage of nuclear profiles that belong to a category of radial position (with 5 being strongly equatorial and 1 being strongly apical). The cluster of nuclear profiles was calculated based on their similarity to each other using a k-means clustering method. To begin the process, three nuclear profiles were chosen at random as the ‘centers’ of the cluster. After the centers were chosen at random, every other nuclear profile is assigned to a cluster based on its distance from each center using a calculated distance value. New centers were then chosen to better represent the cluster. This process was repeated until the centers at the start matched the centers at the end. When the cluster centers have not changed, it could be interpreted that this means proper clusters have been chosen. Within each of these clusters the nuclear profiles are then given a value from 1 to 5 based on their radial position and this data is fed into a bar graph to give a visualization.
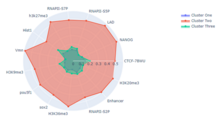
This radar chart to the right shows 3 clusters of nuclear profiles’ percentage of occurrence within certain features of the mouse genome. Each cluster of nuclear profiles was calculated using the k-means clustering technique described above, relating to the bar graph showing radial positions of nuclear profiles. Comparisons can be made between the clusters and how they show up more or less in certain features in contrast to each other. To calculate a cluster's presence within a certain feature, it is determined if a nuclear profile is present within a window that is detected within a feature. The percentage of how often nuclear profiles within a cluster occur within the same windows that are detected within a feature are then displayed by the radar chart.