Related Research Articles
In computing, a compiler is a computer program that translates computer code written in one programming language into another language. The name "compiler" is primarily used for programs that translate source code from a high-level programming language to a low-level programming language to create an executable program.
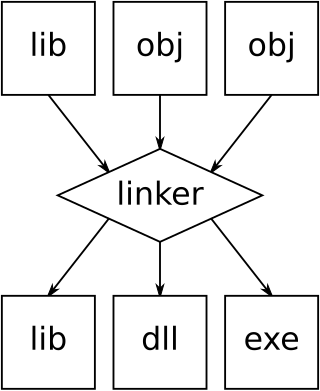
In computing, a linker or link editor is a computer system program that takes one or more object files and combines them into a single executable file, library file, or another "object" file.

The Netwide Assembler (NASM) is an assembler and disassembler for the Intel x86 architecture. It can be used to write 16-bit, 32-bit (IA-32) and 64-bit (x86-64) programs. It is considered one of the most popular assemblers for Linux and x86 chips.
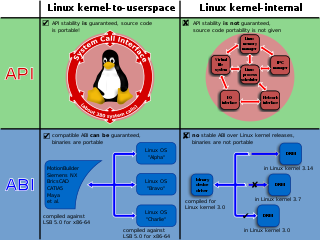
In computing, a system call is the programmatic way in which a computer program requests a service from the operating system on which it is executed. This may include hardware-related services, creation and execution of new processes, and communication with integral kernel services such as process scheduling. System calls provide an essential interface between a process and the operating system.

The GNU Autotools, also known as the GNU Build System, is a suite of programming tools designed to assist in making source code packages portable to many Unix-like systems.
In computing, just-in-time (JIT) compilation is compilation during execution of a program rather than before execution. This may consist of source code translation but is more commonly bytecode translation to machine code, which is then executed directly. A system implementing a JIT compiler typically continuously analyses the code being executed and identifies parts of the code where the speedup gained from compilation or recompilation would outweigh the overhead of compiling that code.
OpenMP is an application programming interface (API) that supports multi-platform shared-memory multiprocessing programming in C, C++, and Fortran, on many platforms, instruction-set architectures and operating systems, including Solaris, AIX, FreeBSD, HP-UX, Linux, macOS, and Windows. It consists of a set of compiler directives, library routines, and environment variables that influence run-time behavior.
Valgrind is a programming tool for memory debugging, memory leak detection, and profiling.
In computing, POSIX Threads, commonly known as pthreads, is an execution model that exists independently from a programming language, as well as a parallel execution model. It allows a program to control multiple different flows of work that overlap in time. Each flow of work is referred to as a thread, and creation and control over these flows is achieved by making calls to the POSIX Threads API. POSIX Threads is an API defined by the Institute of Electrical and Electronics Engineers (IEEE) standard POSIX.1c, Threads extensions .
SIGPLAN is the Association for Computing Machinery's Special Interest Group on programming languages.
In software engineering, profiling is a form of dynamic program analysis that measures, for example, the space (memory) or time complexity of a program, the usage of particular instructions, or the frequency and duration of function calls. Most commonly, profiling information serves to aid program optimization, and more specifically, performance engineering.

Binary Modular Dataflow Machine (BMDFM) is a software package that enables running an application in parallel on shared memory symmetric multiprocessing (SMP) computers using the multiple processors to speed up the execution of single applications. BMDFM automatically identifies and exploits parallelism due to the static and mainly dynamic scheduling of the dataflow instruction sequences derived from the formerly sequential program.

A call graph is a control-flow graph, which represents calling relationships between subroutines in a computer program. Each node represents a procedure and each edge (f, g) indicates that procedure f calls procedure g. Thus, a cycle in the graph indicates recursive procedure calls.
Dynamic program analysis is analysis of computer software that involves executing the program in question. Dynamic program analysis includes familiar techniques from software engineering such as unit testing, debugging, and measuring code coverage, but also includes lesser-known techniques like program slicing and invariant inference. Dynamic program analysis is widely applied in security in the form of runtime memory error detection, fuzzing, dynamic symbolic execution, and taint tracking.
Thread Level Speculation (TLS), also known as Speculative Multi-threading, or Speculative Parallelization, is a technique to speculatively execute a section of computer code that is anticipated to be executed later in parallel with the normal execution on a separate independent thread. Such a speculative thread may need to make assumptions about the values of input variables. If these prove to be invalid, then the portions of the speculative thread that rely on these input variables will need to be discarded and squashed. If the assumptions are correct the program can complete in a shorter time provided the thread was able to be scheduled efficiently.
A computer program may sleep, which places it into an inactive state for a period of time. Eventually the expiration of an interval timer, or the receipt of a signal or interrupt causes the program to resume execution.
Incremental computing, also known as incremental computation, is a software feature which, whenever a piece of data changes, attempts to save time by only recomputing those outputs which depend on the changed data. When incremental computing is successful, it can be significantly faster than computing new outputs naively. For example, a spreadsheet software package might use incremental computation in its recalculation feature, to update only those cells containing formulas which depend on the changed cells.
ProbeVue is IBM's implementation of a lightweight dynamic tracing environment introduced in AIX version 6.1. ProbeVue provides the ability to probe running processes in order to provide statistical analysis as well as retrieve data from the probed process. The dynamic nature of ProbeVue allows it to be used as a global system performance tool while retaining the ability to drill into very specific events on a single process or thread.
For several years parallel hardware was only available for distributed computing but recently it is becoming available for the low end computers as well. Hence it has become inevitable for software programmers to start writing parallel applications. It is quite natural for programmers to think sequentially and hence they are less acquainted with writing multi-threaded or parallel processing applications. Parallel programming requires handling various issues such as synchronization and deadlock avoidance. Programmers require added expertise for writing such applications apart from their expertise in the application domain. Hence programmers prefer to write sequential code and most of the popular programming languages support it. This allows them to concentrate more on the application. Therefore, there is a need to convert such sequential applications to parallel applications with the help of automated tools. The need is also non-trivial because large amount of legacy code written over the past few decades needs to be reused and parallelized.
Gcov is a source code coverage analysis and statement-by-statement profiling tool. Gcov generates exact counts of the number of times each statement in a program is executed and annotates source code to add instrumentation. Gcov comes as a standard utility with the GNU Compiler Collection (GCC) suite.
References
- 1 2 Susan L. Graham, Peter B. Kessler, and Marshall K. Mckusick. gprof: a Call Graph Execution Profiler // Proceedings of the SIGPLAN '82 Symposium on Compiler Construction, SIGPLAN Notices, Vol. 17, No 6, pp. 120-126; doi: 10.1145/800230.806987
- ↑ gprof --- Call Graph // Ping Huang, Reinventing Computing, MIT AI Lab
- ↑ HISTORY The gprof profiler appeared in 4.2BSD
- ↑ GNU gprof manual: "GNU gprof was written by Jay Fenlason."
- ↑ GNU's Bulletin, vol. 1 no. 5 (1988): "Gprof replacement Foundation staffer Jay Fenlason has recently completed a profiler to go with GNU C, compatible with `GPROF' from Berkeley Unix. "
- 1 2 Justin Thiel, An Overview of Software Performance Analysis Tools and Techniques: From GProf to DTrace (2006) "2.1.1 Overview of GProf"
- ↑ Gprof call graph visualization // Cookbook for scientific computing. Python cookbook. École polytechnique fédérale de Lausanne (EPFL)
- ↑ Statistical Inaccuracy of gprof Output Archived 2012-05-29 at the Wayback Machine
- 1 2 gprof Profiling Tools on BG/P Systems Archived 2013-12-21 at the Wayback Machine , "Issues in Interpreting Profile Data", Argonne Leadership Computing Facility
- ↑ "The qprof project". HP Labs, Research (archived). Retrieved 28 September 2023.
- ↑ HOWTO: using gprof with multithreaded applications // Sam Hocevar, 2004-12-13
- ↑ GNU gprof Profiler Archived 2015-12-08 at the Wayback Machine , Yu Kai Hong, Department of Mathematics at National Taiwan University; July 19, 2008
- 1 2 Low-Overhead Call Path Profiling of Unmodified,Optimized Code, ACM 1-59593-167/8/06/2005 .
- ↑ J. M. Spivey Fast, accurate call graph profiling Archived 2012-02-07 at the Wayback Machine , September 3, 2003 // Software—Practice & Experience archive, Volume 34 Issue 3, March 2004, Pages 249 - 264 Spivey, J. M. (2004). "Fast, accurate call graph profiling". Software: Practice and Experience. 34 (3): 249–264. CiteSeerX 10.1.1.62.1032 . doi:10.1002/spe.562. S2CID 17866706.
- ↑ Yossi Kreinin, How profilers lie: the cases of gprof and KCachegrind // February 2nd, 2013
- ↑ 20 Years of PLDI (1979–1999): A Selection, Kathryn S. McKinley, Editor