In calculus, an antiderivative, inverse derivative, primitive function, primitive integral or indefinite integral of a function f is a differentiable function F whose derivative is equal to the original function f. This can be stated symbolically as F' = f. The process of solving for antiderivatives is called antidifferentiation, and its opposite operation is called differentiation, which is the process of finding a derivative. Antiderivatives are often denoted by capital Roman letters such as F and G.

In probability theory and statistics, the binomial distribution with parameters n and p is the discrete probability distribution of the number of successes in a sequence of n independent experiments, each asking a yes–no question, and each with its own Boolean-valued outcome: success or failure. A single success/failure experiment is also called a Bernoulli trial or Bernoulli experiment, and a sequence of outcomes is called a Bernoulli process; for a single trial, i.e., n = 1, the binomial distribution is a Bernoulli distribution. The binomial distribution is the basis for the popular binomial test of statistical significance.

In probability theory, the expected value is a generalization of the weighted average. Informally, the expected value is the arithmetic mean of a large number of independently selected outcomes of a random variable.

In probability theory and statistics, a probability distribution is the mathematical function that gives the probabilities of occurrence of different possible outcomes for an experiment. It is a mathematical description of a random phenomenon in terms of its sample space and the probabilities of events.

A random variable is a mathematical formalization of a quantity or object which depends on random events. It is a mapping or a function from possible outcomes in a sample space to a measurable space, often to the real numbers.
In mathematics, the Lp spaces are function spaces defined using a natural generalization of the p-norm for finite-dimensional vector spaces. They are sometimes called Lebesgue spaces, named after Henri Lebesgue, although according to the Bourbaki group they were first introduced by Frigyes Riesz. Lp spaces form an important class of Banach spaces in functional analysis, and of topological vector spaces. Because of their key role in the mathematical analysis of measure and probability spaces, Lebesgue spaces are used also in the theoretical discussion of problems in physics, statistics, economics, finance, engineering, and other disciplines.

A Fourier series is a summation of harmonically related sinusoidal functions, also known as components or harmonics. The result of the summation is a periodic function whose functional form is determined by the choices of cycle length, the number of components, and their amplitudes and phase parameters. With appropriate choices, one cycle of the summation can be made to approximate an arbitrary function in that interval. The number of components is theoretically infinite, in which case the other parameters can be chosen to cause the series to converge to almost any well behaved periodic function. The components of a particular function are determined by analysis techniques described in this article. Sometimes the components are known first, and the unknown function is synthesized by a Fourier series. Such is the case of a discrete-time Fourier transform.

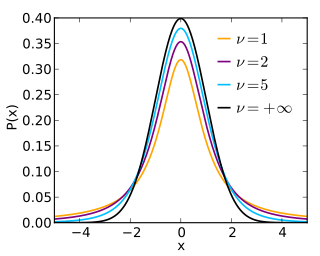
In probability and statistics, Student's t-distribution is any member of a family of continuous probability distributions that arise when estimating the mean of a normally distributed population in situations where the sample size is small and the population's standard deviation is unknown. It was developed by English statistician William Sealy Gosset under the pseudonym "Student".

In mathematics, a Riemann sum is a certain kind of approximation of an integral by a finite sum. It is named after nineteenth century German mathematician Bernhard Riemann. One very common application is approximating the area of functions or lines on a graph, but also the length of curves and other approximations.

In statistics, the Pearson correlation coefficient ― also known as Pearson's r, the Pearson product-moment correlation coefficient (PPMCC), the bivariate correlation, or colloquially simply as the correlation coefficient ― is a measure of linear correlation between two sets of data. It is the ratio between the covariance of two variables and the product of their standard deviations; thus, it is essentially a normalized measurement of the covariance, such that the result always has a value between −1 and 1. As with covariance itself, the measure can only reflect a linear correlation of variables, and ignores many other types of relationships or correlations. As a simple example, one would expect the age and height of a sample of teenagers from a high school to have a Pearson correlation coefficient significantly greater than 0, but less than 1.
In information theory, the information content, self-information, surprisal, or Shannon information is a basic quantity derived from the probability of a particular event occurring from a random variable. It can be thought of as an alternative way of expressing probability, much like odds or log-odds, but which has particular mathematical advantages in the setting of information theory.

In geometry, hyperbolic angle is a real number determined by the area of the corresponding hyperbolic sector of xy = 1 in Quadrant I of the Cartesian plane. The hyperbolic angle parametrises the unit hyperbola, which has hyperbolic functions as coordinates. In mathematics, hyperbolic angle is an invariant measure as it is preserved under hyperbolic rotation.
Renewal theory is the branch of probability theory that generalizes the Poisson process for arbitrary holding times. Instead of exponentially distributed holding times, a renewal process may have any independent and identically distributed (IID) holding times that have finite mean. A renewal-reward process additionally has a random sequence of rewards incurred at each holding time, which are IID but need not be independent of the holding times.
In statistics, a binomial proportion confidence interval is a confidence interval for the probability of success calculated from the outcome of a series of success–failure experiments. In other words, a binomial proportion confidence interval is an interval estimate of a success probability p when only the number of experiments n and the number of successes nS are known.
In mathematics, a real or complex-valued function f on d-dimensional Euclidean space satisfies a Hölder condition, or is Hölder continuous, when there are nonnegative real constants C, α > 0, such that
In arithmetic, a complex-base system is a positional numeral system whose radix is an imaginary or complex number.
In probability theory and statistics, the index of dispersion, dispersion index,coefficient of dispersion,relative variance, or variance-to-mean ratio (VMR), like the coefficient of variation, is a normalized measure of the dispersion of a probability distribution: it is a measure used to quantify whether a set of observed occurrences are clustered or dispersed compared to a standard statistical model.

In probability theory and statistics, the Poisson distribution is a discrete probability distribution that expresses the probability of a given number of events occurring in a fixed interval of time or space if these events occur with a known constant mean rate and independently of the time since the last event. It is named after French mathematician Siméon Denis Poisson. The Poisson distribution can also be used for the number of events in other specified interval types such as distance, area, or volume.

In probability theory, conditional probability is a measure of the probability of an event occurring, given that another event (by assumption, presumption, assertion or evidence) has already occurred. This particular method relies on event B occurring with some sort of relationship with another event A. In this event, the event B can be analyzed by a conditional probability with respect to A. If the event of interest is A and the event B is known or assumed to have occurred, "the conditional probability of A given B", or "the probability of A under the condition B", is usually written as P(A|B) or occasionally PB(A). This can also be understood as the fraction of probability B that intersects with A: .
In mathematics, a square-integrable function, also called a quadratically integrable function or function or square-summable function, is a real- or complex-valued measurable function for which the integral of the square of the absolute value is finite. Thus, square-integrability on the real line is defined as follows.


