High Peak | |
---|---|
County constituency for the House of Commons | |
![]() | |
![]() Boundary of High Peak in the East Midlands | |
County | Derbyshire |
Electorate | 72,178 (December 2010) [1] |
Major settlements | Buxton, Glossop, New Mills |
Current constituency | |
Created | 1885 |
Member of Parliament | Robert Largan (Conservative) |
Seats | One |
Created from | North Derbyshire |
High Peak is a parliamentary constituency [n 1] represented in the House of Commons of the UK Parliament since 2019 by Robert Largan, a Conservative. [n 2]
The constituency is in north west Derbyshire and based in the heart of the Peak District, including the towns of Buxton, Glossop and New Mills.
Since the 1966 general election, the seat has been somewhat of a bellwether, with only three exceptions: at the February and October 1974 general elections the seat was won by the Conservative Party when the Labour Party won the most seats nationally, and at the 2017 general election when the seat was won by Labour but the Conservatives won the most seats nationally.
1885–1918: The Borough of Glossop, and the Sessional Divisions of Buxton, Chapel-en-le-Frith, and Glossop.
1918–1950: The Boroughs of Buxton and Glossop, the Urban District of New Mills, the Rural Districts of Glossop Dale and Hayfield, and parts of the Rural Districts of Bakewell and Chapel-en-le-Frith.
1950–1983: The Boroughs of Buxton and Glossop, the Urban Districts of New Mills and Whaley Bridge, and the Rural District of Chapel-en-le-Frith.
1983–2010: The Borough of High Peak, and the District of West Derbyshire wards of Bradwell, Hathersage and Tideswell.
2010–present: The Borough of High Peak.
Following the 2023 Periodic Review of Westminster constituencies, which came into effect for the 2024 general election, the composition of the constituency is unchanged. [2]
The constituency covers much of northern Derbyshire and represents most of the west of the Peak District which encircles Buxton and Glossop. [3] Crowden, Tintwistle and Woodhead (formerly within the boundaries of Cheshire and in the Stalybridge and Hyde constituency) were brought into the seat in the boundary changes for the 1983 general election. The constituency boundaries became co-terminous with the local government district at the 2010 general election.
The rural Hope Valley and the town of Chapel-en-le-Frith have a Conservative majority, whereas the north western part of the constituency, in Glossop (especially the Manchester overspill estate of Gamesley), Hadfield and Tintwistle, are more Labour-inclined. The largest town of Buxton is often divided between the two main parties. Buxton itself is a spa town famed for its bottled water while Glossop has had a more industrial past. Tourism is a key industry in the constituency being in the Peak District, attracting visitors to its landscapes of peaks and reservoirs and other attractions such as the village of Castleton with its Blue John mine. The seat has considerable commuting connections by road and rail with Manchester (and the Hope Valley with Sheffield), rather than the East Midlands and Derby.
The seat was created in the Redistribution of Seats Act 1885. Since 1910, the seat has returned mostly Conservative MPs apart from during three periods. A Labour MP was elected for the first time in 1966, but was unseated at the next general election. Labour gained the seat at the 1997 general election and retained it at the following two general elections during the Blair ministry, but it was regained by the Conservatives at the 2010 general election. It was regained by Labour at the 2017 general election when Ruth George gained the seat, the first time Labour had won the High Peak seat without winning the overall general election in its history.
![]() | Graphs are unavailable due to technical issues. There is more info on Phabricator and on MediaWiki.org. |
Party | Candidate | Votes | % | ±% | |
---|---|---|---|---|---|
Green | Joanna Collins | ||||
Reform UK | Catherine Cullen | ||||
Liberal Democrats | Peter Hirst | ||||
Conservative | Robert Largan | ||||
Labour | Jon Pearce | ||||
Majority | |||||
Turnout | |||||
Registered electors | |||||
Swing | |||||
Party | Candidate | Votes | % | ±% | |
---|---|---|---|---|---|
Conservative | Robert Largan | 24,844 | 45.9 | +0.5 | |
Labour | Ruth George | 24,254 | 44.8 | −4.9 | |
Liberal Democrats | David Lomax | 2,750 | 5.1 | +0.1 | |
Brexit Party | Alan Graves | 1,177 | 2.2 | New | |
Green | Robert Hodgetts-Haley | 1,148 | 2.1 | New | |
Majority | 590 | 1.1 | N/A | ||
Turnout | 54,173 | 72.9 | −0.8 | ||
Conservative gain from Labour | Swing | +2.7 | |||
Party | Candidate | Votes | % | ±% | |
---|---|---|---|---|---|
Labour | Ruth George [19] | 26,753 | 49.7 | +14.4 | |
Conservative | Andrew Bingham [20] | 24,431 | 45.4 | +0.4 | |
Liberal Democrats | Charles Lawley [21] | 2,669 | 5.0 | +0.3 | |
Majority | 2,322 | 4.3 | N/A | ||
Turnout | 54,018 | 73.75 | +4.25 [22] | ||
Labour gain from Conservative | Swing | +7.0 | |||
Party | Candidate | Votes | % | ±% | |
---|---|---|---|---|---|
Conservative | Andrew Bingham | 22,836 | 45.0 | +4.1 | |
Labour | Caitlin Bisknell | 17,942 | 35.3 | +3.7 | |
UKIP | Ian Guiver | 5,811 | 11.4 | +8.0 | |
Liberal Democrats | Stephen Worrall | 2,389 | 4.7 | −17.1 | |
Green | Charlotte Farrell | 1,811 | 3.6 | +1.8 | |
Majority | 4,894 | 9.7 | +0.4 | ||
Turnout | 50,789 | 69.5 | −0.4 | ||
Conservative hold | Swing | +0.2 | |||
Party | Candidate | Votes | % | ±% | |
---|---|---|---|---|---|
Conservative | Andrew Bingham | 20,587 | 40.9 | +3.6 | |
Labour | Caitlin Bisknell | 15,910 | 31.6 | −9.5 | |
Liberal Democrats | Alistair Stevens | 10,993 | 21.8 | +2.4 | |
UKIP | Sylvia Hall | 1,690 | 3.4 | +1.2 | |
Green | Peter Allen | 922 | 1.8 | New | |
Independent | Lance Dowson | 161 | 0.3 | New | |
Independent | Tony Alves | 74 | 0.1 | New | |
Majority | 4,677 | 9.3 | N/A | ||
Turnout | 50,337 | 69.9 | +3.8 | ||
Conservative gain from Labour | Swing | +6.55 | |||
Party | Candidate | Votes | % | ±% | |
---|---|---|---|---|---|
Labour | Tom Levitt | 19,809 | 39.6 | −7.0 | |
Conservative | Andrew Bingham | 19,074 | 38.2 | +0.9 | |
Liberal Democrats | Marc Godwin | 10,000 | 20.0 | +3.9 | |
UKIP | Michael Schwarz | 1,106 | 2.2 | New | |
Majority | 735 | 1.4 | -7.9 | ||
Turnout | 49,989 | 66.4 | +1.2 | ||
Labour hold | Swing | -3.95 | |||
Party | Candidate | Votes | % | ±% | |
---|---|---|---|---|---|
Labour | Tom Levitt | 22,430 | 46.6 | −4.2 | |
Conservative | Simon Chapman | 17,941 | 37.3 | +1.8 | |
Liberal Democrats | Peter Ashenden | 7,743 | 16.1 | +4.9 | |
Majority | 4,489 | 9.3 | -6.0 | ||
Turnout | 48,114 | 65.2 | −13.7 | ||
Labour hold | Swing | −3.0 | |||
Party | Candidate | Votes | % | ±% | |
---|---|---|---|---|---|
Labour | Tom Levitt | 29,052 | 50.8 | +12.9 | |
Conservative | Charles Hendry | 20,261 | 35.5 | -10.5 | |
Liberal Democrats | Sue Barber | 6,420 | 11.2 | -3.6 | |
Referendum | Colin Hanson-Orr | 1,420 | 2.5 | New | |
Majority | 8,791 | 15.3 | N/A | ||
Turnout | 57,153 | 78.9 | -5.7 | ||
Labour gain from Conservative | Swing | ||||
Party | Candidate | Votes | % | ±% | |
---|---|---|---|---|---|
Conservative | Charles Hendry | 27,538 | 46.0 | +0.3 | |
Labour | Tom Levitt | 22,719 | 37.9 | +9.1 | |
Liberal Democrats | Simon P. Molloy | 8,861 | 14.8 | −10.8 | |
Green | Roger Floyd | 794 | 1.3 | New | |
Majority | 4,819 | 8.1 | −8.8 | ||
Turnout | 59,912 | 84.6 | +4.1 | ||
Conservative hold | Swing | −4.4 | |||
Party | Candidate | Votes | % | ±% | |
---|---|---|---|---|---|
Conservative | Christopher Hawkins | 25,715 | 45.7 | −0.7 | |
Labour | Jean McCrindle | 16,199 | 28.8 | +2.8 | |
SDP | John Oldham | 14,389 | 25.6 | −2.0 | |
Majority | 9,516 | 16.9 | −1.9 | ||
Turnout | 56,303 | 80.5 | +2.0 | ||
Conservative hold | Swing | ||||
Party | Candidate | Votes | % | ±% | |
---|---|---|---|---|---|
Conservative | Christopher Hawkins | 24,534 | 46.4 | −0.1 | |
SDP | David Marquand | 14,594 | 27.6 | +10.7 | |
Labour | David Wilcox | 13,755 | 26.0 | −10.7 | |
Majority | 9,940 | 18.8 | +9.0 | ||
Turnout | 52,883 | 78.5 | −3.3 | ||
Conservative hold | Swing | ||||
Party | Candidate | Votes | % | ±% | |
---|---|---|---|---|---|
Conservative | Spencer Le Marchant | 22,532 | 46.5 | +5.1 | |
Labour | David Bookbinder | 17,777 | 36.7 | -0.4 | |
Liberal | D. Brown | 8,200 | 16.9 | -4.6 | |
Majority | 4,755 | 9.8 | +5.5 | ||
Turnout | 48,509 | 81.8 | +1.3 | ||
Conservative hold | Swing | ||||
Party | Candidate | Votes | % | ±% | |
---|---|---|---|---|---|
Conservative | Spencer Le Marchant | 19,043 | 41.4 | +1.6 | |
Labour | David Bookbinder | 17,041 | 37.1 | +2.0 | |
Liberal | Christopher Walmsley | 9,875 | 21.5 | -3.6 | |
Majority | 2,002 | 4.3 | -0.4 | ||
Turnout | 45,959 | 80.5 | -4.9 | ||
Conservative hold | Swing | ||||
Party | Candidate | Votes | % | ±% | |
---|---|---|---|---|---|
Conservative | Spencer Le Marchant | 19,231 | 39.8 | -3.9 | |
Labour | Peter Jackson | 16,956 | 35.1 | -5.3 | |
Liberal | Nora Scott | 12,117 | 25.1 | +9.2 | |
Majority | 2,275 | 4.7 | +1.4 | ||
Turnout | 48,304 | 85.4 | +4.6 | ||
Conservative hold | Swing | ||||
Party | Candidate | Votes | % | ±% | |
---|---|---|---|---|---|
Conservative | Spencer Le Marchant | 19,558 | 43.7 | +4.4 | |
Labour | Peter Jackson | 18,054 | 40.4 | -0.9 | |
Liberal | Dennis Wrigley | 7,119 | 15.9 | -3.6 | |
Majority | 1,504 | 3.3 | N/A | ||
Turnout | 44,731 | 80.8 | |||
Conservative gain from Labour | Swing | ||||
Party | Candidate | Votes | % | ±% | |
---|---|---|---|---|---|
Labour | Peter Jackson | 16,938 | 41.3 | +6.4 | |
Conservative | David Walder | 16,124 | 39.3 | +1.2 | |
Liberal | Dennis Wrigley | 7,990 | 19.5 | -7.5 | |
Majority | 814 | 2.0 | N/A | ||
Turnout | 41,052 | 84.2 | -1.1 | ||
Labour gain from Conservative | Swing | ||||
Party | Candidate | Votes | % | ±% | |
---|---|---|---|---|---|
Conservative | David Walder | 15,753 | 38.1 | -7.9 | |
Labour | John Roper | 14,416 | 34.9 | +0.9 | |
Liberal | Dennis Wrigley | 11,147 | 27.0 | +7.0 | |
Majority | 1,337 | 3.2 | -8.9 | ||
Turnout | 41,316 | 85.3 | +2.6 | ||
Conservative hold | Swing | ||||
Party | Candidate | Votes | % | ±% | |
---|---|---|---|---|---|
Conservative | David Walder | 13,069 | 37.4 | -8.6 | |
Labour | Wilfred McCormack Halsall | 11,201 | 32.1 | -1.9 | |
Liberal | Dennis Wrigley | 10,674 | 30.5 | +10.5 | |
Majority | 1,868 | 5.3 | -6.7 | ||
Turnout | 34,944 | ||||
Conservative hold | Swing | ||||
Party | Candidate | Votes | % | ±% | |
---|---|---|---|---|---|
Conservative | Hugh Molson | 18,738 | 46.0 | -2.4 | |
Labour | Bernard Conlan | 13,827 | 34.0 | -0.6 | |
Liberal | Stephen R. Cawley | 8,138 | 20.0 | +3.0 | |
Majority | 4,911 | 12.0 | -1.78 | ||
Turnout | 40,703 | 82.7 | +3.2 | ||
Conservative hold | Swing | ||||
Party | Candidate | Votes | % | ±% | |
---|---|---|---|---|---|
Conservative | Hugh Molson | 19,094 | 48.4 | -0.6 | |
Labour | Neil McBride | 13,652 | 34.6 | -7.1 | |
Liberal | Stephen R. Cawley | 6,712 | 17.0 | +7.6 | |
Majority | 5,442 | 13.8 | +6.5 | ||
Turnout | 39,458 | 79.5 | -6.4 | ||
Conservative hold | Swing | ||||
Party | Candidate | Votes | % | ±% | |
---|---|---|---|---|---|
Conservative | Hugh Molson | 21,305 | 49.0 | +3.3 | |
Labour | Wilfred McCormack Halsall | 18,127 | 41.7 | +2.5 | |
Liberal | Stephen R. Cawley | 4,070 | 9.4 | -5.7 | |
Majority | 3,178 | 7.3 | +0.8 | ||
Turnout | 43,502 | 85.9 | +0.1 | ||
Conservative hold | Swing | ||||
Party | Candidate | Votes | % | ±% | |
---|---|---|---|---|---|
Conservative | Hugh Molson | 19,740 | 45.7 | +0.2 | |
Labour | Wilfred McCormack Halsall | 16,933 | 39.2 | +0.4 | |
Liberal | Tom Stuttard Rothwell | 6,539 | 15.1 | -0.6 | |
Majority | 2,807 | 6.5 | -0.2 | ||
Turnout | 43,212 | 85.8 | +8.0 | ||
Conservative hold | Swing | ||||
Party | Candidate | Votes | % | ±% | |
---|---|---|---|---|---|
Conservative | Hugh Molson | 18,113 | 45.5 | -8.4 | |
Labour | Wilfred McCormack Halsall | 15,454 | 38.8 | +11.9 | |
Liberal | Tom Stuttard Rothwell | 6,230 | 15.7 | -3.5 | |
Majority | 2,659 | 6.7 | -20.3 | ||
Turnout | 39,797 | 77.8 | +5.6 | ||
Conservative hold | Swing | ||||
At the 1939 High Peak by-election, Hugh Molson was elected unopposed.
Party | Candidate | Votes | % | ±% | |
---|---|---|---|---|---|
Conservative | Alfred Law | 19,145 | 53.9 | -20.2 | |
Labour | R. W. Wright | 9,559 | 26.9 | +1.0 | |
Liberal | Leonard Radcliffe | 6,831 | 19.2 | New | |
Majority | 9,586 | 27.00 | -21.2 | ||
Turnout | 35,535 | 72.2 | +24.0 | ||
Conservative hold | Swing | ||||
Party | Candidate | Votes | % | ±% | |
---|---|---|---|---|---|
Conservative | Alfred Law | 27,577 | 74.1 | +31.0 | |
Labour | George Bagnall | 9,640 | 25.9 | -1.9 | |
Majority | 17,937 | 48.2 | +34.2 | ||
Turnout | 37,217 | ||||
Conservative hold | Swing | ||||
Party | Candidate | Votes | % | ±% | |
---|---|---|---|---|---|
Unionist | Alfred Law | 16,406 | 43.1 | −10.2 | |
Liberal | Robert McDougall | 11,083 | 29.1 | −17.6 | |
Labour | George Bagnall | 10,567 | 27.8 | New | |
Majority | 5,323 | 14.0 | +7.4 | ||
Turnout | 38,056 | 80.9 | +4.1 | ||
Registered electors | 47,066 | ||||
Unionist hold | Swing | +3.7 | |||
Party | Candidate | Votes | % | ±% | |
---|---|---|---|---|---|
Unionist | Samuel Hill-Wood | 14,560 | 53.3 | +8.7 | |
Liberal | Robert McDougall | 12,772 | 46.7 | +12.1 | |
Majority | 1,788 | 6.6 | −3.4 | ||
Turnout | 27,332 | 76.8 | −1.4 | ||
Registered electors | 35,588 | ||||
Unionist hold | Swing | −1.7 | |||
Party | Candidate | Votes | % | ±% | |
---|---|---|---|---|---|
Unionist | Samuel Hill-Wood | 12,162 | 44.6 | −7.9 | |
Liberal | Robert McDougall | 9,432 | 34.6 | +14.2 | |
Labour | Frank Anderson | 5,684 | 20.8 | −6.3 | |
Majority | 2,730 | 10.0 | −15.4 | ||
Turnout | 27,278 | 78.2 | −4.7 | ||
Registered electors | 34,896 | ||||
Unionist hold | Swing | −11.1 | |||
Party | Candidate | Votes | % | ±% | |
---|---|---|---|---|---|
Unionist | Samuel Hill-Wood | 14,892 | 52.5 | −6.3 | |
Labour | Frank Anderson | 7,698 | 27.1 | New | |
Liberal | Anna Barlow | 5,802 | 20.4 | −20.8 | |
Majority | 7,194 | 25.4 | +7.8 | ||
Turnout | 28,392 | 82.9 | +20.6 | ||
Registered electors | 34,242 | ||||
Unionist hold | Swing | +7.3 | |||
Party | Candidate | Votes | % | ±% | |
---|---|---|---|---|---|
Conservative | William Sidebottom | 4,199 | 50.1 | ||
Liberal | John Frederick Cheetham | 4,190 | 49.9 | ||
Majority | 9 | 0.2 | |||
Turnout | 8,389 | 89.1 | |||
Registered electors | 9,414 | ||||
Conservative win (new seat) |
Party | Candidate | Votes | % | ±% | |
---|---|---|---|---|---|
Conservative | William Sidebottom | 4,162 | 51.0 | +0.9 | |
Liberal | Herbert Rhodes [52] | 4,001 | 49.0 | −0.9 | |
Majority | 161 | 2.0 | +1.8 | ||
Turnout | 8,163 | 86.7 | −2.4 | ||
Registered electors | 9,414 | ||||
Conservative hold | Swing | +0.9 | |||
Party | Candidate | Votes | % | ±% | |
---|---|---|---|---|---|
Conservative | William Sidebottom | 4,609 | 52.1 | +1.1 | |
Liberal | John Frederick Cheetham | 4,243 | 47.9 | −1.1 | |
Majority | 366 | 4.2 | +2.2 | ||
Turnout | 8,862 | 79.6 | −7.1 | ||
Registered electors | 11,122 | ||||
Conservative hold | Swing | +1.1 | |||
Party | Candidate | Votes | % | ±% | |
---|---|---|---|---|---|
Conservative | William Sidebottom | 4,671 | 52.9 | +0.8 | |
Liberal | Arthur Gibb Symonds | 4,164 | 47.1 | −0.8 | |
Majority | 507 | 5.8 | +1.6 | ||
Turnout | 8,835 | 85.0 | +5.4 | ||
Registered electors | 10,397 | ||||
Conservative hold | Swing | +0.8 | |||
Party | Candidate | Votes | % | ±% | |
---|---|---|---|---|---|
Liberal | Oswald Partington | 4,591 | 50.9 | +3.8 | |
Conservative | Samuel Roberts | 4,432 | 49.1 | −3.8 | |
Majority | 159 | 1.8 | N/A | ||
Turnout | 9,023 | 86.6 | +1.6 | ||
Registered electors | 10,420 | ||||
Liberal gain from Conservative | Swing | +3.8 | |||
Party | Candidate | Votes | % | ±% | |
---|---|---|---|---|---|
Liberal | Oswald Partington | 5,450 | 53.9 | +3.0 | |
Conservative | Albert Profumo | 4,662 | 46.1 | −3.0 | |
Majority | 788 | 7.8 | +6.0 | ||
Turnout | 10,112 | 90.7 | +4.1 | ||
Registered electors | 11,154 | ||||
Liberal hold | Swing | +3.0 | |||
Party | Candidate | Votes | % | ±% | |
---|---|---|---|---|---|
Liberal | Oswald Partington | 5,619 | 51.6 | −2.3 | |
Conservative | Albert Profumo | 5,272 | 48.4 | +2.3 | |
Majority | 347 | 3.2 | −4.6 | ||
Turnout | 10,891 | 91.1 | +0.4 | ||
Registered electors | 11,951 | ||||
Liberal hold | Swing | −2.3 | |||
Party | Candidate | Votes | % | ±% | |
---|---|---|---|---|---|
Liberal | Oswald Partington | 5,912 | 50.5 | -1.1 | |
Conservative | Samuel Hill-Wood | 5,806 | 49.5 | +1.1 | |
Majority | 106 | 1.0 | -2.2 | ||
Turnout | 11,718 | 94.4 | +3.3 | ||
Liberal hold | Swing | -1.1 | |||
Party | Candidate | Votes | % | ±% | |
---|---|---|---|---|---|
Conservative | Samuel Hill-Wood | 5,813 | 50.8 | +0.3 | |
Liberal | Oswald Partington | 5,629 | 49.2 | -0.3 | |
Majority | 184 | 1.6 | N/A | ||
Turnout | 11,442 | 92.2 | -2.2 | ||
Conservative gain from Liberal | Swing | +0.3 | |||
General Election 1914–15:
Another General Election was required to take place before the end of 1915. The political parties had been making preparations for an election to take place and by July 1914, the following candidates had been selected;
Party | Candidate | Votes | % | ±% | |
---|---|---|---|---|---|
C | Unionist | Samuel Hill-Wood | 12,118 | 58.8 | +8.0 |
Liberal | Clifford Brookes | 8,504 | 41.2 | −8.0 | |
Majority | 3,614 | 17.6 | +16.0 | ||
Turnout | 20,622 | 62.3 | −29.9 | ||
Registered electors | 33,075 | ||||
Unionist hold | Swing | +8.0 | |||
Cindicates candidate endorsed by the coalition government. |
Sheffield Hallam is a constituency represented in the House of Commons of the UK Parliament since 2019 by Olivia Blake of the Labour Party.
Rother Valley is a constituency represented in the House of Commons of the UK Parliament by Alexander Stafford, a member of the Conservative Party.
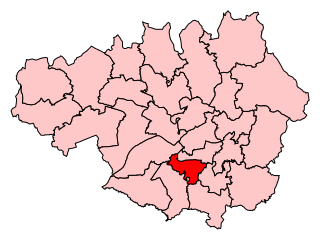
Cheadle is a borough constituency represented in the House of Commons of the Parliament of the United Kingdom.
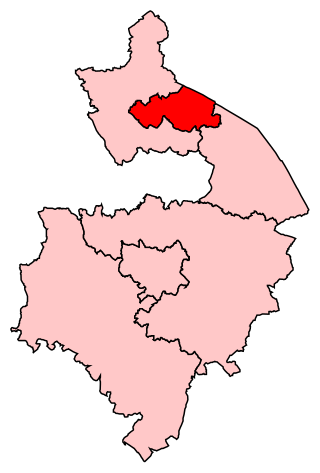
Rutland and Melton was a county constituency spanning Leicestershire and Rutland, represented in the House of Commons of the Parliament of the United Kingdom from 1983 to 2024. It elected one Member of Parliament (MP) by the first-past-the-post system of election. For its entire existence, the seat elected members of the Conservative Party.
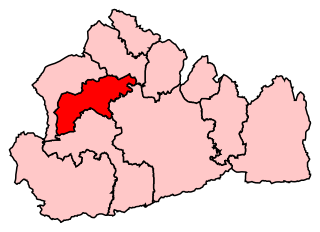
Amber Valley is a constituency in Derbyshire, represented in the House of Commons of the UK Parliament.
Birmingham Edgbaston is a constituency, represented in the House of Commons of the UK Parliament since 2017 by Preet Gill, a Labour Co-op MP.
Bury North is a borough constituency in Greater Manchester, created in 1983 and represented in the House of Commons of the UK Parliament. With a Conservative majority of 105 votes, it is the most marginal constituency for a sitting MP in the United Kingdom as of the 2019 general election.
Manchester Withington is a constituency represented in the House of Commons of the UK Parliament since 2015 by Jeff Smith of Labour. Of the 30 seats with the highest percentage of winning majority in 2017, the seat ranks 25th with a 55.7% margin, and is the only one of the twenty nine of these seats won by the Labour Party in which the second-placed candidate was a Liberal Democrat, rather than Conservative. This is despite being a Conservative seat right up to 1987, then becoming relatively safely Labour, then Liberal Democrat from 2005 to 2015 before they lost on a large swing in 2015, after which Smith substantially increased his majority.
Stalybridge and Hyde is a constituency in Greater Manchester represented in the House of Commons of the UK Parliament since 2010 by Jonathan Reynolds, who has served as Shadow Secretary of State for Business and Trade since 2021 as a member of Labour Co-op.
Bootle is a constituency which has been represented in the House of Commons of the UK Parliament, since 2015 by Peter Dowd of the Labour Party.
Bolsover is a constituency in Derbyshire, represented in the House of Commons of the UK Parliament by Mark Fletcher, a member of the Conservative Party. The constituency was created in 1950, and is centred on the town of Bolsover.
North Durham is a constituency represented in the House of Commons of the UK Parliament since 2001 by Kevan Jones of the Labour Party.
Dewsbury is a constituency created in 1868. This seat is represented in the House of Commons of the United Kingdom Parliament since 2019 by Mark Eastwood of the Conservative Party.
North East Derbyshire is a constituency created in 1885 represented in the House of Commons of the UK Parliament since 2017 by Lee Rowley of the Conservative Party. This was the first time a Conservative candidate had been elected since 1935.
Erewash is a constituency in Derbyshire represented in the House of Commons of the UK Parliament since 2015 by Maggie Throup, a Conservative.
Nuneaton is a constituency represented in the House of Commons of the UK Parliament since 2010 by Marcus Jones, a Conservative. Since 1997, the seat has been seen as an important national bellwether.
Brentwood and Ongar is a constituency in Essex represented in the House of Commons of the UK Parliament since 2017 by Alex Burghart, a Conservative, serving since October 2022 as Parliamentary Secretary for the Cabinet Office.
Putney is a constituency in Greater London created in 1918 and represented in the House of Commons of the UK Parliament since 2019 by Fleur Anderson of the Labour Party. Putney was the sole Labour gain in the 2019 general election, amid the worst election results for the party since 1935.
Woking is a constituency represented in the House of Commons of the UK Parliament since 2010 by Jonathan Lord, a Conservative. Since it was first created for the 1950 general election, it has only ever returned Conservative Party candidates.
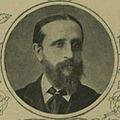
Andrew Russell Bingham is a British Conservative Party politician and former Member of Parliament (MP). He was first elected as the MP for High Peak in Derbyshire at the 2010 general election, gaining the seat from Labour. Bingham was appointed the Parliamentary Private Secretary to Minister of State for the Armed Forces Mark Francois MP in July 2014. He lost his seat to the Labour candidate, Ruth George, at the 2017 general election.