History of surface weather analysis

Last updated

The history of surface weather analysis concerns the timetable of developments related to surface weather analysis. Initially a tool of study for the behavior of storms, surface weather analyses became a work in progress to explain current weather and as an aid for short term weather forecasting. Initial efforts to create surface weather analyses began in the mid-19th century by using surface weather observations to analyze isobars, isotherms, and display temperature and cloud cover. By the mid-20th century, much more information was being placed upon the station models plotted on weather maps and surface fronts, per the Norwegian cyclone model, were being analyzed worldwide. Eventually, observation plotting went from a manual exercise to an automated task for computers and plotters. Surface analysis remains a manual and partially subjective exercise, whether it be via hand and paper, or via a workstation.

Contents

Mid-nineteenth century

The use of weather charts in a modern sense began in the middle portion of the 19th century. Weather map pioneers include William Charles Redfield, William Reid, Elias Loomis, [1] and Sir Francis Galton, who created the first weather maps in order to devise a theory on storm systems. [2] The invention of the telegraph in 1837 made it possible to gather weather information from multiple distant locations quickly enough to preserve its value for real-time applications. [3] The Smithsonian Institution developed its network of observers over much of the central and eastern United States between the 1840s and 1860s once Joseph Henry took the helm. [4] Beginning in 1849, the Smithsonian started producing surface analyses on a daily basis using the 150 stations in their network. [5] The U.S. Army Signal Corps inherited this network between 1870 and 1874 by an act of Congress, and expanded it to the west coast soon afterwards. Three times daily, all stations would telegraph in their observations to the central office which would then plot the information on a map upon which isobars, or lines of equal pressure, would be drawn which would identify centers of high and low pressure, as well as squall lines. [6] At first, all the data on the map was not taken at exactly the same time in the early days of these analyses because of a lack of time standardization. The first attempts at time standardization took hold in the Great Britain by 1855. However, in the United States, standard time did not come to pass until 1883, when time zones started to come into use across America for railroad use. The entire United States did not finally come under the influence of time zones until 1905, when Detroit finally established standard time. [7]

Surface analysis of Great Blizzard of 1888 on March 12, 1888 at 10 pm 10 PM March 12 surface analysis of Great Blizzard of 1888.png
Surface analysis of Great Blizzard of 1888 on March 12, 1888 at 10 pm

Late nineteenth century

The earliest surface analyses from the United States featured a map of the continental U.S. with indications of cloud cover and wind direction arranged on an early form of what has become a station model. A general indication of the weather for various cities around the country was also included on the bottom of the map. Within a short time, the Signal Corps added a tables showing eight-hour pressure change, 24-hour temperature change, relative humidity, and 24-hour precipitation. The Signal Office also added a general discussion of synoptic weather features and forecast, before adding isobars and isotherms onto the maps. By the end of 1872, the maps had established the format it would use until the introduction of frontal analysis. [8] By the 20th century, most of the weather-related functions under the U. S. Signal Corps branched off into a new civilian agency known as the U. S. Weather Bureau, the forerunner of today's National Weather Service.

Internationally, other countries followed the lead of the United States, in regards to taking simultaneous weather observations, starting in 1873. [9] Other countries then began preparing surface analyses. In Australia, the first weather map showed up in print media in 1877. [10] Japan's Tokyo Meteorological Observatory, the forerunner of the Japan Meteorological Agency, began constructing surface weather maps in 1883. [11]

The London Times published the first weather map on April 1, 1875. [12] In the United States, the 1876 Centennial Exposition in Philadelphia, Pennsylvania demonstrated that daily weather map transmission via telegraph could be accomplished. The New York Daily Graphic published weather maps from mid-1879 through the summer of 1882. By 1894, there were four daily newspapers publishing weather maps in Boston, New Orleans, Cincinnati, and San Francisco. [13]

Twentieth century

Different air masses tend to be separated by frontal boundaries Airmassesorigin.png
Different air masses tend to be separated by frontal boundaries

The use of frontal zones on weather maps did not appear until the introduction of the Norwegian cyclone model in the late 1910s, despite Loomis' earlier attempt at a similar notion in 1841. [14] Since the leading edge of air mass changes bore resemblance to the military fronts of World War I, the term "front" came into use to represent these lines. [15] An increasing amount of newspapers published weather maps early in the century across the United States, before the fad passed in 1912. While the number of newspapers carrying weather maps decreased beyond 1912, many continued publishing them until interest in flight increased interest in the maps once more in the 1930s. [16] Beginning in 1930, radiofax broadcasts of weather information and forecasts were broadcast for use by ships at sea, emanating from the United States military and the United States Weather Bureau on a cooperative basis. [17] Starting in 1935, Weather Bureau/National Weather Service weather maps were published in newspapers via the Associated Press in a slightly processed format as Wirephoto weather maps. [18]

Light tables were used to construct surface analyses into the 1990s US Navy 030209-N-2972R-079 Illustrator Draftsman designs a training slide with the assistance of a light table.jpg
Light tables were used to construct surface analyses into the 1990s

Despite the introduction of the Norwegian cyclone model just after World War I, the United States did not formally analyze fronts on surface analyses until August 1, 1941, just before the WBAN Analysis Center opened in downtown Washington, D.C. [19] [20] [21] The effort to automate map plotting began in the United States in 1969, [22] with the process complete in the 1970s. Hong Kong completed their process of automated surface plotting by 1987. [23] By 1999, computer systems and software had finally become sophisticated enough to allow for the ability to underlay on the same workstation satellite imagery, radar imagery, and model-derived fields such as atmospheric thickness and frontogenesis in combination with surface observations to make for the best possible surface analysis. In the United States, this development was achieved when Intergraph workstations were replaced by n-AWIPS workstations. [24]

Twenty-first century

A surface weather analysis for the United States on October 21, 2006. Surface analysis.gif
A surface weather analysis for the United States on October 21, 2006.

By 2001, the various surface analyses done within the National Weather Service were combined into the Unified Surface Analysis, which is issued every six hours and combines the analyses of four different centers. [25] Recent advances in both the fields of meteorology and geographic information systems have made it possible to devise finely tailored products that take us from the traditional weather map into an entirely new realm. Weather information can quickly be matched to relevant geographical detail. For instance, icing conditions can be mapped onto the road network. This will likely continue to lead to changes in the way surface analyses are created and displayed over the next several years. [26]

See also

Related Research Articles

<span class="mw-page-title-main">Surface weather analysis</span> Type of weather map

Surface weather analysis is a special type of weather map that provides a view of weather elements over a geographical area at a specified time based on information from ground-based weather stations.

<span class="mw-page-title-main">Weather forecasting</span> Science and technology application

Weather forecasting is the application of science and technology to predict the conditions of the atmosphere for a given location and time. People have attempted to predict the weather informally for millennia and formally since the 19th century.

<span class="mw-page-title-main">National Hurricane Center</span> Division of the United States National Weather Service

The National Hurricane Center (NHC) is the division of the United States' NOAA/National Weather Service responsible for tracking and predicting tropical weather systems between the Prime Meridian and the 140th meridian west poleward to the 30th parallel north in the northeast Pacific Ocean and the 31st parallel north in the northern Atlantic Ocean. The agency, which is co-located with the Miami branch of the National Weather Service, is situated on the campus of Florida International University in University Park, Miami, Florida.

<span class="mw-page-title-main">National Weather Service</span> U.S. forecasting agency of the National Oceanic and Atmospheric Administration

The National Weather Service (NWS) is an agency of the United States federal government that is tasked with providing weather forecasts, warnings of hazardous weather, and other weather-related products to organizations and the public for the purposes of protection, safety, and general information. It is a part of the National Oceanic and Atmospheric Administration (NOAA) branch of the Department of Commerce, and is headquartered in Silver Spring, Maryland, within the Washington metropolitan area. The agency was known as the United States Weather Bureau from 1890 until it adopted its current name in 1970.

<span class="mw-page-title-main">Weather map</span> Table of weather elements

A weather map, also known as synoptic weather chart, displays various meteorological features across a particular area at a particular point in time and has various symbols which all have specific meanings. Such maps have been in use since the mid-19th century and are used for research and weather forecasting purposes. Maps using isotherms show temperature gradients, which can help locate weather fronts. Isotach maps, analyzing lines of equal wind speed, on a constant pressure surface of 300 or 250 hPa show where the jet stream is located. Use of constant pressure charts at the 700 and 500 hPa level can indicate tropical cyclone motion. Two-dimensional streamlines based on wind speeds at various levels show areas of convergence and divergence in the wind field, which are helpful in determining the location of features within the wind pattern. A popular type of surface weather map is the surface weather analysis, which plots isobars to depict areas of high pressure and low pressure. Cloud codes are translated into symbols and plotted on these maps along with other meteorological data that are included in synoptic reports sent by professionally trained observers.

<span class="mw-page-title-main">Synoptic scale meteorology</span> 1000-km-order method of measuring weather systems

In meteorology, the synoptic scale is a horizontal length scale of the order of 1,000 km (620 mi) or more. This corresponds to a horizontal scale typical of mid-latitude depressions. Most high- and low-pressure areas seen on weather maps are synoptic-scale systems, driven by the location of Rossby waves in their respective hemisphere. Low-pressure areas and their related frontal zones occur on the leading edge of a trough within the Rossby wave pattern, while high-pressure areas form on the back edge of the trough. Most precipitation areas occur near frontal zones. The word synoptic is derived from the Ancient Greek word συνοπτικός (sunoptikós), meaning "seen together".

<span class="mw-page-title-main">Weather Prediction Center</span> United States weather agency

The Weather Prediction Center (WPC), located in College Park, Maryland, is one of nine service centers under the umbrella of the National Centers for Environmental Prediction (NCEP), a part of the National Weather Service (NWS), which in turn is part of the National Oceanic and Atmospheric Administration (NOAA) of the U.S. Government. Until March 5, 2013 the Weather Prediction Center was known as the Hydrometeorological Prediction Center (HPC). The Weather Prediction Center serves as a center for quantitative precipitation forecasting, medium range forecasting, and the interpretation of numerical weather prediction computer models.

<span class="mw-page-title-main">Pressure system</span> Relative peak or lull in the sea level pressure distribution

A pressure system is a peak or lull in the sea level pressure distribution. The surface pressure at sea level varies minimally, with the lowest value measured 87 kilopascals (26 inHg) and the highest recorded 108.57 kilopascals (32.06 inHg). High- and low-pressure systems evolve due to interactions of temperature differentials in the atmosphere, temperature differences between the atmosphere and water within oceans and lakes, the influence of upper-level disturbances, as well as the amount of solar heating or radiationized cooling an area receives. Pressure systems cause weather to be experienced locally. Low-pressure systems are associated with clouds and precipitation that minimize temperature changes throughout the day, whereas high-pressure systems normally associate with dry weather and mostly clear skies with larger diurnal temperature changes due to greater radiation at night and greater sunshine during the day. Pressure systems are analyzed by those in the field of meteorology within surface weather maps.

<span class="mw-page-title-main">Numerical weather prediction</span> Weather prediction using mathematical models of the atmosphere and oceans

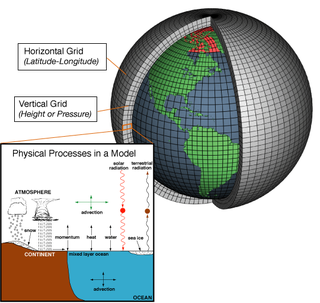
Numerical weather prediction (NWP) uses mathematical models of the atmosphere and oceans to predict the weather based on current weather conditions. Though first attempted in the 1920s, it was not until the advent of computer simulation in the 1950s that numerical weather predictions produced realistic results. A number of global and regional forecast models are run in different countries worldwide, using current weather observations relayed from radiosondes, weather satellites and other observing systems as inputs.

<span class="mw-page-title-main">Mesoscale meteorology</span> Moderately sized weather fronts

Mesoscale meteorology is the study of weather systems smaller than synoptic-scale systems but larger than microscale and storm-scale cumulus systems. Horizontal dimensions generally range from around 5 kilometres (3 mi) to several hundred kilometers. Examples of mesoscale weather systems are sea breezes, squall lines, and mesoscale convective complexes.

<span class="mw-page-title-main">Hydrometeorology</span> Branch of meteorology and hydrology

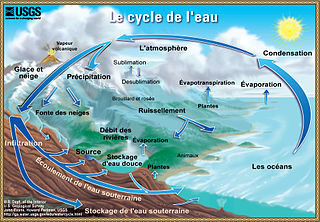
Hydrometeorology is a branch of meteorology and hydrology that studies the transfer of water and energy between the land surface and the lower atmosphere. Hydrologists often use data provided by meteorologists. As an example, a meteorologist might forecast 2–3 inches (51–76 mm) of rain in a specific area, and a hydrologist might then forecast what the specific impact of that rain would be on the local terrain.

<span class="mw-page-title-main">Servicio Meteorológico Nacional (Mexico)</span> Meteorological Service of Mexico

The Servicio Meteorológico Nacional (SMN) is Mexico's national weather organization. It collects data and issues forecasts, advisories, and warnings for the entire country.

<span class="mw-page-title-main">Tropical cyclone track forecasting</span> Predicting where a tropical cyclone is going to track over the next five days, every 6 to 12 hours

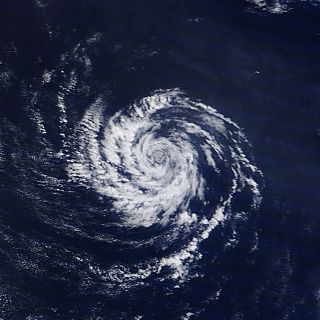
Tropical cyclone track forecasting involves predicting where a tropical cyclone is going to track over the next five days, every 6 to 12 hours. The history of tropical cyclone track forecasting has evolved from a single-station approach to a comprehensive approach which uses a variety of meteorological tools and methods to make predictions. The weather of a particular location can show signs of the approaching tropical cyclone, such as increasing swell, increasing cloudiness, falling barometric pressure, increasing tides, squalls and heavy rainfall.

<span class="mw-page-title-main">Station model</span> Type of meteorological illustration

In meteorology, station models are symbolic illustrations showing the weather occurring at a given reporting station. Meteorologists created the station model to fit a number of weather elements into a small space on weather maps. This allows map users to analyze patterns in atmospheric pressure, temperature, wind speed and direction, cloud cover, precipitation, and other parameters. The most common station plots depict surface weather observations although upper air plots at various mandatory levels are also frequently depicted.

<span class="mw-page-title-main">Quantitative precipitation forecast</span> Expected amount of melted precipitation

The quantitative precipitation forecast is the expected amount of melted precipitation accumulated over a specified time period over a specified area. A QPF will be created when precipitation amounts reaching a minimum threshold are expected during the forecast's valid period. Valid periods of precipitation forecasts are normally synoptic hours such as 00:00, 06:00, 12:00 and 18:00 GMT. Terrain is considered in QPFs by use of topography or based upon climatological precipitation patterns from observations with fine detail. Starting in the mid-to-late 1990s, QPFs were used within hydrologic forecast models to simulate impact to rivers throughout the United States. Forecast models show significant sensitivity to humidity levels within the planetary boundary layer, or in the lowest levels of the atmosphere, which decreases with height. QPF can be generated on a quantitative, forecasting amounts, or a qualitative, forecasting the probability of a specific amount, basis. Radar imagery forecasting techniques show higher skill than model forecasts within 6 to 7 hours of the time of the radar image. The forecasts can be verified through use of rain gauge measurements, weather radar estimates, or a combination of both. Various skill scores can be determined to measure the value of the rainfall forecast.

<span class="mw-page-title-main">Surface weather observation</span> Fundamental data used for weather forecasts

Surface weather observations are the fundamental data used for safety as well as climatological reasons to forecast weather and issue warnings worldwide. They can be taken manually, by a weather observer, by computer through the use of automated weather stations, or in a hybrid scheme using weather observers to augment the otherwise automated weather station. The ICAO defines the International Standard Atmosphere (ISA), which is the model of the standard variation of pressure, temperature, density, and viscosity with altitude in the Earth's atmosphere, and is used to reduce a station pressure to sea level pressure. Airport observations can be transmitted worldwide through the use of the METAR observing code. Personal weather stations taking automated observations can transmit their data to the United States mesonet through the Citizen Weather Observer Program (CWOP), the UK Met Office through their Weather Observations Website (WOW), or internationally through the Weather Underground Internet site. A thirty-year average of a location's weather observations is traditionally used to determine the station's climate. In the US a network of Cooperative Observers make a daily record of summary weather and sometimes water level information.

<span class="mw-page-title-main">Ocean Prediction Center</span> One of the National Centers for Environmental Predictions service centers

The Ocean Prediction Center (OPC), established in 1995, is one of the National Centers for Environmental Prediction's (NCEP's) original six service centers. Until 2003, the name of the organization was the Marine Prediction Center. Its origins are traced back to the sinking of the RMS Titanic in 1912. The OPC issues forecasts up to five days in advance for ocean areas north of 31° north latitude and west of 35° west longitude in the Atlantic, and across the northeast Pacific north of 30° north latitude and east of 160° east longitude. Until recently, the OPC provided forecast points for tropical cyclones north of 20° north latitude and east of the 60° west longitude to the National Hurricane Center. OPC is composed of two branches: the Ocean Forecast Branch and the Ocean Applications Branch.

A prognostic chart is a map displaying the likely weather forecast for a future time. Such charts generated by atmospheric models as output from numerical weather prediction and contain a variety of information such as temperature, wind, precipitation and weather fronts. They can also indicate derived atmospheric fields such as vorticity, stability indices, or frontogenesis. Forecast errors need to be taken into account and can be determined either via absolute error, or by considering persistence and absolute error combined.

<span class="mw-page-title-main">History of Atlantic hurricane warnings</span> Aspect of meteorological history

The history of Atlantic tropical cyclone warnings details the progress of tropical cyclone warnings in the North Atlantic Ocean. The first service was set up in the 1870s from Cuba with the work of Father Benito Viñes. After his death, hurricane warning services were assumed by the US Army Signal Corps and United States Weather Bureau over the next few decades, first based in Jamaica and Cuba before shifting to Washington, D.C. The central office in Washington, which would evolve into the National Meteorological Center and the Weather Prediction Center, assumed the responsibilities by the early 20th century. This responsibility passed to regional hurricane offices in 1935, and the concept of the Atlantic hurricane season was established to keep a vigilant lookout for tropical cyclones during certain times of the year. Hurricane advisories issued every 12 hours by the regional hurricane offices began at this time.

<span class="mw-page-title-main">Marine weather forecasting</span> Forecasts of weather conditions at sea

Marine weather forecasting is the process by which mariners and meteorological organizations attempt to forecast future weather conditions over the Earth's oceans. Mariners have had rules of thumb regarding the navigation around tropical cyclones for many years, dividing a storm into halves and sailing through the normally weaker and more navigable half of their circulation. Marine weather forecasts by various weather organizations can be traced back to the sinking of the Royal Charter in 1859 and the RMS Titanic in 1912.

References

  1. Eric R. Miller (July 1933). "American Pioneers in Meteorology" (PDF). Monthly Weather Review. 61 (7): 189–193. Bibcode:1933MWRv...61..189M. doi: 10.1175/1520-0493(1933)61<189:apim>2.0.co;2 . Retrieved 10 February 2011.
  2. Human Intelligence.Francis Galton. Retrieved on 2007-04-18.
  3. Library of Congress. The Invention of the Telegraph. Retrieved on 2009-01-01.
  4. Frank Rives Millikan. Smithsonian Institution. Joseph Henry: Father of the Weather Service. Archived 2006-10-20 at the Wayback Machine Retrieved on 2006-10-22.
  5. National Oceanic and Atmospheric Administration. Evolution of the National Weather Service. Archived 2011-09-27 at the Wayback Machine Retrieved on 2006-10-22.
  6. NOAA. General Myer: Establishing a Legacy of Weather Service. Retrieved on 2007-05-05.
  7. WebExhibits. Daylight Saving Time. Retrieved on 2007-06-24.
  8. NOAA Central Library. U.S. Daily Weather Maps Project. Retrieved on 2007-05-10.
  9. NOAA. An Expanding Presence. Retrieved on 2007-05-05.
  10. Bureau of Meteorology. Australia's First Weathermen. Retrieved on 2006-10-22.
  11. Japan Meteorological Agency. History. Archived 2010-12-25 at the Wayback Machine Retrieved on 2006-10-22.
  12. Paul Lester (2013). Visual Communication: Images with Messages. Cengage Learning. p. 213. ISBN   978-1133308645.
  13. R. De C. Ward (July 1894). "The Newspaper Weather Maps of the United States". The American Meteorological Journal. 11: 97–99.
  14. David M. Schultz. Perspectives on Fred Sanders's Research on Cold Fronts , 2003, revised, 2004, 2006, p. 5. Retrieved on 2006-07-14.
  15. Bureau of Meteorology. Air Masses and Weather Maps. Retrieved on 2006-10-22.
  16. Susan Hanson (1997). Ten Geographic Ideas that Changed the World. Rutgers University Press. p. 54. ISBN   978-0813523576.
  17. National Weather Service (2013-10-18). "National Weather Service Marine Broadcasts:Radiofax". National Oceanic and Atmospheric Administration. Retrieved 2014-01-18.
  18. Mark Monmonier (1989). Maps with the News: The Development of American Journalistic Cartography. University of Chicago Press. p. 117. ISBN   978-0226534114.
  19. United States Weather Bureau. Daily Weather Map: July 31, 1941. Retrieved on 2008-01-22.
  20. United States Weather Bureau. Daily Weather Map: August 1, 1941. Retrieved on 2008-01-22.
  21. Hydrometeorological Prediction Center. A Brief History of the Hydrometeorological Prediction Center. Retrieved on 2007-05-05.
  22. ESSA. Prospectus for an NMC Digital Facsimile Incoder Mapping Program. Retrieved on 2007-05-05.
  23. Hong Kong Observatory. The Hong Kong Observatory Computer System and Its Applications. Archived 2006-12-31 at the Wayback Machine Retrieved on 2007-05-05.
  24. Hydrometeorological Prediction Center. Hydrometeorological Prediction Center 1999 Accomplishment Report. Retrieved on 2007-05-05.
  25. David M. Roth. Hydrometeorological Prediction Center. Unified Surface Analysis Manual. Retrieved on 2006-10-22.
  26. Saseendran S. A., Harenduprakash L., Rathore L. S. and Singh S. V. A GIS application for weather analysis and forecasting. Retrieved on 2007-05-05.