According to the data given by the United Nations Office on Drugs and Crime, worldwide, 79% of homicide victims are men, and in 193 of the 202 listed countries or regions, men were more likely to be killed than women. [1] In two, the ratio was 50:50 (Switzerland and British Virgin Islands), and in the remaining seven – Tonga, Iceland, Japan, New Zealand, South Korea, Latvia, and Hong Kong – women were slightly more likely to be victims of homicides compared to males. [2] A 2000 global study on homicide by the United Nations Office on Drugs and Crime found that men account "for an average of 95 per cent of all persons convicted of homicide in 53 countries" [1] and 79% of the victims (see the chart below). The highest female homicide rate per 100,000 inhabitants was in Honduras and highest male homicide rate per 100,000 inhabitants was in Lesotho.
Location | Total | Male | Female | Year | |||||
---|---|---|---|---|---|---|---|---|---|
Victims | Rate | % of total | Victims | Rate | % of total | Victims | Rate | ||
Afghanistan | 1,948 | 6.5 | 87.0 | 1,695 | 5.7 | 13.0 | 253 | 0.8 | 2010 |
Albania | 157 | 5.0 | 83.4 | 131 | 4.2 | 16.6 | 26 | 0.8 | 2009 |
Algeria | 280 | 0.7 | 84.0 | 235 | 0.6 | 16.0 | 45 | 0.1 | 2012 |
Angola | 2,079 | 10.0 | 81.2 | 1,688 | 8.1 | 18.8 | 391 | 1.9 | 2010 |
Anguilla | 1 | 7.5 | 100.0 | 1 | 7.5 | 0.0 | 0 | 0.0 | 2010 |
Antigua and Barbuda | 10 | 11.2 | 67.9 | 7 | 7.6 | 32.1 | 3 | 3.6 | 2011 |
Argentina | 2,237 | 5.5 | 83.6 | 1,870 | 4.6 | 16.4 | 367 | 0.9 | 2011 |
Armenia | 54 | 1.8 | 64.8 | 35 | 1.2 | 35.2 | 19 | 0.6 | 2011 |
Aruba | 4 | 3.9 | 100.0 | 4 | 3.9 | 0.0 | 0 | 0.0 | 2010 |
Australia | 254 | 1.1 | 67.3 | 171 | 0.7 | 32.7 | 83 | 0.4 | 2010 |
Austria | 65 | 0.7 | 43.1 | 28 | 0.6 | 56.9 | 37 | 0.8 | 2020 |
Azerbaijan | 194 | 2.1 | 69.9 | 136 | 1.5 | 30.1 | 58 | 0.6 | 2012 |
Bahamas | 111 | 29.8 | 87.4 | 97 | 26.0 | 12.6 | 14 | 3.8 | 2011 |
Bahrain | 7 | 0.5 | 85.6 | 6 | 0.4 | 14.4 | 1 | 0.1 | 2011 |
Bangladesh | 4,169 | 2.7 | 63.2 | 2,635 | 1.7 | 36.8 | 1,534 | 1.0 | 2010 |
Barbados | 21 | 7.4 | 67.7 | 14 | 5.0 | 32.3 | 7 | 2.4 | 2010 |
Belarus | 486 | 5.1 | 67.7 | 329 | 3.5 | 32.3 | 157 | 1.6 | 2012 |
Belgium | 182 | 1.6 | 56.6 | 103 | 0.9 | 43.4 | 79 | 0.7 | 2012 |
Belize | 145 | 44.7 | 90.3 | 131 | 40.4 | 9.7 | 14 | 4.3 | 2011 |
Benin | 848 | 8.4 | 71.1 | 603 | 6.0 | 28.9 | 245 | 2.4 | 2011 |
Bhutan | 12 | 1.7 | 61.2 | 7 | 1.0 | 38.8 | 5 | 0.7 | 2010 |
Bolivia | 1,270 | 12.1 | 77.3 | 982 | 9.4 | 22.7 | 288 | 2.7 | 2012 |
Bosnia and Herzegovina | 41 | 1.2 | 75.6 | 31 | 0.9 | 24.4 | 10 | 0.3 | 2017 [4] |
Botswana | 368 | 18.4 | 76.0 | 280 | 14.0 | 24.0 | 88 | 4.4 | 2010 |
Brazil | 50,108 | 25.2 | 89.8 | 44,997 | 22.6 | 10.2 | 5,111 | 2.6 | 2010 |
British Virgin Islands | 2 | 8.4 | 50.0 | 1 | 4.2 | 50.0 | 1 | 4.2 | 2010 |
Brunei | 8 | 2.0 | 54.1 | 4 | 1.1 | 45.9 | 4 | 0.9 | 2010 |
Bulgaria | 141 | 1.9 | 82.3 | 116 | 1.6 | 17.7 | 25 | 0.3 | 2011 |
Burkina Faso | 1,311 | 8.0 | 67.2 | 881 | 5.4 | 32.8 | 430 | 2.6 | 2012 |
Burma | 8,044 | 15.2 | 61.5 | 4,947 | 9.3 | 38.5 | 3,097 | 5.9 | 2010 |
Burundi | 790 | 8.0 | 70.4 | 556 | 5.6 | 29.6 | 234 | 2.4 | 2010 |
Cambodia | 964 | 6.5 | 75.3 | 726 | 4.9 | 24.7 | 238 | 1.6 | 2010 |
Cameroon | 1,654 | 7.6 | 75.5 | 1,249 | 5.7 | 24.5 | 405 | 1.9 | 2012 |
Canada | 784 | 2.06 | 74.8 | 586 | 1.54 | 25.2 | 197 | 0.52 | 2021 [5] |
Cape Verde | 51 | 10.3 | 74.5 | 38 | 7.7 | 25.5 | 13 | 2.6 | 2010 |
Cayman Islands | 8 | 14.7 | 87.5 | 7 | 12.9 | 12.5 | 1 | 1.8 | 2010 |
Central African Republic | 532 | 11.8 | 85.6 | 455 | 10.1 | 14.4 | 77 | 1.7 | 2010 |
Chad | 907 | 7.3 | 71.2 | 646 | 5.2 | 28.8 | 261 | 2.1 | 2010 |
Chile | 550 | 3.1 | 81.9 | 450 | 2.5 | 18.1 | 100 | 0.6 | 2010 |
China | 13,410 | 1.0 | 78.1 | 10,473 | 0.8 | 21.9 | 2,937 | 0.2 | 2012 |
China, Hong Kong SAR | 27 | 0.4 | 47.1 | 13 | 0.2 | 52.9 | 14 | 0.2 | 2011 |
China, Macao SAR | 4 | 0.7 | 60.0 | 2 | 0.4 | 40.0 | 2 | 0.3 | 2010 |
Colombia | 14,670 | 30.8 | 91.6 | 13,438 | 28.2 | 8.4 | 1,232 | 2.6 | 2012 |
Comoros | 72 | 10.0 | 70.6 | 51 | 7.1 | 29.4 | 21 | 2.9 | 2010 |
Congo | 541 | 12.5 | 83.9 | 454 | 10.5 | 16.1 | 87 | 2.0 | 2011 |
Costa Rica | 407 | 8.5 | 87.7 | 357 | 7.5 | 12.3 | 50 | 1.0 | 2011 |
Croatia | 43 | 1.04 | 58.1 | 25 | 0.6 | 41.7 | 18 | 0.4 | 2017 [6] |
Cuba | 477 | 4.2 | 75.0 | 358 | 3.2 | 25.0 | 119 | 1.1 | 2012 |
Cyprus | 23 | 2.0 | 77.3 | 18 | 1.5 | 22.7 | 5 | 0.5 | 2012 |
Czech Republic | 77 | 0.7 | 49.4 | 38 | 0.7 | 50.6 | 39 | 0.7 | 2020 |
North Korea | 1,293 | 5.2 | 77.1 | 997 | 4.0 | 22.9 | 296 | 1.2 | 2010 |
DR Congo | 18,586 | 28.3 | 80.8 | 15,017 | 22.9 | 19.2 | 3,569 | 5.4 | 2010 |
Denmark | 47 | 0.8 | 66.0 | 31 | 0.5 | 34.0 | 16 | 0.3 | 2010 |
Djibouti | 87 | 10.1 | 72.3 | 63 | 7.3 | 27.7 | 24 | 2.8 | 2012 |
Dominica | 15 | 21.1 | 87.5 | 13 | 18.5 | 12.5 | 2 | 2.6 | 2012 |
Dominican Republic | 2,268 | 22.1 | 91.1 | 2,066 | 20.1 | 8.9 | 202 | 2.0 | 2010 |
East Timor | 39 | 3.6 | 73.1 | 29 | 2.6 | 26.9 | 10 | 1.0 | 2010 |
Ecuador | 1,924 | 12.4 | 91.8 | 1,766 | 11.4 | 8.2 | 158 | 1.0 | 2010 |
Egypt | 2,703 | 3.4 | 87.8 | 2,373 | 3.0 | 12.2 | 330 | 0.4 | 2006 |
El Salvador | 2,594 | 41.2 | 89.0 | 2,309 | 36.7 | 11.0 | 285 | 4.5 | 2010 |
Equatorial Guinea | 142 | 19.3 | 82.5 | 117 | 15.9 | 17.5 | 25 | 3.4 | 2010 |
Eritrea | 437 | 7.1 | 74.4 | 325 | 5.3 | 25.6 | 112 | 1.8 | 2012 |
Estonia | 65 | 5.0 | 76.6 | 50 | 3.8 | 23.4 | 15 | 1.2 | 2010 |
Ethiopia | 11,048 | 12.0 | 77.2 | 8,529 | 9.3 | 22.8 | 2,519 | 2.7 | 2010 |
Fiji | 35 | 4.0 | 61.3 | 21 | 2.5 | 38.7 | 14 | 1.5 | 2005 |
Finland | 89 | 1.6 | 53.9 | 48 | 0.9 | 46.1 | 41 | 0.7 | 2010 |
France | 734 | 1.1 | 68.9 | 506 | 1.6 | 31.1 | 228 | 0.7 | 2021 |
French Guiana | 30 | 13.3 | 81.8 | 25 | 10.9 | 18.2 | 5 | 2.4 | 2012 |
Gabon | 148 | 9.1 | 83.9 | 124 | 7.6 | 16.1 | 24 | 1.5 | 2010 |
Gambia | 182 | 10.2 | 68.9 | 125 | 7.0 | 31.1 | 57 | 3.2 | 2010 |
Georgia | 187 | 4.3 | 75.7 | 142 | 3.3 | 24.3 | 45 | 1.0 | 2010 |
Germany | 782 | 0.9 | 54.3 | 425 | 1.0 | 45.7 | 357 | 0.9 | 2020 |
Ghana | 1,537 | 6.1 | 63.8 | 981 | 3.9 | 36.2 | 556 | 2.2 | 2011 |
Greece | 184 | 1.7 | 93.4 | 172 | 1.6 | 6.6 | 12 | 0.1 | 2010 |
Grenada | 14 | 13.3 | 64.3 | 9 | 8.6 | 35.7 | 5 | 4.7 | 2010 |
Guadeloupe | 36 | 7.9 | 84.2 | 30 | 6.7 | 15.8 | 6 | 1.2 | 2010 |
Guatemala | 6,025 | 39.9 | 88.9 | 5,356 | 35.5 | 11.1 | 669 | 4.4 | 2010 |
Guinea | 1,018 | 8.9 | 69.4 | 706 | 6.2 | 30.6 | 312 | 2.7 | 2010 |
Guinea-Bissau | 140 | 8.4 | 70.6 | 99 | 5.9 | 29.4 | 41 | 2.5 | 2012 |
Guyana | 135 | 17.0 | 60.0 | 81 | 10.2 | 40.0 | 54 | 6.8 | 2008 |
Haiti | 1,033 | 10.2 | 78.4 | 810 | 8.0 | 21.6 | 223 | 2.2 | 2012 |
Honduras | 7,172 | 90.4 | 93.2 | 6,684 | 84.3 | 6.8 | 488 | 6.1 | 2010 |
Hungary | 80 | 0.8 | 51.2 | 41 | 0.9 | 48.8 | 39 | 0.8 | 2020 |
Iceland | 1 | 0.3 | 0.0 | 0 | 0.0 | 100.0 | 1 | 0.3 | 2010 |
India | 43,355 | 3.5 | 59.2 | 25,666 | 2.1 | 40.8 | 17,689 | 1.4 | 2012 |
Indonesia | 1,456 | 0.6 | 80.3 | 1,169 | 0.5 | 19.7 | 287 | 0.1 | 2010 |
Iran | 3,126 | 4.1 | 81.9 | 2,560 | 3.4 | 18.1 | 566 | 0.7 | 2010 |
Iraq | 2,628 | 8.0 | 68.3 | 1,795 | 5.5 | 31.7 | 833 | 2.5 | 2010 |
Ireland | 54 | 1.2 | 86.7 | 47 | 1.0 | 13.3 | 7 | 0.2 | 2012 |
Israel | 134 | 1.8 | 72.8 | 98 | 1.3 | 27.2 | 36 | 0.5 | 2010 |
Italy | 530 | 0.9 | 69.9 | 370 | 0.6 | 30.1 | 160 | 0.3 | 2011 |
Ivory Coast | 2,691 | 13.6 | 76.0 | 2,045 | 10.3 | 24.0 | 646 | 3.3 | 2010 |
Jamaica | 1,087 | 39.3 | 89.5 | 973 | 35.2 | 10.5 | 114 | 4.1 | 2010 |
Japan | 318 | 0.3 | 41.2 | 131 | 0.2 | 58.8 | 187 | 0.3 | 2020 |
Jordan | 133 | 2.0 | 76.6 | 102 | 1.5 | 23.4 | 31 | 0.5 | 2010 |
Kazakhstan | 1,263 | 7.8 | 82.1 | 1,037 | 6.4 | 17.9 | 226 | 1.4 | 2010 |
Kenya | 2,761 | 6.4 | 76.6 | 2,115 | 4.9 | 23.4 | 646 | 1.5 | 2010 |
Kiribati | 8 | 8.2 | 69.4 | 6 | 5.7 | 30.6 | 2 | 2.5 | 2012 |
Kuwait | 12 | 0.4 | 83.6 | 10 | 0.3 | 16.4 | 2 | 0.1 | 2010 |
Kyrgyzstan | 494 | 9.1 | 68.7 | 339 | 6.3 | 31.3 | 155 | 2.8 | 2012 |
Laos | 392 | 5.9 | 79.4 | 311 | 4.7 | 20.6 | 81 | 1.2 | 2011 |
Latvia | 97 | 4.7 | 49.0 | 48 | 2.3 | 51.0 | 49 | 2.4 | 2010 |
Lebanon | 95 | 2.2 | 79.5 | 76 | 1.7 | 20.5 | 19 | 0.5 | 2012 |
Lesotho | 764 | 38.0 | 74.0 | 565 | 28.1 | 26.0 | 199 | 9.9 | 2010 |
Liberia | 135 | 3.2 | 70.1 | 95 | 2.2 | 29.9 | 40 | 1.0 | 2009 |
Libya | 103 | 1.7 | 76.8 | 79 | 1.3 | 23.2 | 24 | 0.4 | 2010 |
Lithuania | 202 | 6.7 | 73.8 | 149 | 4.9 | 26.2 | 53 | 1.8 | 2010 |
Luxembourg | 4 | 0.8 | 100.0 | 4 | 0.8 | 0.0 | 0 | 0.0 | 2011 |
Macedonia | 30 | 1.4 | 86.7 | 26 | 1.2 | 13.3 | 4 | 0.2 | 2010 |
Madagascar | 2,465 | 11.1 | 71.6 | 1,765 | 7.9 | 28.4 | 700 | 3.2 | 2010 |
Malawi | 279 | 1.8 | 87.5 | 244 | 1.6 | 12.5 | 35 | 0.2 | 2010 |
Malaysia | 652 | 2.3 | 72.6 | 473 | 1.7 | 27.4 | 179 | 0.6 | 2009 |
Maldives | 13 | 3.9 | 63.3 | 8 | 2.5 | 36.7 | 5 | 1.4 | 2010 |
Mali | 1,119 | 7.5 | 65.0 | 727 | 4.9 | 35.0 | 392 | 2.6 | 2012 |
Malta | 12 | 2.8 | 75.0 | 9 | 2.1 | 25.0 | 3 | 0.7 | 2011 |
Marshall Islands | 2 | 4.7 | 81.3 | 2 | 3.8 | 18.7 | 0 | 0.9 | 2012 |
Martinique | 11 | 2.7 | 72.7 | 8 | 2.0 | 27.3 | 3 | 0.7 | 2010 |
Mauritania | 191 | 5.0 | 68.9 | 132 | 3.4 | 31.1 | 59 | 1.6 | 2010 |
Mauritius | 34 | 2.8 | 76.5 | 26 | 2.1 | 23.5 | 8 | 0.7 | 2010 |
Mexico | 26,037 | 21.5 | 89.3 | 23,251 | 19.2 | 10.7 | 2,786 | 2.3 | 2012 |
Micronesia | 5 | 4.6 | 74.2 | 4 | 3.4 | 25.8 | 1 | 1.2 | 2008 |
Moldova | 229 | 6.5 | 72.5 | 166 | 4.7 | 27.5 | 63 | 1.8 | 2011 |
Mongolia | 266 | 9.7 | 77.4 | 206 | 7.5 | 22.6 | 60 | 2.2 | 2010 |
Montenegro | 17 | 2.7 | 82.4 | 14 | 2.2 | 17.6 | 3 | 0.5 | 2012 |
Montserrat | 1 | 20.4 | 100.0 | 1 | 20.4 | 0.0 | 0 | 0.0 | 2010 |
Morocco | 704 | 2.2 | 87.8 | 618 | 1.9 | 12.2 | 86 | 0.3 | 2010 |
Mozambique | 3,133 | 12.4 | 75.8 | 2,375 | 9.4 | 24.2 | 758 | 3.0 | 2010 |
Namibia | 388 | 17.2 | 76.3 | 296 | 13.1 | 23.7 | 92 | 4.1 | 2008 |
Nepal | 786 | 2.9 | 77.3 | 608 | 2.2 | 22.7 | 178 | 0.7 | 2010 |
Netherlands | 145 | 0.9 | 65.0 | 94 | 0.6 | 35.0 | 51 | 0.3 | 2012 |
New Zealand | 41 | 0.9 | 48.8 | 20 | 0.4 | 51.2 | 21 | 0.5 | 2010 |
Nicaragua | 675 | 11.3 | 92.6 | 625 | 10.5 | 7.4 | 50 | 0.8 | 2010 |
Niger | 803 | 4.7 | 66.1 | 531 | 3.1 | 33.9 | 272 | 1.6 | 2010 |
Nigeria | 33,817 | 20.0 | 68.2 | 23,063 | 13.6 | 31.8 | 10,754 | 6.4 | 2010 |
Norway | 111 | 2.2 | 53.2 | 59 | 1.2 | 46.8 | 52 | 1.0 | 2010 |
Oman | 34 | 1.1 | 73.3 | 25 | 0.8 | 26.7 | 9 | 0.3 | 2010 |
Pakistan | 13,846 | 7.7 | 76.7 | 10,620 | 5.9 | 23.3 | 3,226 | 1.8 | 2010 |
Panama | 654 | 17.2 | 94.6 | 619 | 16.3 | 5.4 | 35 | 0.9 | 2009 |
Papua New Guinea | 713 | 10.4 | 73.7 | 525 | 7.7 | 26.3 | 188 | 2.7 | 2010 |
Paraguay | 649 | 9.7 | 88.8 | 576 | 8.6 | 11.2 | 73 | 1.1 | 2009 |
Peru | 2,865 | 9.6 | 78.1 | 2,238 | 7.5 | 21.9 | 627 | 2.1 | 2010 |
Philippines | 8,484 | 8.8 | 88.0 | 7,466 | 7.7 | 12.0 | 1,018 | 1.1 | 2011 |
Poland | 449 | 1.2 | 73.2 | 329 | 0.9 | 26.8 | 120 | 0.3 | 2010 |
Portugal | 122 | 1.2 | 70.2 | 86 | 0.8 | 29.8 | 36 | 0.4 | 2011 |
Puerto Rico | 978 | 26.5 | 94.1 | 920 | 24.9 | 5.9 | 58 | 1.6 | 2010 |
Qatar | 23 | 1.1 | 81.9 | 19 | 0.9 | 18.1 | 4 | 0.2 | 2010 |
Réunion | 15 | 1.8 | 75.0 | 11 | 1.4 | 25.0 | 4 | 0.5 | 2010 |
Romania | 378 | 1.7 | 62.5 | 236 | 1.1 | 37.5 | 142 | 0.6 | 2010 |
Russia | 13,120 | 9.2 | 75.5 | 9,906 | 6.9 | 24.5 | 3,214 | 2.3 | 2012 |
Rwanda | 2,648 | 23.1 | 70.9 | 1,877 | 16.4 | 29.1 | 771 | 6.7 | 2012 |
Saint Kitts and Nevis | 18 | 33.6 | 90.5 | 16 | 30.4 | 9.5 | 2 | 3.2 | 2011 |
Saint Lucia | 39 | 21.6 | 79.7 | 31 | 17.2 | 20.3 | 8 | 4.4 | 2008 |
Saint Vincent and the Grenadines | 28 | 25.6 | 88.0 | 25 | 22.5 | 12.0 | 3 | 3.1 | 2010 |
Samoa | 7 | 3.6 | 81.2 | 6 | 2.9 | 18.8 | 1 | 0.7 | 2010 |
São Tomé and Príncipe | 6 | 3.3 | 74.6 | 4 | 2.5 | 25.4 | 2 | 0.8 | 2010 |
Saudi Arabia | 234 | 0.8 | 66.7 | 156 | 0.5 | 33.3 | 78 | 0.3 | 2011 |
Senegal | 379 | 2.8 | 74.8 | 283 | 2.1 | 25.2 | 96 | 0.7 | 2010 |
Serbia | 111 | 1.2 | 64.9 | 72 | 0.8 | 35.1 | 39 | 0.4 | 2010 |
Seychelles | 9 | 9.5 | 79.3 | 7 | 7.5 | 20.7 | 2 | 2.0 | 2010 |
Sierra Leone | 113 | 1.9 | 76.8 | 87 | 1.5 | 23.2 | 26 | 0.4 | 2012 |
Singapore | 11 | 0.2 | 62.5 | 7 | 0.1 | 37.5 | 4 | 0.1 | 2010 |
Slovakia | 75 | 1.4 | 68.0 | 51 | 1.0 | 32.0 | 24 | 0.4 | 2011 |
Slovenia | 14 | 0.7 | 57.1 | 8 | 0.4 | 42.9 | 6 | 0.3 | 2010 |
Solomon Islands | 24 | 4.3 | 74.8 | 18 | 3.2 | 25.2 | 6 | 1.1 | 2010 |
Somalia | 819 | 8.0 | 73.9 | 605 | 5.9 | 26.1 | 214 | 2.1 | 2012 |
South Africa | 16,259 | 31.0 | 84.6 | 13,755 | 26.2 | 15.4 | 2,504 | 4.8 | 2009 |
South Korea | 302 | 0.6 | 54.3 | 164 | 0.6 | 45.7 | 138 | 0.5 | 2020 |
South Sudan | 1,504 | 13.9 | 82.5 | 1,241 | 11.5 | 17.5 | 263 | 2.4 | 1994 |
Spain | 364 | 0.8 | 65.7 | 239 | 0.5 | 34.3 | 125 | 0.3 | 2009 |
Sri Lanka | 707 | 3.4 | 84.8 | 600 | 2.9 | 15.2 | 107 | 0.5 | 2012 |
State of Palestine | 312 | 7.4 | 87.6 | 273 | 6.5 | 12.4 | 39 | 0.9 | 2010 |
Sudan | 4,159 | 11.2 | 85.3 | 3,548 | 9.6 | 14.7 | 611 | 1.6 | 2011 |
Suriname | 33 | 6.1 | 75.3 | 25 | 4.6 | 24.7 | 8 | 1.5 | 2010 |
Swaziland | 416 | 33.8 | 77.9 | 324 | 26.3 | 22.1 | 92 | 7.5 | 2011 |
Sweden | 68 | 0.7 | 68.1 | 46 | 0.5 | 31.9 | 22 | 0.2 | 2010 |
Switzerland | 47 | 0.5 | 42.6 | 20 | 0.5 | 57.4 | 27 | 0.6 | 2020 |
Syria | 463 | 2.2 | 84.0 | 389 | 1.8 | 16.0 | 74 | 0.4 | 2010 |
Taiwan | 686 | 3.0 | 86.6 | 594 | 2.6 | 13.4 | 92 | 0.4 | 2009 |
Tajikistan | 126 | 1.6 | 86.5 | 109 | 1.4 | 13.5 | 17 | 0.2 | 2010 |
Tanzania | 6,071 | 12.7 | 73.0 | 4,432 | 9.3 | 27.0 | 1,639 | 3.4 | 2010 |
Thailand | 3,307 | 5.0 | 87.7 | 2,900 | 4.4 | 12.3 | 407 | 0.6 | 2007 |
Togo | 684 | 10.3 | 71.5 | 489 | 7.4 | 28.5 | 195 | 2.9 | 2010 |
Tonga | 1 | 1.0 | 0.0 | 0 | 0.0 | 100.0 | 1 | 1.0 | 2010 |
Trinidad and Tobago | 379 | 28.3 | 91.7 | 348 | 26.0 | 8.3 | 31 | 2.3 | 2010 |
Tunisia | 235 | 2.2 | 77.0 | 181 | 1.7 | 23.0 | 54 | 0.5 | 2010 |
Turkey | 1,866 | 2.6 | 79.5 | 1,483 | 2.1 | 20.5 | 383 | 0.5 | 2011 |
Turkmenistan | 660 | 12.8 | 83.8 | 553 | 10.7 | 16.2 | 107 | 2.1 | 2010 |
Turks and Caicos Islands | 2 | 6.6 | 100.0 | 2 | 6.6 | 0.0 | 0 | 0.0 | 2010 |
Uganda | 3,753 | 10.7 | 86.2 | 3,235 | 9.2 | 13.8 | 518 | 1.5 | 2010 |
Ukraine | 1,988 | 4.3 | 68.6 | 1,364 | 2.9 | 31.4 | 624 | 1.4 | 2009 |
United Arab Emirates | 235 | 2.6 | 86.8 | 204 | 2.3 | 13.2 | 31 | 0.3 | 2012 |
United Kingdom | 653 | 1.0 | 70.3 | 459 | 0.7 | 29.7 | 194 | 0.3 | 2012 |
United States | 21,570 | 7.8 | 82 | 17687 | 6.4 | 18 | 3883 | 1.4 | 2020 [7] [8] |
US Virgin Islands | 56 | 52.6 | 87.5 | 49 | 46.0 | 12.5 | 7 | 6.6 | 2010 |
Uruguay | 267 | 7.9 | 79.4 | 212 | 6.3 | 20.6 | 55 | 1.6 | 2010 |
Uzbekistan | 1,060 | 3.7 | 82.4 | 873 | 3.0 | 17.6 | 187 | 0.7 | 2010 |
Vanuatu | 7 | 2.9 | 72.0 | 5 | 2.1 | 28.0 | 2 | 0.8 | 2011 |
Venezuela | 16,072 | 53.7 | 91.9 | 14,770 | 49.4 | 8.1 | 1,302 | 4.3 | 2010 |
Vietnam | 3,037 | 3.3 | 71.5 | 2,171 | 2.4 | 28.5 | 866 | 0.9 | 2011 |
Yemen | 1,099 | 4.8 | 79.5 | 874 | 3.8 | 20.5 | 225 | 1.0 | 2012 |
Zambia | 1,501 | 10.7 | 77.8 | 1,168 | 8.3 | 22.2 | 333 | 2.4 | 2011 |
Zimbabwe | 1,450 | 10.6 | 71.8 | 1,041 | 7.6 | 28.2 | 409 | 3.0 | 2010 |
World | 436,621 | 78.7 | 343,582 | 21.3 | 93,033 |
Homicide is an act in which a human causes the death of another human.
A violent crime, violent felony, crime of violence or crime of a violent nature is a crime in which an offender or perpetrator uses or threatens to use harmful force upon a victim. This entails both crimes in which the violent act is the objective, such as murder, assault, rape and assassination, as well as crimes in which violence is used as a method of coercion or show of force, such as robbery, extortion and terrorism. Violent crimes may, or may not, be committed with weapons. Depending on the jurisdiction, violent crimes may be regarded with varying severities from homicide to harassment. There have been many theories regarding heat being the cause of an increase in violent crime. Theorists claim that violent crime is persistent during the summer due to the heat, further causing people to become aggressive and commit more violent crime.
Crime in Canada is generally considered low overall. Under the Canadian constitution, the power to establish criminal law and rules of investigation is vested in the federal Parliament. The provinces share responsibility for law enforcement, and while the power to prosecute criminal offences is assigned to the federal government, responsibility for prosecutions is delegated to the provinces for most types of criminal offences. Laws and sentencing guidelines are uniform throughout the country, but provinces vary in their level of enforcement.
Femicide or feminicide is a term for the hate crime of systematically killing women, girls, or females in general because of their sex. In 1976, the feminist author Diana E. H. Russell first implicitly defined the term as a hate killing of females by males but then went on to redefine it as "the killing of females by males because they are female" in later years. Femicide can be perpetrated by either gender but is more often committed by men. This is most likely due to unequal power between men and women as well as harmful gender roles, stereotypes, or social norms.
Sex differences in crime are differences between men and women as the perpetrators or victims of crime. Such studies may belong to fields such as criminology, sociobiology, or feminist studies. Despite the difficulty of interpreting them, crime statistics may provide a way to investigate such a relationship from a gender differences perspective. An observable difference in crime rates between men and women might be due to social and cultural factors, crimes going unreported, or to biological factors for example, testosterone or sociobiological theories). The nature or motive of the crime itself may also require consideration as a factor.
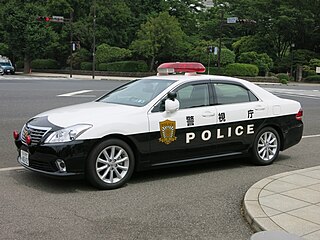
Crime in Japan has been recorded since at least the 1800s, and has varied over time.
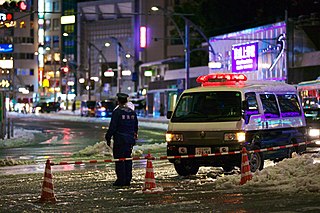
Law enforcement in Japan is provided mainly by prefectural police under the oversight of the National Police Agency. The National Police Agency is administered by the National Public Safety Commission, ensuring that Japan's police are an apolitical body and free of direct central government executive control. They are checked by an independent judiciary and monitored by a free and active press.
Crime has been recorded in the United States since its founding and has fluctuated significantly over time, with a sharp rise after 1900 and reaching a broad bulging peak between the 1970s and early 1990s. After 1992, crime rates have generally trended downwards each year, with the exceptions of a slight increase in property crimes in 2001 and increases in violent crimes in 2005-2006, 2014-2016 and 2020-2021. While official federal crime data beginning in 2021 has a wide margin of error due to the incomplete adoption of the National Incident-Based Reporting System by government agencies, federal data for 2020-2021 and limited data from select U.S. cities collected by the nonpartisan Council on Criminal Justice showed significantly elevated rates of homicide and motor vehicle theft in 2020-2022. Although overall crime rates have fallen far below the peak of crime seen in the United States during the late 1980s and early 1990s, the homicide rate in the U.S. has remained high, relative to other "high income"/developed nations, with eight major U.S. cities ranked among the 50 cities with the highest homicide rate in the world in 2022. The aggregate cost of crime in the United States is significant, with an estimated value of $4.9 trillion reported in 2021. Data from the first half of 2023, from government and private sector sources show that the murder rate has dropped, as much as 12% in as many as 90 cities across the United States. The drop in homicide rates is not uniform across the country however, with some cities such as Memphis, TN, showing an uptick in murder rates.
Gun-related violence is violence committed with the use of a firearm. Gun-related violence may or may not be considered criminal. Criminal violence includes homicide, assault with a deadly weapon, and suicide, or attempted suicide, depending on jurisdiction. Non-criminal violence includes accidental or unintentional injury and death. Also generally included in gun violence statistics are military or para-military activities.
Crime and violence affect the lives of millions of people in Latin America. Some consider social inequality to be a major contributing factor to levels of violence in Latin America, where the state fails to prevent crime and organized crime takes over State control in areas where the State is unable to assist the society such as in impoverished communities. In the years following the transitions from authoritarianism to democracy, crime and violence have become major problems in Latin America. The region experienced more than 2.5 million murders between 2000 and 2017. Several studies indicated the existence of an epidemic in the region; the Pan American Health Organization called violence in Latin America "the social pandemic of the 20th century." Apart from the direct human cost, the rise in crime and violence has imposed significant social costs and has made much more difficult the processes of economic and social development, democratic consolidation and regional integration in the Americas.
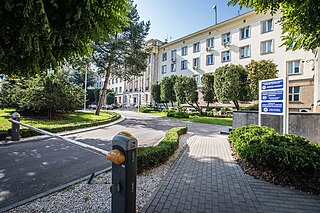
Crime in Poland refers to the incidence, deterrence, and handling of criminal activity in the Republic of Poland by Polish law enforcement agencies charged with ensuring public safety and maintaining order. Poland ranks favorably in terms of public safety, with one of the lowest homicide rates in Europe. Poland was ranked 25th in the 2022 Global Peace Index and scored 0.0 on the 2023 Global Terrorism Index.
Crime in Paraguay has increased in recent years with criminals often targeting those thought to be wealthy. Although most crime in Paraguay is nonviolent, there has been an increase in the use of weapons and there have been incidents where extreme violence has been used.
Some areas of Jamaica, particularly population centers such as Kingston, Montego Bay and Spanish Town, experience high levels of crime and violence. Jamaica has had one of the highest intentional homicide rates in the world for many years, according to United Nations estimates. Former Prime Minister P. J. Patterson described the situation as "a national challenge of unprecedented proportions".
Figures on crime in London are based primarily on two sets of statistics: the Crime Survey for England and Wales (CSEW) and police recorded crime data. Greater London is generally served by three police forces; the Metropolitan Police which is responsible for policing the vast majority of the capital, the City of London Police which is responsible for The Square Mile of the City of London and the British Transport Police, which polices the national rail network and the London Underground. A fourth police force in London, the Ministry of Defence Police, do not generally become involved with policing the general public. London also has a number of small constabularies for policing parks. Within the Home Office crime statistic publications, Greater London is referred to as the London Region.
Colombia has a high crime rate due to being a center for the cultivation and trafficking of cocaine. The Colombian conflict began in the mid-1960s and is a low-intensity conflict between Colombian governments, paramilitary groups, crime syndicates, and left-wing guerrillas such as the Revolutionary Armed Forces of Colombia (FARC), and the National Liberation Army (ELN), fighting each other to increase their influence in Colombian territory. Two of the most important international actors that have contributed to the Colombian conflict are multinational companies and the United States.
Crime is present in various forms in the Philippines, and remains a serious issue throughout the country. Illegal drug trade, human trafficking, arms trafficking, murder, corruption and domestic violence remain significant concerns.
Sustainable Development Goal 16 is one of the 17 Sustainable Development Goals established by the United Nations in 2015, the official wording is: "Promote peaceful and inclusive societies for sustainable development, provide access to justice for all and build effective, accountable and inclusive institutions at all levels". The Goal has 12 targets and 23 indicators.