Digital image processing is the use of a digital computer to process digital images through an algorithm. As a subcategory or field of digital signal processing, digital image processing has many advantages over analog image processing. It allows a much wider range of algorithms to be applied to the input data and can avoid problems such as the build-up of noise and distortion during processing. Since images are defined over two dimensions digital image processing may be modeled in the form of multidimensional systems. The generation and development of digital image processing are mainly affected by three factors: first, the development of computers; second, the development of mathematics ; third, the demand for a wide range of applications in environment, agriculture, military, industry and medical science has increased.

The Canny edge detector is an edge detection operator that uses a multi-stage algorithm to detect a wide range of edges in images. It was developed by John F. Canny in 1986. Canny also produced a computational theory of edge detection explaining why the technique works.

In digital image processing and computer vision, image segmentation is the process of partitioning a digital image into multiple image segments, also known as image regions or image objects. The goal of segmentation is to simplify and/or change the representation of an image into something that is more meaningful and easier to analyze. Image segmentation is typically used to locate objects and boundaries in images. More precisely, image segmentation is the process of assigning a label to every pixel in an image such that pixels with the same label share certain characteristics.
The scale-invariant feature transform (SIFT) is a computer vision algorithm to detect, describe, and match local features in images, invented by David Lowe in 1999. Applications include object recognition, robotic mapping and navigation, image stitching, 3D modeling, gesture recognition, video tracking, individual identification of wildlife and match moving.

In computer vision and image processing, Otsu's method, named after Nobuyuki Otsu, is used to perform automatic image thresholding. In the simplest form, the algorithm returns a single intensity threshold that separate pixels into two classes, foreground and background. This threshold is determined by minimizing intra-class intensity variance, or equivalently, by maximizing inter-class variance. Otsu's method is a one-dimensional discrete analog of Fisher's Discriminant Analysis, is related to Jenks optimization method, and is equivalent to a globally optimal k-means performed on the intensity histogram. The extension to multi-level thresholding was described in the original paper, and computationally efficient implementations have since been proposed.
In computer vision and image processing, a feature is a piece of information about the content of an image; typically about whether a certain region of the image has certain properties. Features may be specific structures in the image such as points, edges or objects. Features may also be the result of a general neighborhood operation or feature detection applied to the image. Other examples of features are related to motion in image sequences, or to shapes defined in terms of curves or boundaries between different image regions.
A co-occurrence matrix or co-occurrence distribution is a matrix that is defined over an image to be the distribution of co-occurring pixel values at a given offset. It is used as an approach to texture analysis with various applications especially in medical image analysis.
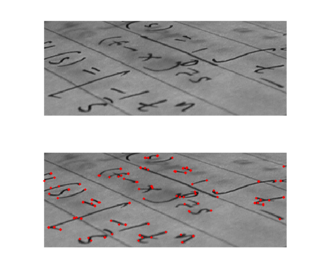
Corner detection is an approach used within computer vision systems to extract certain kinds of features and infer the contents of an image. Corner detection is frequently used in motion detection, image registration, video tracking, image mosaicing, panorama stitching, 3D reconstruction and object recognition. Corner detection overlaps with the topic of interest point detection.
In mathematics, the structure tensor, also referred to as the second-moment matrix, is a matrix derived from the gradient of a function. It describes the distribution of the gradient in a specified neighborhood around a point and makes the information invariant respect the observing coordinates. The structure tensor is often used in image processing and computer vision.
As applied in the field of computer vision, graph cut optimization can be employed to efficiently solve a wide variety of low-level computer vision problems, such as image smoothing, the stereo correspondence problem, image segmentation, object co-segmentation, and many other computer vision problems that can be formulated in terms of energy minimization. Many of these energy minimization problems can be approximated by solving a maximum flow problem in a graph. Under most formulations of such problems in computer vision, the minimum energy solution corresponds to the maximum a posteriori estimate of a solution. Although many computer vision algorithms involve cutting a graph, the term "graph cuts" is applied specifically to those models which employ a max-flow/min-cut optimization.
The histogram of oriented gradients (HOG) is a feature descriptor used in computer vision and image processing for the purpose of object detection. The technique counts occurrences of gradient orientation in localized portions of an image. This method is similar to that of edge orientation histograms, scale-invariant feature transform descriptors, and shape contexts, but differs in that it is computed on a dense grid of uniformly spaced cells and uses overlapping local contrast normalization for improved accuracy.
In computer vision, the bag-of-words model sometimes called bag-of-visual-words model can be applied to image classification or retrieval, by treating image features as words. In document classification, a bag of words is a sparse vector of occurrence counts of words; that is, a sparse histogram over the vocabulary. In computer vision, a bag of visual words is a vector of occurrence counts of a vocabulary of local image features.
Object recognition – technology in the field of computer vision for finding and identifying objects in an image or video sequence. Humans recognize a multitude of objects in images with little effort, despite the fact that the image of the objects may vary somewhat in different view points, in many different sizes and scales or even when they are translated or rotated. Objects can even be recognized when they are partially obstructed from view. This task is still a challenge for computer vision systems. Many approaches to the task have been implemented over multiple decades.

A bilateral filter is a non-linear, edge-preserving, and noise-reducing smoothing filter for images. It replaces the intensity of each pixel with a weighted average of intensity values from nearby pixels. This weight can be based on a Gaussian distribution. Crucially, the weights depend not only on Euclidean distance of pixels, but also on the radiometric differences. This preserves sharp edges.
Region growing is a simple region-based image segmentation method. It is also classified as a pixel-based image segmentation method since it involves the selection of initial seed points.
The random walker algorithm is an algorithm for image segmentation. In the first description of the algorithm, a user interactively labels a small number of pixels with known labels, e.g., "object" and "background". The unlabeled pixels are each imagined to release a random walker, and the probability is computed that each pixel's random walker first arrives at a seed bearing each label, i.e., if a user places K seeds, each with a different label, then it is necessary to compute, for each pixel, the probability that a random walker leaving the pixel will first arrive at each seed. These probabilities may be determined analytically by solving a system of linear equations. After computing these probabilities for each pixel, the pixel is assigned to the label for which it is most likely to send a random walker. The image is modeled as a graph, in which each pixel corresponds to a node which is connected to neighboring pixels by edges, and the edges are weighted to reflect the similarity between the pixels. Therefore, the random walk occurs on the weighted graph.
Document mosaicing is a process that stitches multiple, overlapping snapshot images of a document together to produce one large, high resolution composite. The document is slid under a stationary, over-the-desk camera by hand until all parts of the document are snapshotted by the camera's field of view. As the document slid under the camera, all motion of the document is coarsely tracked by the vision system. The document is periodically snapshotted such that the successive snapshots are overlap by about 50%. The system then finds the overlapped pairs and stitches them together repeatedly until all pairs are stitched together as one piece of document.
In image processing, a kernel, convolution matrix, or mask is a small matrix used for blurring, sharpening, embossing, edge detection, and more. This is accomplished by doing a convolution between the kernel and an image.

In computer vision, a saliency map is an image that highlights the region on which people's eyes focus first. The goal of a saliency map is to reflect the degree of importance of a pixel to the human visual system. For example, in this image, a person first looks at the fort and light clouds, so they should be highlighted on the saliency map. Saliency maps engineered in artificial or computer vision are typically not the same as the actual saliency map constructed by biological or natural vision.
Integral Channel Features (ICF), also known as ChnFtrs, is a method for object detection in computer vision. It uses integral images to extract features such as local sums, histograms and Haar-like features from multiple registered image channels. This method was highly exploited by Dollár et al. in their work for pedestrian detection, that was first described at the BMVC in 2009.


