Related Research Articles

An embedded system is a computer system—a combination of a computer processor, computer memory, and input/output peripheral devices—that has a dedicated function within a larger mechanical or electronic system. It is embedded as part of a complete device often including electrical or electronic hardware and mechanical parts. Because an embedded system typically controls physical operations of the machine that it is embedded within, it often has real-time computing constraints. Embedded systems control many devices in common use today. In 2009 it was estimated that ninety-eight percent of all microprocessors manufactured were used in embedded systems.
A memory debugger is a debugger for finding software memory problems such as memory leaks and buffer overflows. These are due to bugs related to the allocation and deallocation of dynamic memory. Programs written in languages that have garbage collection, such as managed code, might also need memory debuggers, e.g. for memory leaks due to "living" references in collections.
Valgrind is a programming tool for memory debugging, memory leak detection, and profiling.
PurifyPlus is a memory debugger program used by software developers to detect memory access errors in programs, especially those written in C or C++. It was originally written by Reed Hastings of Pure Software. Pure Software later merged with Atria Software to form Pure Atria Software, which in turn was later acquired by Rational Software, which in turn was acquired by IBM, and then divested to UNICOM Systems, Inc. on Dec 31, 2014. It is functionally similar to other memory debuggers, such as Insure++, Valgrind and BoundsChecker.
Insure++ is a memory debugger computer program, used by software developers to detect various errors in programs written in C and C++. It is made by Parasoft, and is functionally similar to other memory debuggers, such as Purify, Valgrind and Dr Memory.
Arm DDT is a commercial C, C++ and Fortran 90 debugger produced by Allinea Software now part of Arm of Warwick, United Kingdom. It is widely used for debugging parallel Message Passing Interface (MPI) and threaded programs, including those running on clusters of Linux machines.
The Apple Developer Tools are a suite of software tools from Apple to aid in making software dynamic titles for the macOS and iOS platforms. The developer tools were formerly included on macOS install media, but are now exclusively distributed over the Internet. As of macOS 10.12, Xcode is available as a free download from the Mac App Store.
Dynamic program analysis is the analysis of computer software that is performed by executing programs on a real or virtual processor. For dynamic program analysis to be effective, the target program must be executed with sufficient test inputs to cover almost all possible outputs. Use of software testing measures such as code coverage helps ensure that an adequate slice of the program's set of possible behaviors has been observed. Also, care must be taken to minimize the effect that instrumentation has on the execution of the target program. Dynamic analysis is in contrast to static program analysis. Unit tests, integration tests, system tests and acceptance tests use dynamic testing.
VTune Profiler is a performance analysis tool for x86 based machines running Linux or Microsoft Windows operating systems. Many features work on both Intel and AMD hardware, but advanced hardware-based sampling requires an Intel-manufactured CPU.
Intel C++ Compiler Classic and Intel oneAPI DPC++/C++ Compiler are Intel’s C, C++, SYCL, and Data Parallel C++ (DPC++) compilers for Intel processor-based systems, available for Microsoft Windows, Linux, and macOS operating systems.
BoundsChecker is a memory checking and API call validation tool used for C++ software development with Microsoft Visual C++. It was created by NuMega in the early 1990s. When NuMega was purchased by Compuware in 1997, BoundsChecker became part of a larger tool suite, DevPartner Studio. Micro Focus purchased the product line from Compuware in 2009. Comparable tools include Purify, Insure++ and Valgrind.
Intel Fortran Compiler, is a group of Fortran compilers from Intel for Windows, macOS, and Linux.
Intel Parallel Studio XE was a software development product developed by Intel that facilitated native code development on Windows, macOS and Linux in C++ and Fortran for parallel computing. Parallel programming enables software programs to take advantage of multi-core processors from Intel and other processor vendors.
Parasoft is an independent software vendor specializing in automated software testing and application security with headquarters in Monrovia, California. It was founded in 1987 by four graduates of the California Institute of Technology who planned to commercialize the parallel computing software tools they had been working on for the Caltech Cosmic Cube, which was the first working hypercube computer built.
In computer programming and software development, debugging is the process of finding and resolving bugs within computer programs, software, or systems.
Intel Advisor is a design assistance and analysis tool for SIMD vectorization, threading, memory use, and GPU offload optimization. The tool supports C, C++, Data Parallel C++ (DPC++), Fortran and Python languages. It is available on Windows and Linux operating systems in form of Standalone GUI tool, Microsoft Visual Studio plug-in or command line interface. It supports OpenMP. Intel Advisor user interface is also available on macOS.
DynamoRIO is a BSD licensed dynamic binary instrumentation framework for the development of dynamic program analysis tools. DynamoRIO targets user space applications under the Android, Linux, and Windows operating systems running on the AArch32, IA-32, and x86-64 instruction set architectures.
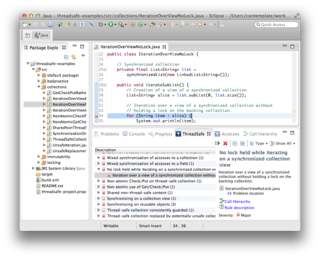
ThreadSafe is a source code analysis tool that identifies application risks and security vulnerabilities associated with concurrency in Java code bases, using whole-program interprocedural analysis. ThreadSafe is used to identify and avoid software failures in concurrent applications running in complex environments.
References
- ↑ "Intel® Inspector Release Notes and New Features". software.intel.com.
- ↑ "Intel® Inspector Integrated Debugger Support". Intel. Retrieved 2021-01-07.
- ↑ "How to Detect Persistent Memory Programming Errors Using Intel®..." Intel. Retrieved 2021-01-07.