Internet traffic

Last updated
Global Internet Traffic as of 2018

Internet traffic is the flow of data within the entire Internet, or in certain network links of its constituent networks. Common traffic measurements are total volume, in units of multiples of the byte, or as transmission rates in bytes per certain time units.

Contents

As the topology of the Internet is not hierarchical, no single point of measurement is possible for total Internet traffic. Traffic data may be obtained from the Tier 1 network providers' peering points for indications of volume and growth. However, Such data excludes traffic that remains within a single service provider's network and traffic that crosses private peering points.

As of December 2022 almost half (48%) of Internet traffic is in India and China, while North America and Europe have about a quarter of global internet traffic. [1]

Traffic sources

File sharing constitutes a fraction of Internet traffic. [2] The prevalent technology for file sharing is the BitTorrent protocol, which is a peer-to-peer (P2P) system mediated through indexing sites that provide resource directories. According to a Sandvine Research in 2013, Bit Torrent's share of Internet traffic decreased by 20% to 7.4% overall, reduced from 31% in 2008. [3]

As of 2023, roughly 65% of all internet traffic came from video sites, [4] up from 51% in 2016. [5]

In 2022, roughly 47% of all traffic was estimated to be from automated bots. [6]

Traffic management

Internet Connectivity Distribution & Core.svg

Internet traffic management, also known as application traffic management. The Internet does not employ any formally centralized facilities for traffic management. Its progenitor networks, especially the ARPANET established an early backbone infrastructure which carried traffic between major interchange centers for traffic, resulting in a tiered, hierarchical system of internet service providers (ISPs) within which the tier 1 networks provided traffic exchange through settlement-free peering and routing of traffic to lower-level tiers of ISPs. The dynamic growth of the worldwide network resulted in ever-increasing interconnections at all peering levels of the Internet, so a robust system was developed that could mediate link failures, bottlenecks, and other congestion at many levels.[ citation needed ]

Economic traffic management (ETM) is the term that is sometimes used to point out the opportunities for seeding as a practice that caters to contribution within peer-to-peer file sharing and the distribution of content in the digital world in general. [7]

Internet use tax

A planned tax on Internet use in Hungary introduced a 150-forint (US$0.62, €0.47) tax per gigabyte of data traffic, in a move intended to reduce Internet traffic and also assist companies to offset corporate income tax against the new levy. [8] Hungary achieved 1.15 billion gigabytes in 2013 and another 18 million gigabytes accumulated by mobile devices. This would have resulted in extra revenue of 175 billion forints under the new tax based on the consultancy firm eNet. [8]

According to Yahoo News, economy minister Mihály Varga defended the move saying "the tax was fair as it reflected a shift by consumers to the Internet away from phone lines" and that "150 forints on each transferred gigabyte of data – was needed to plug holes in the 2015 budget of one of the EU's most indebted nations". [9] [10]

Some people argue that the new plan on Internet tax would prove disadvantageous to the country's economic development, limit access to information and hinder the freedom of expression. [11] Approximately 36,000 people have signed up to take part in an event on Facebook to be held outside the Economy Ministry to protest against the possible tax. [9]

Traffic classification

Traffic classification describes the methods of classifying traffic by observing features passively in the traffic and line with particular classification goals. There might be some that only have a vulgar classification goal. For example, whether it is bulk transfer, peer-to-peer file-sharing, or transaction-orientated. Some others will set a finer-grained classification goal, for instance, the exact number of applications represented by the traffic. Traffic features included port number, application payload, temporal, packet size, and the characteristic of the traffic. There is a vast range of methods to allocate Internet traffic including exact traffic, for instance, port (computer networking) number, payload, heuristic, or statistical machine learning.

Accurate network traffic classification is elementary to quite a few Internet activities, from security monitoring to accounting and from the quality of service to providing operators with useful forecasts for long-term provisioning. Yet, classification schemes are extremely complex to operate accurately due to the shortage of available knowledge of the network. For example, the packet header-related information is always insufficient to allow for a precise methodology.

Bayesian analysis techniques

Work [12] involving supervised machine learning to classify network traffic. Data are hand-classified (based upon flow content) to one of a number of categories. A combination of data set (hand-assigned) category and descriptions of the classified flows (such as flow length, port numbers, time between consecutive flows) are used to train the classifier. To give a better insight of the technique itself, initial assumptions are made as well as applying two other techniques in reality. One is to improve the quality and separation of the input of information leading to an increase in accuracy of the Naive Bayes classifier technique.

The basis of categorizing work is to classify the type of Internet traffic; this is done by putting common groups of applications into different categories, e.g., "normal" versus "malicious", or more complex definitions, e.g., the identification of specific applications or specific Transmission Control Protocol (TCP) implementations. [13] Adapted from Logg et al. [14]

Survey

Traffic classification is a major component of automated intrusion detection systems. [15] [16] They are used to identify patterns as well as an indication of network resources for priority customers, or to identify customer use of network resources that in some way contravenes the operator's terms of service. Generally deployed Internet Protocol (IP) traffic classification techniques are based approximately on a direct inspection of each packet's contents at some point on the network. Source address, port and destination address are included in successive IP packets with similar if not the same 5-tuple of protocol type. ort are considered to belong to a flow whose controlling application we wish to determine. Simple classification infers the controlling application's identity by assuming that most applications consistently use well-known TCP or UDP port numbers. Even though, many candidates are increasingly using unpredictable port numbers. As a result, more sophisticated classification techniques infer application types by looking for application-specific data within the TCP or User Datagram Protocol (UDP) payloads. [17]

Global Internet traffic

Aggregating from multiple sources and applying usage and bitrate assumptions, Cisco, a major network systems company, has published the following historical Internet Protocol (IP) and Internet traffic figures: [18]

Global Internet traffic by year
 
Year
IP Traffic
(PB/month)
Fixed Internet traffic
(PB/month)
Mobile Internet traffic
(PB/month)
19900.0010.001n/a
19910.0020.002n/a
19920.0050.004n/a
19930.01  0.01  n/a
19940.02  0.02  n/a
19950.18  0.17  n/a
19961.9    1.8    n/a
19975.4    5.0    n/a
199812      11      n/a
199928      26      n/a
200084      75      n/a
2001197      175      n/a
2002405      356      n/a
2003784      681      n/a
20041,477      1,267      n/a
20052,426      2,055      0.9   
20063,992      3,339      4      
20076,430      5,219      15      
2008 [19] 10,174      8,140      33      
2009 [20] 14,686      10,942      91      
2010 [21] 20,151      14,955      237      
2011 [22] 30,734      23,288      597      
2012 [23] [24] 43,570      31,339      885      
2013 [25] 51,168      34,952      1,480      
2014 [26] 59,848      39,909      2,514      
2015 [27] 72,521      49,494      3,685      
2016 [28] 96,054      65,942      7,201      
2017 [29] 122,000      85,000      12,000      

"Fixed Internet traffic" refers perhaps to traffic from residential and commercial subscribers to ISPs, cable companies, and other service providers. "Mobile Internet traffic" refers perhaps to backhaul traffic from cellphone towers and providers. The overall "Internet traffic" figures, which can be 30% higher than the sum of the other two, perhaps factors in traffic in the core of the national backbone, whereas the other figures seem to be derived principally from the network periphery.

Cisco also publishes 5-year projections.

Predicted global Internet traffic by year [29]
 
Year
Fixed Internet traffic
(EB/month)
Mobile Internet traffic
(EB/month)
201810719
201913729
202017441
202121957
202227377

Internet backbone traffic in the United States

The following data for the Internet backbone in the US comes from the Minnesota Internet Traffic Studies (MINTS): [30]

US Internet backbone traffic by year
YearData (TB/month)
19901
19912
19924
19938
199416
1995n/a
19961,500
19972,5004,000
19985,0008,000
199910,00016,000
200020,00035,000
200140,00070,000
200280,000140,000
2003n/a
2004n/a
2005n/a
2006450,000800,000
2007750,0001,250,000
20081,200,0001,800,000
20091,900,0002,400,000
20102,600,0003,100,000
20113,400,0004,100,000

The Cisco data can be seven times higher than the Minnesota Internet Traffic Studies (MINTS) data not only because the Cisco figures are estimates for the global—not just the domestic US—Internet, but also because Cisco counts "general IP traffic (thus including closed networks that are not truly part of the Internet, but use IP, the Internet Protocol, such as the IPTV services of various telecom firms)". [31] The MINTS estimate of US national backbone traffic for 2004, which may be interpolated as 200 petabytes/month, is a plausible three-fold multiple of the traffic of the US's largest backbone carrier, Level(3) Inc., which claims an average traffic level of 60 petabytes/month. [32]

Edholm's law

In the past Internet bandwidth in telecommunications networks doubled every 18 months, an observation expressed as Edholm's law. [33] This follows the advances in semiconductor technology, such as metal-oxide-silicon (MOS) scaling, exemplified by the MOSFET transistor, which has shown similar scaling described by Moore's law. In the 1980s, fiber-optical technology using laser light as information carriers accelerated the transmission speed and bandwidth of telecommunication circuits. This has led to the bandwidths of communication networks achieving terabit per second transmission speeds. [34]

See also

Related Research Articles

The Internet protocol suite, commonly known as TCP/IP, is a framework for organizing the set of communication protocols used in the Internet and similar computer networks according to functional criteria. The foundational protocols in the suite are the Transmission Control Protocol (TCP), the User Datagram Protocol (UDP), and the Internet Protocol (IP). Early versions of this networking model were known as the Department of Defense (DoD) model because the research and development were funded by the United States Department of Defense through DARPA.

Quality of service (QoS) is the description or measurement of the overall performance of a service, such as a telephony or computer network, or a cloud computing service, particularly the performance seen by the users of the network. To quantitatively measure quality of service, several related aspects of the network service are often considered, such as packet loss, bit rate, throughput, transmission delay, availability, jitter, etc.

<span class="mw-page-title-main">Router (computing)</span> Device that forwards data packets between computer networks

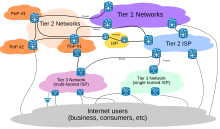
A router is a networking device that forwards data packets between computer networks. Routers perform the traffic directing functions between networks and on the global Internet. Data sent through a network, such as a web page or email, is in the form of data packets. A packet is typically forwarded from one router to another router through the networks that constitute an internetwork until it reaches its destination node.

<span class="mw-page-title-main">Frame Relay</span> Wide area network technology

Frame Relay is a standardized wide area network (WAN) technology that specifies the physical and data link layers of digital telecommunications channels using a packet switching methodology. Originally designed for transport across Integrated Services Digital Network (ISDN) infrastructure, it may be used today in the context of many other network interfaces.

Open Shortest Path First (OSPF) is a routing protocol for Internet Protocol (IP) networks. It uses a link state routing (LSR) algorithm and falls into the group of interior gateway protocols (IGPs), operating within a single autonomous system (AS).

<span class="mw-page-title-main">Network address translation</span> Protocol facilitating connection of one IP address space to another

Network address translation (NAT) is a method of mapping an IP address space into another by modifying network address information in the IP header of packets while they are in transit across a traffic routing device. The technique was originally used to bypass the need to assign a new address to every host when a network was moved, or when the upstream Internet service provider was replaced, but could not route the network's address space. It has become a popular and essential tool in conserving global address space in the face of IPv4 address exhaustion. One Internet-routable IP address of a NAT gateway can be used for an entire private network.

Traffic shaping is a bandwidth management technique used on computer networks which delays some or all datagrams to bring them into compliance with a desired traffic profile. Traffic shaping is used to optimize or guarantee performance, improve latency, or increase usable bandwidth for some kinds of packets by delaying other kinds. It is often confused with traffic policing, the distinct but related practice of packet dropping and packet marking.

Network congestion in data networking and queueing theory is the reduced quality of service that occurs when a network node or link is carrying more data than it can handle. Typical effects include queueing delay, packet loss or the blocking of new connections. A consequence of congestion is that an incremental increase in offered load leads either only to a small increase or even a decrease in network throughput.

Deep packet inspection (DPI) is a type of data processing that inspects in detail the data being sent over a computer network, and may take actions such as alerting, blocking, re-routing, or logging it accordingly. Deep packet inspection is often used for baselining application behavior, analyzing network usage, troubleshooting network performance, ensuring that data is in the correct format, checking for malicious code, eavesdropping, and internet censorship, among other purposes. There are multiple headers for IP packets; network equipment only needs to use the first of these for normal operation, but use of the second header is normally considered to be shallow packet inspection despite this definition.

Class-based queuing (CBQ) is a queuing discipline for the network scheduler that allows traffic to share bandwidth equally, after being grouped by classes. The classes can be based upon a variety of parameters, such as priority, interface, or originating program.

<span class="mw-page-title-main">NetFlow</span> Communications protocol

NetFlow is a feature that was introduced on Cisco routers around 1996 that provides the ability to collect IP network traffic as it enters or exits an interface. By analyzing the data provided by NetFlow, a network administrator can determine things such as the source and destination of traffic, class of service, and the causes of congestion. A typical flow monitoring setup consists of three main components:

<span class="mw-page-title-main">Link aggregation</span> Using multiple network connections in parallel to increase capacity and reliability

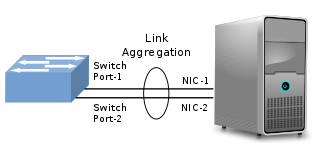
In computer networking, link aggregation is the combining of multiple network connections in parallel by any of several methods. Link aggregation increases total throughput beyond what a single connection could sustain, and provides redundancy where all but one of the physical links may fail without losing connectivity. A link aggregation group (LAG) is the combined collection of physical ports.

A middlebox is a computer networking device that transforms, inspects, filters, and manipulates traffic for purposes other than packet forwarding. Examples of middleboxes include firewalls, network address translators (NATs), load balancers, and deep packet inspection (DPI) devices.

Bandwidth management is the process of measuring and controlling the communications on a network link, to avoid filling the link to capacity or overfilling the link, which would result in network congestion and poor performance of the network. Bandwidth is described by bit rate and measured in units of bits per second (bit/s) or bytes per second (B/s).

WAN optimization is a collection of techniques for improving data transfer across wide area networks (WANs). In 2008, the WAN optimization market was estimated to be $1 billion, and was to grow to $4.4 billion by 2014 according to Gartner, a technology research firm. In 2015 Gartner estimated the WAN optimization market to be a $1.1 billion market.

The Skype protocol is a proprietary Internet telephony network used by Skype. The protocol's specifications have not been made publicly available by Skype and official applications using the protocol are closed-source.

In computing, Microsoft's Windows Vista and Windows Server 2008 introduced in 2007/2008 a new networking stack named Next Generation TCP/IP stack, to improve on the previous stack in several ways. The stack includes native implementation of IPv6, as well as a complete overhaul of IPv4. The new TCP/IP stack uses a new method to store configuration settings that enables more dynamic control and does not require a computer restart after a change in settings. The new stack, implemented as a dual-stack model, depends on a strong host-model and features an infrastructure to enable more modular components that one can dynamically insert and remove.

Data center bridging (DCB) is a set of enhancements to the Ethernet local area network communication protocol for use in data center environments, in particular for use with clustering and storage area networks.

Traffic classification is an automated process which categorises computer network traffic according to various parameters into a number of traffic classes. Each resulting traffic class can be treated differently in order to differentiate the service implied for the data generator or consumer.

cFosSpeed is a traffic shaping software often bundled with MSI motherboards for the Windows operating system. The program attaches itself as a device driver to the Windows network stack where it performs packet inspection and layer-7 protocol analysis. It has been noted as causing some issues with network connections, and can be difficult to uninstall when bundled.

References

  1. Kar, Ayushi (2022-12-04). "End of American internet, India-China contribute to 50% of world's data traffic". www.thehindubusinessline.com. Retrieved 2022-12-24.
  2. "Data volume of global file sharing traffic from 2013 until 2018". Statista. 2014. Retrieved 18 October 2014.
  3. Paul Resenikoff (12 November 2013). "File-Sharing Now Accounts for Less Than 10% of US Internet Traffic..." Retrieved 18 October 2014.
  4. "In 2022, 65% of all internet traffic came from video sites". 20 January 2023.
  5. "An explosion of online video could triple bandwidth consumption again in the next five years". 8 June 2017.
  6. "47% of all internet traffic came from bots in 2022 | Security Magazine".
  7. Despotovic, Z., Hossfeld, T., Kellerer, W., Lehrieder, F., Oechsner, S., Michel, M. (2011). Mitigating Unfairness In Locality-Aware Peer-To-Peer Networks. International Journal of Network Management
  8. 1 2 Marton Dunai (2014). "Hungary plans new tax on Internet traffic, public calls for rally".
  9. 1 2 "Anger mounts in Hungary over internet tax". Yahoo News. 25 October 2014. Retrieved 18 October 2014.
  10. Scott, Benjamin. "Best Traffic Bot" . Retrieved 27 December 2023.
  11. Margit Feher (2014). "Public outrage mounts against hunger's plan to tax internet use" . Retrieved 18 October 2014.
  12. Denis Zuev (2013). "Internet traffic classification using bayesian analysis technique" (PDF). Retrieved 18 October 2014.
  13. J.Padhye; S.Floyd (June 2001). "Identifying the TCP Behavior of Web Servers". In Proceedings of SIGCOMM 2011, San Diego, CA.
  14. C.Logg; L.Cottrell (2003). "SLAC National Accelerator Laboratory". Archived from the original on June 13, 2008. Retrieved 21 October 2014.
  15. Bro intrusion detection system – Bro overview, http://bro-ids.org, as of August 14, 2007.
  16. V. Paxson, 'Bro: A system for detecting network intruders in real-time,' Computer Networks, no.31 (23-24), pp. 2435-2463, 1999
  17. S. Sen., O. Spats check, and D. Wang, 'Accurate, scalable in network identification of P2P traffic using application signatures,' in WWW2004, New York, NY, US, May 2004.
  18. "Visual Networking Index", Cisco Systems
  19. Cisco, "Cisco Visual Networking Index: Forecast and Methodology, 2008–2013" (PDF), 9 June 2009. Retrieved 13 June 2016
  20. Cisco, "Cisco Visual Networking Index: Forecast and Methodology, 2009–2014" (PDF), 2 June 2010. Retrieved 13 June 2016
  21. Cisco, "Cisco Visual Networking Index: Forecast and Methodology, 2010–2015" (PDF), 1 June 2011. Retrieved 13 June 2016
  22. Cisco, "Cisco Visual Networking Index: Forecast and Methodology, 2011–2016 Archived 2020-08-09 at the Wayback Machine " (PDF), 30 May 2012. Retrieved 13 June 2016
  23. Cisco, "Cisco Visual Networking Index: Global Mobile Data Traffic Forecast Update, 2012–2017 Archived 2016-08-12 at the Wayback Machine " (PDF), 2 Feb 2013. Retrieved 13 June 2016
  24. Cisco, "Cisco Visual Networking Index: Forecast and Methodology, 2012–2017" (PDF), 29 May 2013. Retrieved from archive.org, 28 Aug 2016
  25. Cisco, "Cisco Visual Networking Index: Forecast and Methodology, 2013–2018" (PDF), 10 Jun 2014. Retrieved from archive.org, 28 Aug 2016
  26. Cisco, "Cisco Visual Networking Index: Forecast and Methodology, 2014–2019" (PDF), 27 May 2015. Retrieved from archive.org, 28 Aug 2016
  27. Cisco, "Cisco Visual Networking Index:Forecast and Methodology, 2015–2020" (PDF) 6 June 2016. Retrieved 13 June 2016
  28. Cisco, "Cisco Visual Networking Index:Forecast and Methodology, 2016–2021" (PDF) 6 June 2017. Retrieved 14 August 2017
  29. 1 2 Cisco, "Cisco Visual Networking Index:Forecast and Trends, 2017–2022" (PDF) 28 November 2018. Retrieved 9 January 2019
  30. Minnesota Internet Traffic Studies (MINTS) Archived 2017-12-28 at the Wayback Machine , University of Minnesota
  31. "MINTS - Minnesota Internet Traffic Studies" . Retrieved 16 April 2017.
  32. 2004 Annual Report, Level(3), April 2005, p.1
  33. Cherry, Steven (2004). "Edholm's law of bandwidth". IEEE Spectrum. 41 (7): 58–60. doi:10.1109/MSPEC.2004.1309810. S2CID   27580722.
  34. Jindal, R. P. (2009). "From millibits to terabits per second and beyond - over 60 years of innovation". 2009 2nd International Workshop on Electron Devices and Semiconductor Technology. pp. 1–6. doi:10.1109/EDST.2009.5166093. ISBN   978-1-4244-3831-0. S2CID   25112828.

Further reading