Inverse distribution

Last updated

In probability theory and statistics, an inverse distribution is the distribution of the reciprocal of a random variable. Inverse distributions arise in particular in the Bayesian context of prior distributions and posterior distributions for scale parameters. In the algebra of random variables, inverse distributions are special cases of the class of ratio distributions, in which the numerator random variable has a degenerate distribution.

Contents

Relation to original distribution

In general, given the probability distribution of a random variable X with strictly positive support, it is possible to find the distribution of the reciprocal, Y = 1 / X. If the distribution of X is continuous with density function f(x) and cumulative distribution function F(x), then the cumulative distribution function, G(y), of the reciprocal is found by noting that

Then the density function of Y is found as the derivative of the cumulative distribution function:

Examples

Reciprocal distribution

The reciprocal distribution has a density function of the form [1]

where means "is proportional to". It follows that the inverse distribution in this case is of the form

which is again a reciprocal distribution.

Inverse uniform distribution

Inverse uniform distribution
Parameters
Support
PDF
CDF
Mean
Median
Variance

If the original random variable X is uniformly distributed on the interval (a,b), where a>0, then the reciprocal variable Y = 1 / X has the reciprocal distribution which takes values in the range (b−1 ,a−1), and the probability density function in this range is

and is zero elsewhere.

The cumulative distribution function of the reciprocal, within the same range, is

For example, if X is uniformly distributed on the interval (0,1), then Y = 1 / X has density and cumulative distribution function when

Inverse t distribution

Let X be a t distributed random variate with k degrees of freedom. Then its density function is

The density of Y = 1 / X is

With k = 1, the distributions of X and 1 / X are identical (X is then Cauchy distributed (0,1)). If k > 1 then the distribution of 1 / X is bimodal.[ citation needed ]

Reciprocal normal distribution

If variable follows a normal distribution , then the inverse or reciprocal follows a reciprocal normal distribution: [2]

Graph of the density of the inverse of the standard normal distribution Graph of inverse of the normal distribution.png
Graph of the density of the inverse of the standard normal distribution

If variable X follows a standard normal distribution , then Y = 1/X follows a reciprocal standard normal distribution, heavy-tailed and bimodal, [2] with modes at and density

and the first and higher-order moments do not exist. [2] For such inverse distributions and for ratio distributions, there can still be defined probabilities for intervals, which can be computed either by Monte Carlo simulation or, in some cases, by using the Geary–Hinkley transformation. [3]

However, in the more general case of a shifted reciprocal function , for following a general normal distribution, then mean and variance statistics do exist in a principal value sense, if the difference between the pole and the mean is real-valued. The mean of this transformed random variable (reciprocal shifted normal distribution) is then indeed the scaled Dawson's function: [4]

In contrast, if the shift is purely complex, the mean exists and is a scaled Faddeeva function, whose exact expression depends on the sign of the imaginary part, . In both cases, the variance is a simple function of the mean. [5] Therefore, the variance has to be considered in a principal value sense if is real, while it exists if the imaginary part of is non-zero. Note that these means and variances are exact, as they do not recur to linearisation of the ratio. The exact covariance of two ratios with a pair of different poles and is similarly available. [6] The case of the inverse of a complex normal variable , shifted or not, exhibits different characteristics. [4]

Inverse exponential distribution

If is an exponentially distributed random variable with rate parameter , then has the following cumulative distribution function: for . Note that the expected value of this random variable does not exist. The reciprocal exponential distribution finds use in the analysis of fading wireless communication systems.

Inverse Cauchy distribution

If X is a Cauchy distributed (μ, σ) random variable, then 1 / X is a Cauchy ( μ / C, σ / C ) random variable where C = μ2 + σ2.

Inverse F distribution

If X is an F(ν1, ν2 ) distributed random variable then 1 / X is an F(ν2, ν1 ) random variable.

Reciprocal of binomial distribution

If is distributed according to a Binomial distribution with number of trials and a probability of success then no closed form for the reciprocal distribution is known. However, we can calculate the mean of this distribution.


An asymptotic approximation for the non-central moments of the reciprocal distribution is known. [7]

where O() and o() are the big and little o order functions and is a real number.

Reciprocal of triangular distribution

For a triangular distribution with lower limit a, upper limit b and mode c, where a < b and a  c  b, the mean of the reciprocal is given by

and the variance by

.

Both moments of the reciprocal are only defined when the triangle does not cross zero, i.e. when a, b, and c are either all positive or all negative.

Other inverse distributions

Other inverse distributions include

inverse-chi-squared distribution
inverse-gamma distribution
inverse-Wishart distribution
inverse matrix gamma distribution

Applications

Inverse distributions are widely used as prior distributions in Bayesian inference for scale parameters.

See also

Related Research Articles

<span class="mw-page-title-main">Normal distribution</span> Probability distribution

In statistics, a normal distribution or Gaussian distribution is a type of continuous probability distribution for a real-valued random variable. The general form of its probability density function is

In probability theory, the central limit theorem (CLT) establishes that, in many situations, for independent and identically distributed random variables, the sampling distribution of the standardized sample mean tends towards the standard normal distribution even if the original variables themselves are not normally distributed.

<span class="mw-page-title-main">Multivariate normal distribution</span> Generalization of the one-dimensional normal distribution to higher dimensions

In probability theory and statistics, the multivariate normal distribution, multivariate Gaussian distribution, or joint normal distribution is a generalization of the one-dimensional (univariate) normal distribution to higher dimensions. One definition is that a random vector is said to be k-variate normally distributed if every linear combination of its k components has a univariate normal distribution. Its importance derives mainly from the multivariate central limit theorem. The multivariate normal distribution is often used to describe, at least approximately, any set of (possibly) correlated real-valued random variables each of which clusters around a mean value.

<span class="mw-page-title-main">Log-normal distribution</span> Probability distribution

In probability theory, a log-normal (or lognormal) distribution is a continuous probability distribution of a random variable whose logarithm is normally distributed. Thus, if the random variable X is log-normally distributed, then Y = ln(X) has a normal distribution. Equivalently, if Y has a normal distribution, then the exponential function of Y, X = exp(Y), has a log-normal distribution. A random variable which is log-normally distributed takes only positive real values. It is a convenient and useful model for measurements in exact and engineering sciences, as well as medicine, economics and other topics (e.g., energies, concentrations, lengths, prices of financial instruments, and other metrics).

In probability theory, Chebyshev's inequality guarantees that, for a wide class of probability distributions, no more than a certain fraction of values can be more than a certain distance from the mean. Specifically, no more than 1/k2 of the distribution's values can be k or more standard deviations away from the mean. The rule is often called Chebyshev's theorem, about the range of standard deviations around the mean, in statistics. The inequality has great utility because it can be applied to any probability distribution in which the mean and variance are defined. For example, it can be used to prove the weak law of large numbers.

<span class="mw-page-title-main">Rayleigh distribution</span> Probability distribution

In probability theory and statistics, the Rayleigh distribution is a continuous probability distribution for nonnegative-valued random variables. Up to rescaling, it coincides with the chi distribution with two degrees of freedom. The distribution is named after Lord Rayleigh.

<span class="mw-page-title-main">Logistic distribution</span> Continuous probability distribution

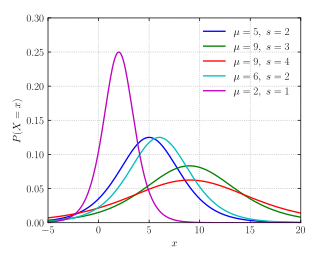
In probability theory and statistics, the logistic distribution is a continuous probability distribution. Its cumulative distribution function is the logistic function, which appears in logistic regression and feedforward neural networks. It resembles the normal distribution in shape but has heavier tails. The logistic distribution is a special case of the Tukey lambda distribution.

In statistics, propagation of uncertainty is the effect of variables' uncertainties on the uncertainty of a function based on them. When the variables are the values of experimental measurements they have uncertainties due to measurement limitations which propagate due to the combination of variables in the function.

<span class="mw-page-title-main">Lévy distribution</span>

In probability theory and statistics, the Lévy distribution, named after Paul Lévy, is a continuous probability distribution for a non-negative random variable. In spectroscopy, this distribution, with frequency as the dependent variable, is known as a van der Waals profile. It is a special case of the inverse-gamma distribution. It is a stable distribution.

In probability theory and statistics, the generalized extreme value (GEV) distribution is a family of continuous probability distributions developed within extreme value theory to combine the Gumbel, Fréchet and Weibull families also known as type I, II and III extreme value distributions. By the extreme value theorem the GEV distribution is the only possible limit distribution of properly normalized maxima of a sequence of independent and identically distributed random variables. Note that a limit distribution needs to exist, which requires regularity conditions on the tail of the distribution. Despite this, the GEV distribution is often used as an approximation to model the maxima of long (finite) sequences of random variables.

<span class="mw-page-title-main">Continuous uniform distribution</span> Uniform distribution on an interval

In probability theory and statistics, the continuous uniform distributions or rectangular distributions are a family of symmetric probability distributions. Such a distribution describes an experiment where there is an arbitrary outcome that lies between certain bounds. The bounds are defined by the parameters, and which are the minimum and maximum values. The interval can either be closed or open. Therefore, the distribution is often abbreviated where stands for uniform distribution. The difference between the bounds defines the interval length; all intervals of the same length on the distribution's support are equally probable. It is the maximum entropy probability distribution for a random variable under no constraint other than that it is contained in the distribution's support.

<span class="mw-page-title-main">Rice distribution</span> Probability distribution

In probability theory, the Rice distribution or Rician distribution is the probability distribution of the magnitude of a circularly-symmetric bivariate normal random variable, possibly with non-zero mean (noncentral). It was named after Stephen O. Rice (1907–1986).

<span class="mw-page-title-main">Chi distribution</span> Probability distribution

In probability theory and statistics, the chi distribution is a continuous probability distribution over the non-negative real line. It is the distribution of the positive square root of a sum of squared independent Gaussian random variables. Equivalently, it is the distribution of the Euclidean distance between a multivariate Gaussian random variable and the origin. It is thus related to the chi-squared distribution by describing the distribution of the positive square roots of a variable obeying a chi-squared distribution.

In probability theory, calculation of the sum of normally distributed random variables is an instance of the arithmetic of random variables.

Noncentral <i>t</i>-distribution Probability distribution

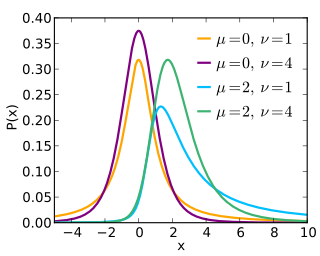
The noncentral t-distribution generalizes Student's t-distribution using a noncentrality parameter. Whereas the central probability distribution describes how a test statistic t is distributed when the difference tested is null, the noncentral distribution describes how t is distributed when the null is false. This leads to its use in statistics, especially calculating statistical power. The noncentral t-distribution is also known as the singly noncentral t-distribution, and in addition to its primary use in statistical inference, is also used in robust modeling for data.

<span class="mw-page-title-main">Inverse Gaussian distribution</span> Family of continuous probability distributions

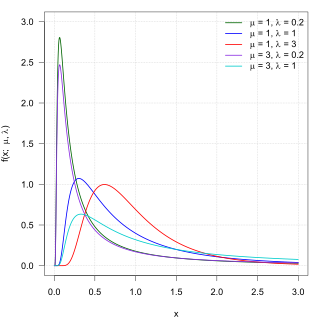
In probability theory, the inverse Gaussian distribution is a two-parameter family of continuous probability distributions with support on (0,∞).

A ratio distribution is a probability distribution constructed as the distribution of the ratio of random variables having two other known distributions. Given two random variables X and Y, the distribution of the random variable Z that is formed as the ratio Z = X/Y is a ratio distribution.

<span class="mw-page-title-main">Half-normal distribution</span> Probability distribution

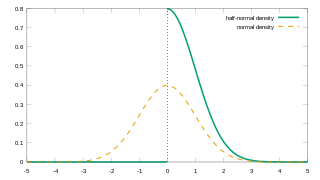
In probability theory and statistics, the half-normal distribution is a special case of the folded normal distribution.

<span class="mw-page-title-main">Normal-inverse-gamma distribution</span>

In probability theory and statistics, the normal-inverse-gamma distribution is a four-parameter family of multivariate continuous probability distributions. It is the conjugate prior of a normal distribution with unknown mean and variance.

<span class="mw-page-title-main">Logit-normal distribution</span>

In probability theory, a logit-normal distribution is a probability distribution of a random variable whose logit has a normal distribution. If Y is a random variable with a normal distribution, and t is the standard logistic function, then X = t(Y) has a logit-normal distribution; likewise, if X is logit-normally distributed, then Y = logit(X)= log (X/(1-X)) is normally distributed. It is also known as the logistic normal distribution, which often refers to a multinomial logit version (e.g.).

References

  1. Hamming R. W. (1970) "On the distribution of numbers", The Bell System Technical Journal 49(8) 1609–1625
  2. 1 2 3 Johnson, Norman L.; Kotz, Samuel; Balakrishnan, Narayanaswamy (1994). Continuous Univariate Distributions, Volume 1. Wiley. p. 171. ISBN   0-471-58495-9.
  3. Hayya, Jack; Armstrong, Donald; Gressis, Nicolas (July 1975). "A Note on the Ratio of Two Normally Distributed Variables". Management Science . 21 (11): 1338–1341. doi:10.1287/mnsc.21.11.1338. JSTOR   2629897.
  4. 1 2 Lecomte, Christophe (May 2013). "Exact statistics of systems with uncertainties: an analytical theory of rank-one stochastic dynamic systems". Journal of Sound and Vibration. 332 (11): 2750–2776. doi:10.1016/j.jsv.2012.12.009.
  5. Lecomte, Christophe (May 2013). "Exact statistics of systems with uncertainties: an analytical theory of rank-one stochastic dynamic systems". Journal of Sound and Vibration. 332 (11). Section (4.1.1). doi:10.1016/j.jsv.2012.12.009.
  6. Lecomte, Christophe (May 2013). "Exact statistics of systems with uncertainties: an analytical theory of rank-one stochastic dynamic systems". Journal of Sound and Vibration. 332 (11). Eq.(39)-(40). doi:10.1016/j.jsv.2012.12.009.
  7. Cribari-Neto F, Lopes Garcia N, Vasconcellos KLP (2000) A note on inverse moments of binomial variates. Brazilian Review of Econometrics 20 (2)