
Global warming potential (GWP) is a measure of how much infrared thermal radiation a greenhouse gas added to the atmosphere would absorb over a given time frame, as a multiple of the radiation that would be absorbed by the same mass of added carbon dioxide. GWP is 1 for CO2. For other gases it depends on how strongly the gas absorbs infrared thermal radiation, how quickly the gas leaves the atmosphere, and the time frame being considered. The carbon dioxide equivalent is calculated from GWP. For any gas, it is the mass of CO2 that would warm the earth as much as the mass of that gas. Thus it provides a common scale for measuring the climate effects of different gases. It is calculated as GWP times mass of the other gas.

I = (PAT) is the mathematical notation of a formula put forward to describe the impact of human activity on the environment.
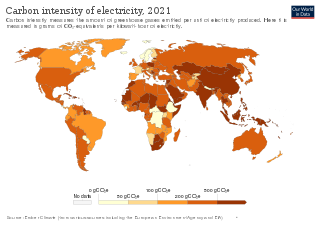
An emission intensity is the emission rate of a given pollutant relative to the intensity of a specific activity, or an industrial production process; for example grams of carbon dioxide released per megajoule of energy produced, or the ratio of greenhouse gas emissions produced to gross domestic product (GDP). Emission intensities are used to derive estimates of air pollutant or greenhouse gas emissions based on the amount of fuel combusted, the number of animals in animal husbandry, on industrial production levels, distances traveled or similar activity data. Emission intensities may also be used to compare the environmental impact of different fuels or activities. In some case the related terms emission factor and carbon intensity are used interchangeably. The jargon used can be different, for different fields/industrial sectors; normally the term "carbon" excludes other pollutants, such as particulate emissions. One commonly used figure is carbon intensity per kilowatt-hour (CIPK), which is used to compare emissions from different sources of electrical power.
The Special Report on Emissions Scenarios (SRES) is a report by the Intergovernmental Panel on Climate Change (IPCC) that was published in 2000. The greenhouse gas emissions scenarios described in the Report have been used to make projections of possible future climate change. The SRES scenarios, as they are often called, were used in the IPCC Third Assessment Report (TAR), published in 2001, and in the IPCC Fourth Assessment Report (AR4), published in 2007. The SRES scenarios were designed to improve upon some aspects of the IS92 scenarios, which had been used in the earlier IPCC Second Assessment Report of 1995. The SRES scenarios are "baseline" scenarios, which means that they do not take into account any current or future measures to limit greenhouse gas (GHG) emissions.
The economic analysis of climate change explains how economic thinking, tools and techniques are applied to calculate the magnitude and distribution of damage caused by climate change. It also informs the policies and approaches for mitigation and adaptation to climate change from global to household scales. This topic is also inclusive of alternative economic approaches, including ecological economics and degrowth.
Climate Change 2007, the Fourth Assessment Report (AR4) of the United Nations Intergovernmental Panel on Climate Change (IPCC), was published in 2007 and is the fourth in a series of reports intended to assess scientific, technical and socio-economic information concerning climate change, its potential effects, and options for adaptation and mitigation. The report is the largest and most detailed summary of the climate change situation ever undertaken, produced by thousands of authors, editors, and reviewers from dozens of countries, citing over 6,000 peer-reviewed scientific studies. People from over 130 countries contributed to the IPCC Fourth Assessment Report, which took six years to produce. Contributors to AR4 included more than 2,500 scientific expert reviewers, more than 800 contributing authors, and more than 450 lead authors.

Biomass, in the context of energy production, is matter from recently living organisms which is used for bioenergy production. Examples include wood, wood residues, energy crops, agricultural residues including straw, and organic waste from industry and households. Wood and wood residues is the largest biomass energy source today. Wood can be used as a fuel directly or processed into pellet fuel or other forms of fuels. Other plants can also be used as fuel, for instance maize, switchgrass, miscanthus and bamboo. The main waste feedstocks are wood waste, agricultural waste, municipal solid waste, and manufacturing waste. Upgrading raw biomass to higher grade fuels can be achieved by different methods, broadly classified as thermal, chemical, or biochemical.

Greenhouse gas emissions from human activities strengthen the greenhouse effect, contributing to climate change. Most is carbon dioxide from burning fossil fuels: coal, oil, and natural gas. The largest emitters include coal in China and large oil and gas companies. Human-caused emissions have increased atmospheric carbon dioxide by about 50% over pre-industrial levels. The growing levels of emissions have varied, but have been consistent among all greenhouse gases. Emissions in the 2010s averaged 56 billion tons a year, higher than any decade before. Total cumulative emissions from 1870 to 2017 were 425±20 GtC from fossil fuels and industry, and 180±60 GtC from land use change. Land-use change, such as deforestation, caused about 31% of cumulative emissions over 1870–2017, coal 32%, oil 25%, and gas 10%.
This is a list of climate change topics.

The economics of climate change mitigation is part of the economics of climate change related to climate change mitigation, that is actions that are designed to limit the amount of long-term climate change. Mitigation may be achieved through the reduction of greenhouse gas (GHG) emissions and the enhancement of sinks that absorb GHGs, for example forests.
The Kyoto Protocol was an international treaty which extended the 1992 United Nations Framework Convention on Climate Change. A number of governments across the world took a variety of actions.

Climate change scenarios or socioeconomic scenarios are projections of future greenhouse gas (GHG) emissions used by analysts to assess future vulnerability to climate change. Scenarios and pathways are created by scientists to survey any long term routes and explore the effectiveness of mitigation and helps us understand what the future may hold this will allow us to envision the future of human environment system. Producing scenarios requires estimates of future population levels, economic activity, the structure of governance, social values, and patterns of technological change. Economic and energy modelling can be used to analyze and quantify the effects of such drivers.

In economic and environmental fields, decoupling refers to an economy that would be able to grow without corresponding increases in environmental pressure. In many economies, increasing production (GDP) raises pressure on the environment. An economy that would be able to sustain economic growth while reducing the amount of resources such as water or fossil fuels used and delink environmental deterioration at the same time would be said to be decoupled. Environmental pressure is often measured using emissions of pollutants, and decoupling is often measured by the emission intensity of economic output.
The Special Report on Global Warming of 1.5 °C (SR15) was published by the Intergovernmental Panel on Climate Change (IPCC) on 8 October 2018. The report, approved in Incheon, South Korea, includes over 6,000 scientific references, and was prepared by 91 authors from 40 countries. In December 2015, the 2015 United Nations Climate Change Conference called for the report. The report was delivered at the United Nations' 48th session of the IPCC to "deliver the authoritative, scientific guide for governments" to deal with climate change. Its key finding is that meeting a 1.5 °C (2.7 °F) target is possible but would require "deep emissions reductions" and "rapid, far-reaching and unprecedented changes in all aspects of society". Furthermore, the report finds that "limiting global warming to 1.5 °C compared with 2 °C would reduce challenging impacts on ecosystems, human health and well-being" and that a 2 °C temperature increase would exacerbate extreme weather, rising sea levels and diminishing Arctic sea ice, coral bleaching, and loss of ecosystems, among other impacts.

Shared Socioeconomic Pathways (SSPs) are scenarios of projected socioeconomic global changes up to 2100. They are used to derive greenhouse gas emissions scenarios with different climate policies.

Climate change in India is having profound effects on India, which is ranked fourth among the list of countries most affected by climate change in 2015. India emits about 3 gigatonnes (Gt) CO2eq of greenhouse gases each year; about two and a half tons per person, which is less than the world average. The country emits 7% of global emissions, despite having 17% of the world population. Temperature rises on the Tibetan Plateau are causing Himalayan glaciers to retreat, threatening the flow rate of the Ganges, Brahmaputra, Yamuna and other major rivers. A 2007 World Wide Fund for Nature (WWF) report states that the Indus River may run dry for the same reason. Heat waves' frequency and intensity are increasing in India because of climate change. Severe landslides and floods are projected to become increasingly common in such states as Assam. The climate change performance index of India ranks eighth among 63 countries which account for 92% of all GHG emissions in the year 2021.
Green recovery packages are proposed environmental, regulatory, and fiscal reforms to rebuild prosperity in the wake of an economic crisis, such as the COVID-19 pandemic or the Global Financial Crisis (GFC). They pertain to fiscal measures that intend to recover economic growth while also positively benefitting the environment, including measures for renewable energy, efficient energy use, nature-based solutions, sustainable transport, green innovation and green jobs, amongst others.
The global carbon reward is a proposed international policy for establishing and funding a new global carbon market for decarbonising all sectors of the world economy, and for establishing and funding a new economic sector dedicated to carbon dioxide removal (CDR). The policy is market-based, and it will offer proportional financial rewards in exchange for verifiable climate mitigation services and co-benefits. The policy approach was first presented in 2017 by Delton Chen, Joël van der Beek, and Jonathan Cloud to address the 2015 Paris Agreement, and it has since been refined.


