The GNU Debugger (GDB) is a portable debugger that runs on many Unix-like systems and works for many programming languages, including Ada, Assembly, C, C++, D, Fortran, Haskell, Go, Objective-C, OpenCL C, Modula-2, Pascal, Rust, and partially others.

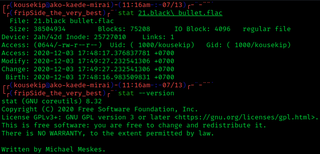
stat is a Unix system call that returns file attributes about an inode. The semantics of stat vary between operating systems. As an example, Unix command ls uses this system call to retrieve information on files that includes:
Sparse is a computer software tool designed to find possible coding faults in the Linux kernel. Unlike other such tools, this static analysis tool was initially designed to only flag constructs that were likely to be of interest to kernel developers, such as the mixing of pointers to user and kernel address spaces.

DTrace is a comprehensive dynamic tracing framework originally created by Sun Microsystems for troubleshooting kernel and application problems on production systems in real time. Originally developed for Solaris, it has since been released under the free Common Development and Distribution License (CDDL) in OpenSolaris and its descendant illumos, and has been ported to several other Unix-like systems.
typedef is a reserved keyword in the programming languages C, C++, and Objective-C. It is used to create an additional name (alias) for another data type, but does not create a new type, except in the obscure case of a qualified typedef of an array type where the typedef qualifiers are transferred to the array element type. As such, it is often used to simplify the syntax of declaring complex data structures consisting of struct and union types, although it is also commonly used to provide specific descriptive type names for integer data types of varying sizes.
In computer programming, the term hooking covers a range of techniques used to alter or augment the behaviour of an operating system, of applications, or of other software components by intercepting function calls or messages or events passed between software components. Code that handles such intercepted function calls, events or messages is called a hook.
In computing, exec is a functionality of an operating system that runs an executable file in the context of an already existing process, replacing the previous executable. This act is also referred to as an overlay. It is especially important in Unix-like systems, although it also exists elsewhere. As no new process is created, the process identifier (PID) does not change, but the machine code, data, heap, and stack of the process are replaced by those of the new program.
Tracing in software engineering refers to the process of capturing and recording information about the execution of a software program. This information is typically used by programmers for debugging purposes, and additionally, depending on the type and detail of information contained in a trace log, by experienced system administrators or technical-support personnel and by software monitoring tools to diagnose common problems with software. Tracing is a cross-cutting concern.

In computing, SystemTap is a scripting language and tool for dynamically instrumenting running production Linux-based operating systems. System administrators can use SystemTap to extract, filter and summarize data in order to enable diagnosis of complex performance or functional problems.
In computer programming, variadic templates are templates that take a variable number of arguments.

The Linux kernel is a free and open-source, monolithic, modular, multitasking, Unix-like operating system kernel. It was originally written in 1991 by Linus Torvalds for his i386-based PC, and it was soon adopted as the kernel for the GNU operating system, which was written to be a free (libre) replacement for Unix.
LTTng is a system software package for correlated tracing of the Linux kernel, applications and libraries. The project was originated by Mathieu Desnoyers with an initial release in 2005. Its predecessor is the Linux Trace Toolkit.
The C programming language has a set of functions implementing operations on strings in its standard library. Various operations, such as copying, concatenation, tokenization and searching are supported. For character strings, the standard library uses the convention that strings are null-terminated: a string of n characters is represented as an array of n + 1 elements, the last of which is a "NUL character" with numeric value 0.
In computer science, dynamic software updating (DSU) is a field of research pertaining to upgrading programs while they are running. DSU is not currently widely used in industry. However, researchers have developed a wide variety of systems and techniques for implementing DSU. These systems are commonly tested on real-world programs.
perf is a performance analyzing tool in Linux, available from Linux kernel version 2.6.31 in 2009. Userspace controlling utility, named perf, is accessed from the command line and provides a number of subcommands; it is capable of statistical profiling of the entire system.
A code sanitizer is a programming tool that detects bugs in the form of undefined or suspicious behavior by a compiler inserting instrumentation code at runtime. The class of tools was first introduced by Google's AddressSanitizer of 2012, which uses directly mapped shadow memory to detect memory corruption such as buffer overflows or accesses to a dangling pointer (use-after-free).
kGraft is a feature of the Linux kernel that implements live patching of a running kernel, which allows kernel patches to be applied while the kernel is still running. By avoiding the need for rebooting the system with a new kernel that contains the desired patches, kGraft aims to maximize the system uptime and availability. At the same time, kGraft allows kernel-related security updates to be applied without deferring them to scheduled downtimes. Internally, kGraft allows entire functions in a running kernel to be replaced with their patched versions, doing that safely by selectively using original versions of functions to ensure per-process consistency while the live patching is performed.
kpatch is a feature of the Linux kernel that implements live patching of a running kernel, which allows kernel patches to be applied while the kernel is still running. By avoiding the need for rebooting the system with a new kernel that contains the desired patches, kpatch aims to maximize the system uptime and availability. At the same time, kpatch allows kernel-related security updates to be applied without deferring them to scheduled downtimes. Internally, kpatch allows entire functions in a running kernel to be replaced with their patched versions, doing that safely by stopping all running processes while the live patching is performed.
ftrace is a tracing framework for the Linux kernel. Although its original name, Function Tracer, came from ftrace's ability to record information related to various function calls performed while the kernel is running, ftrace's tracing capabilities cover a much broader range of kernel's internal operations.

Kernel page-table isolation is a Linux kernel feature that mitigates the Meltdown security vulnerability and improves kernel hardening against attempts to bypass kernel address space layout randomization (KASLR). It works by better isolating user space and kernel space memory. KPTI was merged into Linux kernel version 4.15, and backported to Linux kernels 4.14.11, 4.9.75, and 4.4.110. Windows and macOS released similar updates. KPTI does not address the related Spectre vulnerability.


