Lac-Saint-Louis

Last updated

Lac-Saint-Louis
Flag of Quebec.svg Quebec electoral district
Lac-Saint-Louis (Canadian electoral district).svg
Lac-Saint-Louis in relation to other federal electoral districts in Montreal and Laval
Federal electoral district
Legislature House of Commons
MP


Francis Scarpaleggia
Liberal
District created1996
First contested 1997
Last contested 2021
District webpage profile, map
Demographics
Population (2016) [1] 108,579
Electors (2019)83,788
Area (km²) [1] 81
Pop. density (per km²)1,340.5
Census division(s) Montreal
Census subdivision(s) Montreal (part), Pointe-Claire, Kirkland, Beaconsfield, Sainte-Anne-de-Bellevue, Baie-d'Urfé, Senneville

Lac-Saint-Louis is a federal electoral district in Quebec, Canada, that has been represented in the House of Commons of Canada since 1997. Its population was 108,579 at the 2016 Canadian Census.

Contents

Geography

The district includes the Cities of Beaconsfield, and Pointe-Claire; the Towns of Baie-d'Urfé, Kirkland and Sainte-Anne-de-Bellevue; the Municipality of Senneville; and the western part of the borough of Pierrefonds-Roxboro of the city of Montreal.

The neighbouring ridings are Pierrefonds—Dollard, Dorval—Lachine—LaSalle and Vaudreuil—Soulanges.

History

The electoral district was created in 1996 from Lachine—Lac-Saint-Louis and Vaudreuil ridings.

This riding was largely untouched by the 2012 electoral redistribution, gaining a small territory from Notre-Dame-de-Grâce—Lachine.

Members of Parliament

This riding has elected the following members of Parliament:

ParliamentYearsMemberParty
Lac-Saint-Louis
Riding created from Lachine—Lac-Saint-Louis and Vaudreuil
36th  1997–2000   Clifford Lincoln Liberal
37th  2000–2004
38th  2004–2006 Francis Scarpaleggia
39th  2006–2008
40th  2008–2011
41st  2011–2015
42nd  2015–2019
43rd  2019–2021
44th  2021–present

Election results

2021 Canadian federal election
PartyCandidateVotes%±%Expenditures
Liberal Francis Scarpaleggia 32,47756.3-1.9$82,540.53
Conservative Ann Francis10,91118.9+3.6$6,039.07
New Democratic Jonathan Gray7,67913.3+1.1$2,178.95
Bloc Québécois Rémi Lebeuf3,0785.3±0.0$2,242.01
Green Milan Kona-Mancini1,8683.2-3.8$0.00
People's Afia Lassy1,7123.0+1.6$4,594.81
Total valid votes/expense limit57,72599.1$113,303.53
Total rejected ballots5240.9
Turnout58,24969.7
Registered voters83,616
Liberal hold Swing -2.8
Source: Elections Canada [2]
2019 Canadian federal election : Lac-Saint-Louis
PartyCandidateVotes%±%Expenditures
Liberal Francis Scarpaleggia 34,62258.16-5.97$79,198.20
Conservative Ann Francis9,08315.26-2.16$47,678.03
New Democratic Dana Chevalier7,26312.20-0.63$1,823.39
Green Milan Kona-Mancini4,1767.02+4.11$11,504.53
Bloc Québécois Julie Benoît3,1695.32+2.63$1,149.75
People's Gary Charles8051.35$10,581.28
Animal Protection Victoria de Martigny3790.64none listed
Canadian Nationalist Ralston Coelho280.05$0.00
Total valid votes/expense limit59,52599.26 TBD
Total rejected ballots4450.74+0.23
Turnout59,97071.33-1.61
Eligible voters84,074
Liberal hold Swing -1.90
Source: Elections Canada [3]
2015 Canadian federal election
PartyCandidateVotes%±%Expenditures
Liberal Francis Scarpaleggia 39,96564.14+30.03$119,096.00
Conservative Eric Girard 10,85717.42-11.02$74,550.48
New Democratic Ryan Young7,99712.83-17.23$30,673.16
Green Bradford Dean1,8122.91-1.36
Bloc Québécois Gabriel Bernier1,6812.70-0.42$4,317.92
Total valid votes/expense limit62,31299.49 $224,522.81
Total rejected ballots3210.51-0.02
Turnout62,63372.94+6.81
Eligible voters85,870
Liberal hold Swing +23.63
Source: Elections Canada [4] [5]
2011 federal election redistributed results [6]
PartyVote %
  Liberal 18,50234.10
  New Democratic 16,31230.06
  Conservative 15,43428.44
  Green 2,3194.27
  Bloc Québécois 1,6933.12
2011 Canadian federal election
PartyCandidateVotes%±%Expenditures
Liberal Francis Scarpaleggia 18,45734.11-12.27
New Democratic Alain Ackad16,25330.04+14.28
Conservative Larry Smith 15,39428.45+4.94
Green Bruno Tremblay2,3154.28-4.30
Bloc Québécois Éric Taillefer1,6893.12-2.62
Total valid votes/expense limit54,108100.00
Rejected ballots287 0.53-0.01
Turnout54,39566.13+2.10
Liberal hold Swing -13.28
2008 Canadian federal election
PartyCandidateVotes%±%Expenditures
Liberal Francis Scarpaleggia 23,84246.38-1.8$71,566
Conservative Andrea Paine12,08523.51-3.2$54,850
New Democratic Daniel Quinn8,10515.76+5.1
Green Peter Graham4,4158.58+1.8$7,679
Bloc Québécois Maxime Clément2,9535.74-2.0$6,931
Total valid votes/expense limit51,400100.00
Rejected ballots277 0.54
Turnout51,67764.03
Liberal hold Swing -2.5
2006 Canadian federal election
PartyCandidateVotes%±%Expenditures
Liberal Francis Scarpaleggia 25,58848.2-15.7$46,751
Conservative Andrea Paine14,16426.7+14.6$74,919
New Democratic Daniel Quinn5,70210.7+5.6$8,129
Bloc Québécois Anne-Marie Guertin4,0647.7-2.5$9,298
Green Peter Graham3,6056.8+1.6$1,340
Total valid votes/expense limit53,123100.0 $80,616
Liberal hold Swing -215.15
2004 Canadian federal election
PartyCandidateVotes%±%Expenditures
Liberal Francis Scarpaleggia 32,12263.9-10.3$41,498
Conservative Jeff Howard6,08212.1-2.6$15,262
Bloc Québécois Maxime Côté5,10610.2+3.5$7,084
New Democratic Daniel Quinn3,7897.5+5.0$6,036
Green Peter Graham2,5845.1$1,808
Marijuana Patrick Cardinal5781.1-0.6
Total valid votes/expense limit50,261 100.0 $79,772
Liberal hold Swing -6.45

Note: Conservative vote is compared to the total of the Canadian Alliance vote and Progressive Conservative vote in the 2000 election.

2000 Canadian federal election
PartyCandidateVotes%±%
Liberal Clifford Lincoln 43,51574.2+5.2
Progressive Conservative Daniel Gendron4,4117.5-10.8
Alliance William F. Shaw 4,2187.2+4.7
Bloc Québécois Guy Amyot3,9136.7-0.4
New Democratic Erin Sikora1,4642.50.0
Marijuana Elena D'Apollonia1,0311.8
Marxist–Leninist Garnet Colly1190.2
Total valid votes58,671 100.0

Note: Canadian Alliance vote is compared to the Reform vote in 1997 election.

1997 Canadian federal election
PartyCandidateVotes%
Liberal Clifford Lincoln 42,61369.0
Progressive Conservative Nick Di Tomaso11,29318.3
Bloc Québécois Guy Amyot4,3477.0
Reform William Bill Haines1,5562.5
New Democratic Chris Florence1,5482.5
Natural Law Ruby Finkelstein3860.6
Total valid votes61,743 100.0

See also

Related Research Articles

<span class="mw-page-title-main">Châteauguay—Saint-Constant</span> Federal electoral district in Quebec, Canada

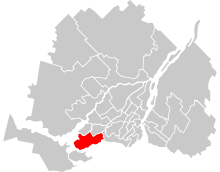
Châteauguay—Saint-Constant was a federal electoral district in Quebec, Canada, that was represented in the House of Commons of Canada from 2004 to 2015. Its population in 2006 was 107,165.

<span class="mw-page-title-main">Mount Royal (electoral district)</span> Federal electoral district in Quebec, Canada

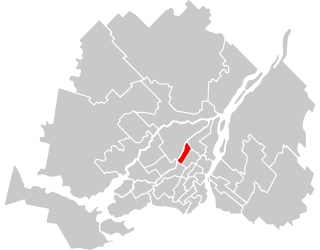
Mount Royal is a federal electoral district in Quebec, Canada, that has been represented in the House of Commons of Canada since 1925. Its population in 2006 was 98,888.

<span class="mw-page-title-main">Louis-Hébert (federal electoral district)</span> Federal electoral district in Quebec, Canada

Louis-Hébert is a federal electoral district in the Canadian province of Quebec. Represented in the House of Commons since 1968, its population was certified, according to the detailed statistics of 2001, as 98,156.

<span class="mw-page-title-main">Saint-Hyacinthe—Bagot</span> Federal electoral district in Quebec, Canada

Saint-Hyacinthe—Bagot is a federal electoral district that has been represented in the House of Commons of Canada since 1935. It is located in Quebec, Canada. Its population in 2006 was 95,983. In the 2015 election, the winner received the lowest vote percentage of any winning candidate in the country.

<span class="mw-page-title-main">Notre-Dame-de-Grâce—Lachine</span> Electoral district in Quebec, Canada

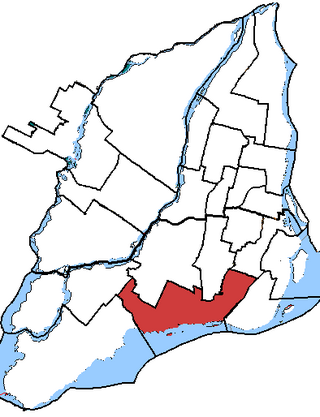
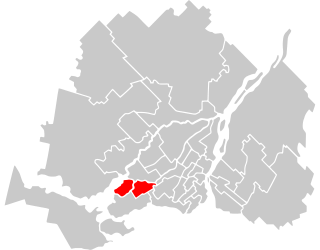
Notre-Dame-de-Grâce—Lachine was a federal electoral district in Quebec, Canada, that was represented in the House of Commons of Canada from 1997 to 2015. Its population in 2006 was 104,715.

<span class="mw-page-title-main">Bourassa (electoral district)</span> Federal electoral district in Quebec, Canada

Bourassa is a federal electoral district in Quebec, Canada, that has been represented in the House of Commons of Canada since 1968. Its population in 2021 was 105,637.

<span class="mw-page-title-main">Pierrefonds—Dollard</span> Federal electoral district in Quebec, Canada

Pierrefonds—Dollard is a federal electoral district in Quebec, Canada, that has been represented in the House of Commons of Canada since 1988. Its population was 108,587 at the 2016 Canadian Census.

<span class="mw-page-title-main">Saint-Laurent (federal electoral district)</span> Federal electoral district in Quebec, Canada

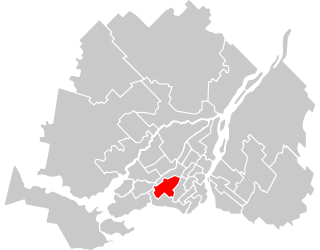
Saint-Laurent is a federal electoral district in Quebec, Canada, that has been represented in the House of Commons of Canada since 1988.

<span class="mw-page-title-main">Longueuil—Saint-Hubert</span> Federal electoral district in Quebec, Canada

Longueuil—Saint-Hubert is a federal electoral district in Quebec, Canada, represented in the House of Commons of Canada from since 2015

<span class="mw-page-title-main">Portneuf—Jacques-Cartier</span> Federal electoral district in Quebec, Canada

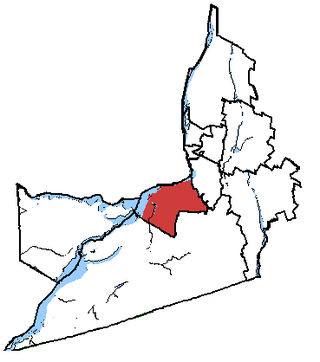
Portneuf—Jacques-Cartier is a federal electoral district in Quebec, Canada, that has been represented in the House of Commons of Canada since 1867. Its population in 2001 was 87,141. It is currently represented by Joël Godin of the Conservative Party of Canada.

<span class="mw-page-title-main">Joliette (federal electoral district)</span> Federal electoral district in Quebec, Canada

Joliette is a federal electoral district in Quebec, Canada, that has been represented in the House of Commons of Canada from 1867 to 1935 and since 1968.

<span class="mw-page-title-main">Brome—Missisquoi</span> Federal electoral district in Quebec, Canada

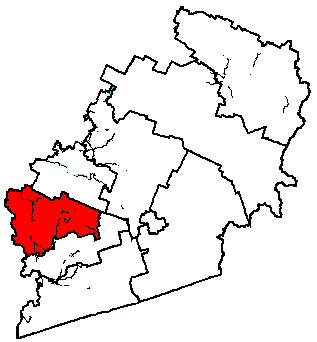
Brome—Missisquoi is a federal electoral district in Quebec, Canada, that has been represented in the House of Commons of Canada since 1925. The original electoral district of Missiquoi existed from 1867 to 1925.

<span class="mw-page-title-main">Argenteuil—Papineau—Mirabel</span> Federal electoral district in Quebec, Canada

Argenteuil—Papineau—Mirabel was a federal electoral district in Quebec, Canada, that was represented in the House of Commons of Canada from 1867 to 2015.

<span class="mw-page-title-main">Beauharnois—Salaberry</span> Federal electoral district in Quebec, Canada

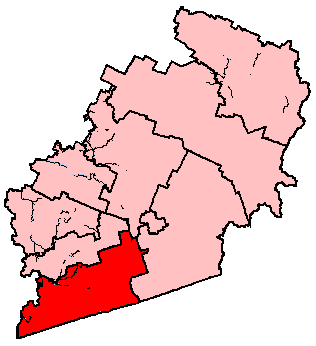
Beauharnois—Salaberry is a former federal electoral district in Quebec, Canada, that was represented in the House of Commons of Canada from 1949 to 2015.

<span class="mw-page-title-main">Compton—Stanstead</span> Federal electoral district in Quebec, Canada

Compton—Stanstead is a federal electoral district in Quebec, Canada, that has been represented in the House of Commons of Canada since 1997.

<span class="mw-page-title-main">Abitibi—Baie-James—Nunavik—Eeyou</span> Federal electoral district in Quebec, Canada

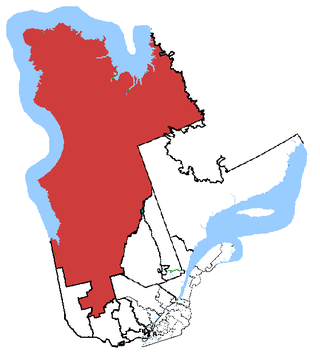
Abitibi—Baie-James—Nunavik—Eeyou is a federal riding in the province of Quebec, Canada, that have been represented in the House of Commons of Canada since 1966.

<span class="mw-page-title-main">Rivière-des-Mille-Îles (electoral district)</span> Federal electoral district in Quebec, Canada

Rivière-des-Mille-Îles is a federal electoral district in Quebec, Canada, that has been represented in the House of Commons of Canada since 1997.

<span class="mw-page-title-main">Saint-Jean (federal electoral district)</span> Federal electoral district in Quebec, Canada

Saint-Jean is a federal electoral district in Quebec, Canada, that has been represented in the House of Commons of Canada since 1968.

Vaudreuil—Soulanges is a federal electoral district in Quebec, Canada, that has been represented in the House of Commons of Canada since 1867.

<span class="mw-page-title-main">Verchères—Les Patriotes</span> Federal electoral district in Quebec, Canada

Verchères—Les Patriotes was a federal electoral district in Quebec, Canada, that was represented in the House of Commons of Canada from 1979 until the 2012 electoral redistribution.

References

Notes

45°26′N73°53′W / 45.433°N 73.883°W / 45.433; -73.883