List of continents and continental subregions by population

Last updated

This is a list of continents and continental subregions by population.

Contents

World population by continent, 2021

   Asia (59.4%)
   Africa (17.6%)
   Europe (9.4%)
   North America (7.5%)
   South America (5.5%)
   Oceania (0.6%)
   Antarctica (0%)

Distribution of populations by continent

Continent Population
(2021) [1] [2] [3]
 % (world)±% p.a.
(2010–2013)
Countries

(2021)

World 7,909,295,151100%1.17%191
Asia 4,694,576,16759.4%1.04%49
Africa 1,393,676,44417.6%2.57%54
Europe 745,173,7749.4%0.08%51
North America 595,783,4657.5%0.96%23
South America 434,254,1195.5%1.06%12
Oceania 44,491,7240.6%1.47%2
Antarctica 00%0%0

Distribution of populations by continental subregion

Continental subregion Population
(2021) [1] [2]
 % (world)±% p.a.
(2010–2013)
World 7,909,295,151100%1.17%
Southern Asia [lower-alpha 1] 1,989,452,47825.2%1.32%
Eastern Asia 1,663,696,92321.0%0.57%
South-eastern Asia 675,796,0658.5%1.20%
Eastern Africa [lower-alpha 2] 461,141,8455.8%2.89%
South America 434,254,1195.5%1.06%
Western Africa [lower-alpha 3] 418,544,3375.3%2.78%
Northern America 375,278,9474.7%0.85%
Eastern Europe [lower-alpha 4] 291,464,1623.7%0.23%
Western Asia [lower-alpha 5] 289,733,1233.7%1.98%
Northern Africa [lower-alpha 6] 255,737,7363.2%1.70%
Western Europe [lower-alpha 7] 195,381,6492.5%0.25%
Middle Africa [lower-alpha 8] 190,267,9732.4%2.79%
Central America [lower-alpha 9] 177,661,9292.2%1.40%
Southern Europe 152,130,6061.9%0.24%
Northern Europe [lower-alpha 10] 106,197,3571.3%0.54%
Central Asia 75,897,5771.0%1.43%
Southern Africa 67,984,5540.9%0.91%
Caribbean 44,182,0480.6%0.71%
Australia and New Zealand 31,050,8160.4%N/A
Melanesia [lower-alpha 11] 12,188,8340.2%N/A
Polynesia 717,4670.009%N/A
Micronesia 534,6060.007%N/A
Antarctica 00%0%

Global, continental, and subregional totals from 1950 to 2021

Africa

Eastern Africa
YearPop.±% p.a.
1950 66,923,000    
1960 84,305,000+2.34%
1970 110,428,000+2.74%
1980 147,512,000+2.94%
1990 198,232,000+3.00%
2000 259,373,000+2.72%
2010 342,743,000+2.83%
2021 461,141,845+2.73%
Middle Africa
YearPop.±% p.a.
1950 26,401,000    
1960 32,216,000+2.01%
1970 40,846,000+2.40%
1980 53,135,000+2.67%
1990 70,886,000+2.92%
2000 96,113,000+3.09%
2010 130,598,000+3.11%
2021 190,267,973+3.48%
Northern Africa
YearPop.±% p.a.
1950 49,222,000    
1960 63,697,000+2.61%
1970 82,883,000+2.67%
1980 106,908,000+2.58%
1990 140,117,000+2.74%
2000 171,891,000+2.06%
2010 203,717,000+1.71%
2021 255,737,736+2.09%
Southern Africa
YearPop.±% p.a.
1950 15,588,000    
1960 19,724,000+2.38%
1970 25,454,000+2.58%
1980 32,997,000+2.63%
1990 42,049,000+2.45%
2000 51,451,000+2.04%
2010 59,067,000+1.39%
2021 67,984,554+1.29%
Western Africa
YearPop.±% p.a.
1950 70,769,000    
1960 84,946,000+1.84%
1970 106,015,000+2.24%
1980 137,414,000+2.63%
1990 180,331,000+2.76%
2000 235,235,000+2.69%
2010 307,982,000+2.73%
2021 418,544,337+2.83%
Total Africa
YearPop.±% p.a.
1950 228,902,000    
1960 284,887,000+2.21%
1970 365,626,000+2.53%
1980 477,965,000+2.72%
1990 631,614,000+2.83%
2000 814,063,000+2.57%
2010 1,044,107,000+2.52%
2021 1,393,676,444+2.66%

Americas

Total Americas
YearPop.±% p.a.
1950 340,459,000    
1960 425,357,000+2.25%
1970 519,522,000+2.02%
1980 619,252,000+1.77%
1990 727,522,000+1.62%
2000 840,614,000+1.46%
2010 943,952,000+1.17%
2021 1,031,377,044+0.81%

North America

Caribbean
YearPop.±% p.a.
1950 17,076,000    
1960 20,724,000+1.96%
1970 25,306,000+2.02%
1980 29,748,000+1.63%
1990 34,198,000+1.40%
2000 38,314,000+1.14%
2010 41,621,000+0.83%
2021 44,182,048+0.54%
Central America
YearPop.±% p.a.
1950 38,029,000    
1960 51,400,000+3.06%
1970 69,702,000+3.09%
1980 92,425,000+2.86%
1990 114,823,000+2.19%
2000 138,780,000+1.91%
2010 161,117,000+1.50%
2021 177,661,929+0.89%
Northern America
YearPop.±% p.a.
1950 171,615,000    
1960 204,167,000+1.75%
1970 231,029,000+1.24%
1980 254,217,000+0.96%
1990 280,633,000+0.99%
2000 313,724,000+1.12%
2010 344,129,000+0.93%
2021 375,278,947+0.79%
Total North America
YearPop.±% p.a.
1950 226,719,000    
1960 276,291,000+2.00%
1970 326,036,000+1.67%
1980 376,390,000+1.45%
1990 429,653,000+1.33%
2000 490,818,000+1.34%
2010 546,867,000+1.09%
2021 597,122,924+0.80%

South America

Total South America
YearPop.±% p.a.
1950 113,739,000    
1960 149,066,000+2.74%
1970 193,486,000+2.64%
1980 242,862,000+2.30%
1990 297,869,000+2.06%
2000 349,796,000+1.62%
2010 397,085,000+1.28%
2021 434,254,119+0.82%

Asia

Central Asia
YearPop.±% p.a.
1950 18,131,000    
1960 24,616,000+3.10%
1970 33,156,000+3.02%
1980 41,277,000+2.21%
1990 50,407,929+2.02%
2000 55,117,000+0.90%
2010 62,139,000+1.21%
2021 75,897,577+1.83%
Eastern Asia
YearPop.±% p.a.
1950 666,586,000    
1960 788,145,000+1.69%
1970 978,113,000+2.18%
1980 1,173,372,000+1.84%
1990 1,368,592,000+1.55%
2000 1,496,284,000+0.90%
2010 1,575,320,000+0.52%
2021 1,663,696,923+0.50%
South-eastern Asia
YearPop.±% p.a.
1950 164,900,000    
1960 213,838,000+2.63%
1970 281,521,000+2.79%
1980 358,106,000+2.44%
1990 445,665,000+2.21%
2000 526,179,000+1.67%
2010 596,708,000+1.27%
2021 675,796,065+1.14%
Southern Asia
YearPop.±% p.a.
1950 493,443,000    
1960 593,943,000+1.87%
1970 741,603,000+2.25%
1980 939,043,000+2.39%
1990 1,189,261,000+2.39%
2000 1,451,933,000+2.02%
2010 1,702,969,000+1.61%
2021 1,989,452,478+1.42%
Western Asia
YearPop.±% p.a.
1950 50,957,000    
1960 66,156,000+2.64%
1970 86,037,000+2.66%
1980 113,786,000+2.83%
1990 148,552,000+2.70%
2000 184,957,000+2.22%
2010 232,703,000+2.32%
2021 289,733,123+2.01%
Total Asia
YearPop.±% p.a.
1950 1,394,018,000    
1960 1,686,698,000+1.92%
1970 2,120,430,000+2.31%
1980 2,625,584,000+2.16%
1990 3,202,475,000+2.01%
2000 3,714,470,000+1.49%
2010 4,169,850,000+1.16%
2021 4,694,576,167+1.08%

Europe

Eastern Europe
YearPop.±% p.a.
1950 220,171,000    
1960 253,630,000+1.42%
1970 276,396,000+0.86%
1980 295,042,000+0.65%
1990 310,027,000+0.50%
2000 303,789,000−0.20%
2010 294,591,000−0.31%
2021 291,464,162−0.10%
Northern Europe
YearPop.±% p.a.
1950 78,030,000    
1960 81,790,000+0.47%
1970 87,305,000+0.65%
1980 89,833,000+0.29%
1990 92,040,000+0.24%
2000 94,397,000+0.25%
2010 99,682,000+0.55%
2021 106,197,357+0.58%
Southern Europe
YearPop.±% p.a.
1950 108,633,000    
1960 117,879,000+0.82%
1970 127,617,000+0.80%
1980 138,495,000+0.82%
1990 143,404,000+0.35%
2000 145,058,000+0.11%
2010 153,360,000+0.56%
2021 152,130,606−0.07%
Western Europe
YearPop.±% p.a.
1950 142,256,000    
1960 152,320,000+0.69%
1970 165,903,000+0.86%
1980 170,489,000+0.27%
1990 175,615,000+0.30%
2000 183,163,000+0.42%
2010 187,762,000+0.25%
2021 195,381,649+0.36%
Total Europe
YearPop.±% p.a.
1950 549,089,000    
1960 605,619,000+0.98%
1970 657,221,000+0.82%
1980 693,859,000+0.54%
1990 721,086,000+0.39%
2000 726,407,000+0.07%
2010 735,395,000+0.12%
2021 745,173,774+0.12%

Oceania

Total Oceania
YearPop.±% p.a.
1950 12,682,000    
1960 15,784,000+2.21%
1970 19,688,000+2.23%
1980 22,972,000+1.55%
1990 26,971,000+1.62%
2000 31,068,000+1.42%
2010 36,411,000+1.60%
2016 39,901,000+1.54%
2021 44,491,724+2.20%

World

Total World
YearPop.±% p.a.
1950 2,525,149,000    
1960 3,018,344,000+1.80%
1970 3,682,488,000+2.01%
1980 4,439,632,000+1.89%
1990 5,309,668,000+1.81%
2000 6,126,622,000+1.44%
2010 6,929,725,000+1.24%
2021 7,909,295,151+1.21%

Notes

See also

Related Research Articles

<span class="mw-page-title-main">West Asia</span> Subregion of the Asian continent

West Asia, also called Western Asia or Southwest Asia, is the westernmost region of Asia. As defined by most academics, UN bodies and other institutions, the subregion consists of Anatolia, the Arabian Peninsula, Iran, Mesopotamia, the Armenian highlands, the Levant, the island of Cyprus, the Sinai Peninsula and the South Caucasus. The region is separated from Africa by the Isthmus of Suez in Egypt, and separated from Europe by the waterways of the Turkish Straits and the watershed of the Greater Caucasus. Central Asia lies to its northeast, while South Asia lies to its east. Twelve seas surround the region (clockwise): the Aegean Sea, the Sea of Marmara, the Black Sea, the Caspian Sea, the Persian Gulf, the Gulf of Oman, the Arabian Sea, the Gulf of Aden, the Red Sea, the Gulf of Aqaba, the Gulf of Suez, and the Mediterranean Sea. West Asia contains the majority of the similarly defined Middle East, but excludes most of Egypt and the northwestern part of Turkey, and includes the southern part of the Caucasus.

<span class="mw-page-title-main">Southern Europe</span> Southern region of Europe

Southern Europe is the southern region of Europe. It is also known as Mediterranean Europe, as its geography is marked by the Mediterranean Sea. Definitions of southern Europe include some or all of these countries and regions: Albania, Andorra, Bosnia and Herzegovina, Bulgaria, Croatia, Cyprus, Gibraltar, Greece, Italy, Kosovo, Malta, Monaco, Montenegro, North Macedonia, Portugal, San Marino, Serbia, Slovenia, southern France, Spain, Turkey, and Vatican City.

<span class="mw-page-title-main">Subregion</span> Part of a larger geographic region or continent

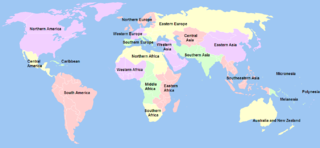
A subregion is a part of a larger region or continent. Cardinal directions are commonly used to define subregions. There are many criteria for creating systems of subregions; this article is focusing on the UN statistical geoscheme, which is a changing, constantly updated, UN tool based on specific political geography considerations relevant in UN statistics.

<span class="mw-page-title-main">Demographics of Europe</span> Population, age, religion, etc., of Europe

Figures for the population of Europe vary according to the particular definition of Europe's boundaries. In 2018, Europe had a total population of over 751 million people. 448 million of that live in the European Union and 110 million live in European Russia, Russia being the most populous country in Europe.

<span class="mw-page-title-main">Northern America</span> Northernmost subregion of North America

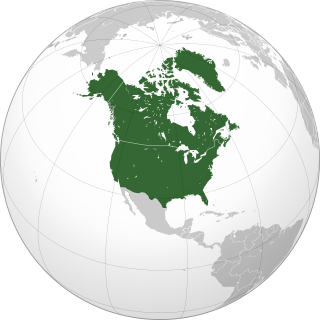
Northern America is the northernmost subregion of North America as well as the northernmost region in the Americas. The boundaries may be drawn slightly differently. In one definition, it lies directly north of Middle America. Northern America's land frontier with the rest of North America then coincides with the Mexico–United States border. Geopolitically, according to the United Nations' scheme of geographical regions and subregions, Northern America consists of Bermuda, Canada, Greenland, Saint Pierre and Miquelon and the United States.

<span class="mw-page-title-main">West Indies</span> Island region of the North Atlantic Ocean and the Caribbean

The West Indies is a subregion of North America, surrounded by the North Atlantic Ocean and the Caribbean Sea, which comprises 13 independent island countries and 19 dependencies in three archipelagos: the Greater Antilles, the Lesser Antilles, and the Lucayan Archipelago.

<span class="mw-page-title-main">United Nations geoscheme</span> UN system for grouping the worlds 248 countries and territories into regions and subregions

The United Nations geoscheme is a system which divides 248 countries and territories in the world into six continental regions, 22 geographical subregions, and two intermediary regions. It was devised by the United Nations Statistics Division (UNSD) based on the M49 coding classification. The creators note that "the assignment of countries or areas to specific groupings is for statistical convenience and does not imply any assumption regarding political or other affiliation of countries or territories".

<span class="mw-page-title-main">United Nations geoscheme for Africa</span> UN geographical categorization of Africa

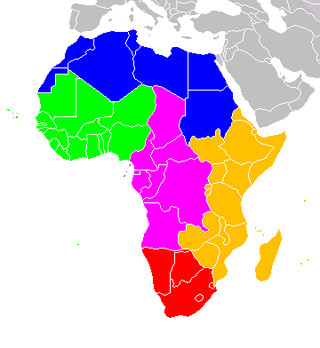
The following is an alphabetical list of subregions in the United Nations geoscheme for Africa, used by the United Nations and maintained by the UNSD department for statistical purposes.

<span class="mw-page-title-main">United Nations geoscheme for the Americas</span> United Nations geoscheme for North America and South America

The United Nations geoscheme for the Americas is an internal tool created and used by the UN's Statistics Division (UNSD) for the specific purpose of UN statistics.

<span class="mw-page-title-main">United Nations geoscheme for Europe</span>

The following is an alphabetical list of subregions in the United Nations geoscheme for Europe, created by the United Nations Statistics Division (UNSD). The scheme subdivides the continent into Eastern Europe, Northern Europe, Southern Europe, and Western Europe. The UNSD notes that "the assignment of countries or areas to specific groupings is for statistical convenience and does not imply any assumption regarding political or other affiliation of countries or territories".

<span class="mw-page-title-main">United Nations geoscheme for Oceania</span>

The United Nations geoscheme for Oceania is an internal tool created and used by the UN's Statistics Division (UNSD) for the specific purpose of UN statistics.

<span class="mw-page-title-main">United Nations geoscheme for Asia</span> Alphabetical list of subregions in the United Nations geoscheme for Asia

The United Nations geoscheme for Asia is an internal tool created and used by the United Nations, maintained by the United Nations Statistics Division (UNSD) for the specific purpose of UN statistics. The scheme's subregions are presented here in alphabetical order. Its subregions may not coincide with other geographic categorization schemes.

References

  1. 1 2 "World Population Prospects 2022". United Nations Department of Economic and Social Affairs, Population Division. Retrieved July 17, 2022.
  2. 1 2 "World Population Prospects 2022: Demographic indicators by region, subregion and country, annually for 1950-2100" (XSLX) ("Total Population, as of 1 July (thousands)"). United Nations Department of Economic and Social Affairs, Population Division. Retrieved July 17, 2022.
  3. "Population". United Nations. Retrieved July 25, 2021.

Sources