This article needs additional citations for verification .(October 2020) |
Liverpool, Walton | |
---|---|
Borough constituency for the House of Commons | |
County | Merseyside |
Electorate | 62,628 [1] |
Major settlements | Fazakerley, Orrell Park, Walton |
Current constituency | |
Created | 1885 |
Member of Parliament | Vacant |
Seats | One |
Created from | Liverpool |
Liverpool, Walton is a constituency [n 1] represented in the House of Commons of the UK Parliament since 2017 by Dan Carden of the Labour Party. [n 2] Carden won the highest percentage share of the vote in June 2017 of 650 constituencies, 85.7%. [2] It is the safest Labour seat in the United Kingdom, and the safest seat in the country having been won by 85% of the vote in the most recent election in 2019.
1918–1950: The County Borough of Liverpool wards of Fazakerley, Walton, and Warbreck.
1950–1955: As above plus the civil parish of Aintree in the Rural District of West Lancashire.
1955–1983: The County Borough of Liverpool wards of County, Fazakerley, Pirrie, and Warbreck.
1983–2010: The City of Liverpool wards of Anfield, Breckfield, County, Fazakerley, Melrose, and Warbreck.
2010–present: The City of Liverpool wards of Anfield, Clubmoor, County, Everton, Fazakerley, and Warbreck.
The constituency is one of five covering the city of Liverpool and covers the north-centre of the city thereby taking in Walton, Clubmoor, Orrell Park, Anfield, Everton and Fazakerley. The grounds of Liverpool F.C. (Anfield) and Everton F.C. (Goodison Park), the city's two major football clubs, are in the constituency.
Further to the 2023 Periodic Review of Westminster constituencies, enacted by the Parliamentary Constituencies Order 2023, from the 2024 United Kingdom general election, the constituency will be composed of the following wards (as they existed on 1 December 2020):
The constituency will be subject to significant change, with the addition of the Croxteth and Norris Green wards from Liverpool West Derby and the Aintree district in the Sefton Borough ward of Molyneux from Sefton Central. These will be partly offset by the transfer of the Anfield and Everton wards to Liverpool Riverside.
Liverpool was subject to a comprehensive local government boundary review which came into effect in May 2023. [4] [5] Accordingly, the proposed boundaries no longer coincide with ward boundaries and the constituency will now comprise the following from the 2024 general election:
Created by the Redistribution of Seats Act 1885, Liverpool Walton has been held by the Labour Party since the 1964 general election, and is the party's safest seat by size of majority. In 2010 and 2015, it had the largest Labour majority in the country by percentage terms. [7] Labour has won over 70% of the vote at every general election in the Walton constituency since 1992, although for many years it was looked on as a reasonably safe Conservative seat. Until 1964, Labour had only gained Walton once, at their landslide victory after the Second World War in 1945. Like other seats in Merseyside, the Conservative Party's share of the vote declined rapidly during the 1980s, and Conservative candidates failed to poll in second place from 1997 until 2017. From 1964 until his death in 1991, the seat was held by the notable left-winger Eric Heffer; the subsequent by-election was won by Peter Kilfoyle, who held the seat until 2010. Steve Rotheram won the seat in 2010 after Kilfoyle stood down.
At both the 2010 and 2015 general elections, Liverpool Walton saw the highest share of the vote for a winning candidate in the country, and in the latter election, the 81.3% of the vote won by Rotheram was the highest of any candidate in an election in the UK since 1997. [8]
In 2015, Liverpool Walton was the only constituency in England where the Conservative candidate (Norsheen Bhatti) lost their deposit.
In May 2017, Steve Rotheram was elected as Mayor of the Liverpool City Region and chose not to stand for re-election as an MP at the 2017 general election held one month later. In that election, the seat was won by the Labour candidate Dan Carden with the highest vote share for any Labour candidate nationally at 85.7%. [9]
Party | Candidate | Votes | % | ±% | |
---|---|---|---|---|---|
Liberal Democrats | Sean Cadwallader [11] | ||||
Labour | |||||
Green | Martyn Madeley [12] | ||||
Majority | |||||
Turnout |
Party | Candidate | Votes | % | ±% | |
---|---|---|---|---|---|
Labour | Dan Carden | 34,538 | 84.7 | ―1.0 | |
Conservative | Alex Phillips | 4,018 | 9.9 | +1.3 | |
Green | Ted Grant | 814 | 2.0 | +0.8 | |
Liberal Democrats | David Newman | 756 | 1.9 | +0.4 | |
Liberal | Billy Lake | 660 | 1.6 | New | |
Majority | 30,520 | 74.8 | ―2.3 | ||
Turnout | 40,786 | 65.1 | ―2.2 | ||
Labour hold | Swing | ―1.1 | |||
In percentage terms, Carden's vote share and majority were unmatched by any candidate in any constituency at the 2019 election, [14] although higher turnouts and larger electorates saw fifteen other MPs — twelve Labour in London and one in Merseyside, and three Conservatives in Lincolnshire and Essex — win with bigger numerical majorities.
Party | Candidate | Votes | % | ±% | |
---|---|---|---|---|---|
Labour | Dan Carden | 36,175 | 85.7 | +4.4 | |
Conservative | Laura Evans | 3,624 | 8.6 | +3.9 | |
Independent | Terry May | 1,237 | 2.9 | New | |
Liberal Democrats | Kris Brown | 638 | 1.5 | ―0.8 | |
Green | Colm Feeley | 523 | 1.2 | ―1.3 | |
Majority | 32,551 | 77.1 | +4.8 | ||
Turnout | 42,197 | 67.3 | +6.2 | ||
Labour hold | Swing | +0.3 | |||
Party | Candidate | Votes | % | ±% | |
---|---|---|---|---|---|
Labour | Steve Rotheram | 31,222 | 81.3 | +9.3 | |
UKIP | Steven Flatman | 3,445 | 9.0 | +6.4 | |
Conservative | Norsheen Bhatti | 1,802 | 4.7 | ―1.8 | |
Green | Jonathan Clatworthy | 956 | 2.5 | New | |
Liberal Democrats | Patrick Moloney | 899 | 2.3 | ―11.9 | |
Independent | Alexander Karran | 56 | 0.1 | New | |
The Pluralist Party | Jonathan Bishop | 23 | 0.1 | New | |
Majority | 27,777 | 72.3 | +14.5 | ||
Turnout | 38,403 | 61.1 | +6.3 | ||
Labour hold | Swing | +1.5 | |||
Party | Candidate | Votes | % | ±% | |
---|---|---|---|---|---|
Labour | Steve Rotheram | 24,709 | 72.0 | +0.2 | |
Liberal Democrats | Patrick Moloney | 4,891 | 14.2 | ―2.7 | |
Conservative | Adam Marsden | 2,241 | 6.5 | +0.6 | |
BNP | Peter Stafford | 1,104 | 3.2 | New | |
UKIP | Joseph Nugent | 898 | 2.6 | ―0.7 | |
CPA | John Manwell | 297 | 0.9 | New | |
TUSC | Darren Ireland | 195 | 0.6 | New | |
Majority | 19,818 | 57.8 | +3.0 | ||
Turnout | 34,335 | 54.8 | +8.1 | ||
Labour hold | Swing | +1.5 | |||
Party | Candidate | Votes | % | ±% | |
---|---|---|---|---|---|
Labour | Peter Kilfoyle | 20,322 | 72.8 | ―5.0 | |
Liberal Democrats | Kiron Reid | 4,365 | 15.6 | +1.0 | |
Conservative | Sharon Buckle | 1,655 | 5.9 | ―0.2 | |
UKIP | Joseph Moran | 1,108 | 4.0 | +2.4 | |
Liberal | Daniel J. Wood | 480 | 1.7 | New | |
Majority | 15,957 | 57.2 | ―6.0 | ||
Turnout | 27,930 | 45.0 | +2.0 | ||
Labour hold | Swing | ―3.0 | |||
Party | Candidate | Votes | % | ±% | |
---|---|---|---|---|---|
Labour | Peter Kilfoyle | 22,143 | 77.8 | ―0.6 | |
Liberal Democrats | Kiron Reid | 4,147 | 14.6 | +3.5 | |
Conservative | Stephen Horgan | 1,726 | 6.1 | ―0.2 | |
UKIP | Paul Forrest | 442 | 1.6 | New | |
Majority | 17,996 | 63.2 | ―4.1 | ||
Turnout | 28,458 | 43.0 | ―16.5 | ||
Labour hold | Swing | ―2.1 | |||
Party | Candidate | Votes | % | ±% | |
---|---|---|---|---|---|
Labour | Peter Kilfoyle | 31,516 | 78.4 | +6.0 | |
Liberal Democrats | Richard J. Roberts | 4,478 | 11.1 | ―0.9 | |
Conservative | Mark K. Kotecha | 2,551 | 6.3 | ―6.2 | |
Referendum | Charles Grundy | 620 | 1.5 | New | |
Socialist Alternative | Lesley Mahmood | 444 | 1.1 | New | |
Liberal | Hazel L. Williams | 352 | 0.9 | ―1.1 | |
ProLife Alliance | Veronica P. Mearns | 246 | 0.6 | New | |
Majority | 27,038 | 67.3 | +8.4 | ||
Turnout | 40,207 | 59.5 | ―7.9 | ||
Labour hold | Swing | ||||
Party | Candidate | Votes | % | ±% | |
---|---|---|---|---|---|
Labour | Peter Kilfoyle | 34,214 | 72.4 | +8.0 | |
Conservative | Berkeley Greenwood | 5,915 | 12.5 | ―1.9 | |
Liberal Democrats | Joseph Lang | 5,672 | 12.0 | ―9.2 | |
Liberal | Tom Newall | 963 | 2.0 | New | |
Protestant Reformation | David J.E. Carson | 393 | 0.8 | New | |
Natural Law | Dianne Raiano | 98 | 0.2 | New | |
Majority | 28,299 | 59.9 | +16.7 | ||
Turnout | 47,255 | 67.4 | ―6.2 | ||
Labour hold | Swing | +4.9 | |||
Party | Candidate | Votes | % | ±% | |
---|---|---|---|---|---|
Labour | Peter Kilfoyle | 21,317 | 53.1 | ―11.3 | |
Liberal Democrats | Paul Clark | 14,457 | 36.0 | +14.8 | |
Walton Real Labour | Lesley Mahmood | 2,613 | 6.5 | New | |
Conservative | Berkeley Greenwood | 1,155 | 2.9 | ―11.5 | |
Monster Raving Loony | Screaming Lord Sutch | 546 | 1.4 | New | |
Independent | George Lee-Delisle | 63 | 0.1 | New | |
Majority | 6,860 | 17.1 | ―26.1 | ||
Turnout | 40,151 | 56.7 | ―16.9 | ||
Labour hold | Swing | ||||
Party | Candidate | Votes | % | ±% | |
---|---|---|---|---|---|
Labour | Eric Heffer | 34,661 | 64.4 | +11.7 | |
Liberal | Paul Clark | 11,408 | 21.2 | ―0.2 | |
Conservative | Iain Mays | 7,738 | 14.4 | ―10.7 | |
Majority | 23,253 | 43.2 | +15.6 | ||
Turnout | 53,807 | 73.6 | +4.0 | ||
Labour hold | Swing | +6.0 | |||
Party | Candidate | Votes | % | ±% | |
---|---|---|---|---|---|
Labour | Eric Heffer | 26,980 | 52.7 | ―2.5 | |
Conservative | Alan Maddox | 12,865 | 25.1 | ―11.5 | |
Liberal | David M.B. Croft | 10,970 | 21.4 | +11.9 | |
BNP | Donald J.M. McKechnie | 343 | 0.7 | New | |
Majority | 14,115 | 27.6 | +6.0 | ||
Turnout | 51,158 | 69.6 | ―3.2 | ||
Labour hold | Swing | ||||
Party | Candidate | Votes | % | ±% | |
---|---|---|---|---|---|
Labour | Eric Heffer | 20,231 | 55.2 | ―2.5 | |
Conservative | R. Gould | 12,673 | 34.6 | +4.4 | |
Liberal | N. Cardwell | 3,479 | 9.5 | ―2.4 | |
National Front | W.F. Haire | 254 | 0.7 | New | |
Majority | 7,558 | 20.6 | |||
Turnout | 36,637 | 72.8 | |||
Labour hold | Swing | ―3.5 | |||
Party | Candidate | Votes | % | ±% | |
---|---|---|---|---|---|
Labour | Eric Heffer | 20,568 | 58.0 | ||
Conservative | R. Gould | 10,706 | 30.2 | ||
Liberal | J. Watton | 4,221 | 11.9 | ||
Majority | 9,862 | 27.79 | |||
Turnout | 35,495 | 68.30 | |||
Labour hold | Swing | ||||
Party | Candidate | Votes | % | ±% | |
---|---|---|---|---|---|
Labour | Eric Heffer | 20,057 | 53.7 | ||
Conservative | R.W. Rollins | 11,841 | 31.7 | ||
Liberal | J. Watton | 4,842 | 13.0 | New | |
National Front | C. Gibbon | 647 | 1.7 | New | |
Majority | 8,216 | 22.0 | |||
Turnout | 37,387 | 72.69 | |||
Labour hold | Swing | ||||
Party | Candidate | Votes | % | ±% | |
---|---|---|---|---|---|
Labour | Eric Heffer | 20,530 | 56.0 | ―1.3 | |
Conservative | Joseph Norton | 16,124 | 44.0 | +1.3 | |
Majority | 4,406 | 12.0 | |||
Turnout | 36,654 | 68.0 | |||
Labour hold | Swing | ―1.3 | |||
Party | Candidate | Votes | % | ±% | |
---|---|---|---|---|---|
Labour | Eric Heffer | 20,950 | 57.3 | +3.7 | |
Conservative | Kenneth Thompson | 15,617 | 42.7 | ―3.7 | |
Majority | 5,333 | 14.6 | |||
Turnout | 36,567 | 71.2 | ―4.4 | ||
Labour hold | Swing | +3.7 | |||
Party | Candidate | Votes | % | ±% | |
---|---|---|---|---|---|
Labour | Eric Heffer | 21,452 | 53.6 | +8.1 | |
Conservative | Kenneth Thompson | 18,546 | 46.4 | ―8.1 | |
Majority | 2,906 | 7.3 | N/A | ||
Turnout | 39,998 | 75.6 | |||
Labour gain from Conservative | Swing | +8.1 | |||
Party | Candidate | Votes | % | ±% | |
---|---|---|---|---|---|
Conservative | Kenneth Thompson | 24,288 | 54.5 | +1.3 | |
Labour | George McCartney | 20,254 | 45.5 | ―1.3 | |
Majority | 4,034 | 9.1 | |||
Turnout | 44,542 | 77.7 | |||
Conservative hold | Swing | ||||
Party | Candidate | Votes | % | ±% | |
---|---|---|---|---|---|
Conservative | Kenneth Thompson | 23,851 | 53.2 | ||
Labour | Joseph Cleary | 20,989 | 46.8 | ||
Majority | 2,862 | 6.4 | |||
Turnout | 44,840 | 75.3 | |||
Conservative hold | Swing | ||||
Party | Candidate | Votes | % | ±% | |
---|---|---|---|---|---|
Conservative | Kenneth Thompson | 28,014 | 53.59 | ||
Labour | Ian Isidore Levin | 24,262 | 46.41 | ||
Majority | 3,752 | 7.18 | |||
Turnout | 52,276 | 81.05 | |||
Conservative hold | Swing | ||||
Party | Candidate | Votes | % | ±% | |
---|---|---|---|---|---|
Conservative | Kenneth Thompson | 26,250 | 49.40 | ||
Labour | James Haworth | 21,983 | 41.37 | ||
Liberal | Ewart Heywood | 4,901 | 9.22 | ||
Majority | 4,267 | 8.03 | N/A | ||
Turnout | 53,134 | 83.07 | |||
Conservative gain from Labour | Swing | ||||
Party | Candidate | Votes | % | ±% | |
---|---|---|---|---|---|
Labour | James Haworth | 18,385 | 43.61 | ||
Conservative | Reginald Purbrick | 15,749 | 37.35 | ||
Liberal | Ernest Ronald Webster | 8,028 | 19.04 | ||
Majority | 2,636 | 6.26 | N/A | ||
Turnout | 42,162 | 69.55 | |||
Labour gain from Conservative | Swing | ||||
Party | Candidate | Votes | % | ±% | |
---|---|---|---|---|---|
Conservative | Reginald Purbrick | 22,623 | 61.64 | ||
Labour | Frederick Lees McGhee | 14,079 | 38.36 | ||
Majority | 8,544 | 23.28 | |||
Turnout | 36,702 | 64.24 | |||
Conservative hold | Swing | ||||
Party | Candidate | Votes | % | ±% | |
---|---|---|---|---|---|
Conservative | Reginald Purbrick | 31,135 | 73.57 | ||
Labour | F. A. P. Rowe | 11,183 | 26.43 | ||
Majority | 19,952 | 47.14 | |||
Turnout | 42.318 | 77.50 | |||
Conservative hold | Swing | ||||
Party | Candidate | Votes | % | ±% | |
---|---|---|---|---|---|
Conservative | John George Gibson | 3,492 | 58.3 | ||
Liberal | Augustine Birrell | 2,500 | 41.7 | ||
Majority | 992 | 16.6 | |||
Turnout | 5,992 | 78.0 | |||
Registered electors | 7,683 | ||||
Conservative win (new seat) |
Party | Candidate | Votes | % | ±% | |
---|---|---|---|---|---|
Conservative | John George Gibson | 2,872 | 63.1 | +4.8 | |
Liberal | Charles Hamilton Bromby | 1,681 | 36.9 | -4.8 | |
Majority | 1,191 | 26.2 | +9.6 | ||
Turnout | 4,553 | 59.3 | −18.7 | ||
Registered electors | 7,683 | ||||
Conservative hold | Swing | +4.8 | |||
Gibson was appointed Solicitor-General for Ireland, requiring a by-election.
Party | Candidate | Votes | % | ±% | |
---|---|---|---|---|---|
Conservative | John George Gibson | Unopposed | |||
Conservative hold | |||||
Gibson resigned after being appointed a Judge of the Queen's Bench Division in the High Court of Justice in Ireland, causing a by-election.
Party | Candidate | Votes | % | ±% | |
---|---|---|---|---|---|
Conservative | Miles Walker Mattinson | Unopposed | |||
Conservative hold | |||||
Party | Candidate | Votes | % | ±% | |
---|---|---|---|---|---|
Conservative | James Henry Stock | 3,707 | 59.8 | −3.3 | |
Liberal | Benjamin Ward Richardson | 2,493 | 40.2 | +3.3 | |
Majority | 1,214 | 19.6 | −6.6 | ||
Turnout | 6,200 | 68.9 | +9.6 | ||
Registered electors | 9,004 | ||||
Conservative hold | Swing | −3.3 | |||
Party | Candidate | Votes | % | ±% | |
---|---|---|---|---|---|
Conservative | James Henry Stock | Unopposed | |||
Conservative hold | |||||
Party | Candidate | Votes | % | ±% | |
---|---|---|---|---|---|
Conservative | James Henry Stock | Unopposed | |||
Conservative hold | |||||
Party | Candidate | Votes | % | ±% | |
---|---|---|---|---|---|
Conservative | F. E. Smith | 5,862 | 53.2 | N/A | |
Liberal | Edwin George Jellicoe | 5,153 | 46.8 | New | |
Majority | 709 | 6.4 | N/A | ||
Turnout | 11,015 | 74.0 | N/A | ||
Registered electors | 14,889 | ||||
Conservative hold | Swing | N/A | |||
Party | Candidate | Votes | % | ±% | |
---|---|---|---|---|---|
Conservative | F. E. Smith | 6,627 | 52.6 | -0.6 | |
Liberal | Francis L'Estrange Joseph | 5,513 | 43.8 | -3.0 | |
Independent Liberal | Edwin George Jellicoe | 451 | 3.6 | -43.2 | |
Majority | 1,114 | 8.8 | +2.4 | ||
Turnout | 12,591 | 80.4 | +6.4 | ||
Conservative hold | Swing | +1.2 | |||
Party | Candidate | Votes | % | ±% | |
---|---|---|---|---|---|
Conservative | F. E. Smith | 6,383 | 55.9 | +3.3 | |
Liberal | William Permewan | 5,039 | 44.1 | +0.3 | |
Majority | 1,344 | 11.8 | +3.0 | ||
Turnout | 11,422 | 72.9 | -7.5 | ||
Conservative hold | Swing | ||||
General Election 1914–15:
Another General Election was required to take place before the end of 1915. The political parties had been making preparations for an election to take place and by July 1914, the following candidates had been selected;
Party | Candidate | Votes | % | ±% | |
---|---|---|---|---|---|
C | Unionist | Warden Chilcott | 11,457 | 71.4 | +15.5 |
Labour | Robert Dixon Smith | 4,580 | 28.6 | New | |
Majority | 6,877 | 42.8 | +31.0 | ||
Turnout | 16,037 | 55.1 | −20.8 | ||
Registered electors | 29,128 | ||||
Unionist hold | Swing | N/A | |||
Cindicates candidate endorsed by the coalition government. |
Party | Candidate | Votes | % | ±% | |
---|---|---|---|---|---|
Unionist | Warden Chilcott | Unopposed | |||
Unionist hold | |||||
Party | Candidate | Votes | % | ±% | |
---|---|---|---|---|---|
Unionist | Warden Chilcott | Unopposed | |||
Unionist hold | |||||
Party | Candidate | Votes | % | ±% | |
---|---|---|---|---|---|
Unionist | Warden Chilcott | 13,387 | 55.3 | N/A | |
Labour | Tom Gillinder | 8,924 | 36.8 | New | |
Liberal | Samuel Skelton | 1,910 | 7.9 | New | |
Majority | 4,463 | 18.5 | N/A | ||
Turnout | 24,221 | 76.9 | N/A | ||
Registered electors | 31,482 | ||||
Unionist hold | Swing | N/A | |||
Party | Candidate | Votes | % | ±% | |
---|---|---|---|---|---|
Unionist | Reginald Purbrick | 16,623 | 42.7 | −12.6 | |
Labour | F. A. P. Rowe | 16,395 | 42.2 | +5.4 | |
Liberal | Glyn Howard Howard-Jones | 5,857 | 15.1 | +7.2 | |
Majority | 228 | 0.5 | −18.0 | ||
Turnout | 38,875 | 76.0 | −0.9 | ||
Registered electors | 51,175 | ||||
Unionist hold | Swing | −9.0 | |||
Walton is an area of Liverpool, England, north of Anfield and east of Bootle and Orrell Park. Historically in Lancashire, it is largely residential, with a diverse population.
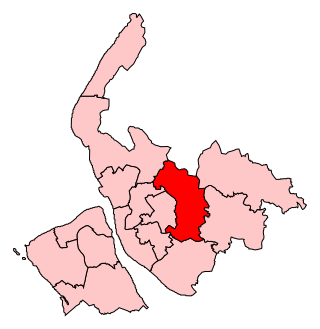
Liverpool, West Derby is a constituency represented in the House of Commons of the UK Parliament since 2019 by Ian Byrne of the Labour Party.
Blackpool South is a constituency in Lancashire, England which has been represented by Chris Webb of the Labour Party since a 2024 by-election.
Fylde has been a constituency in Lancashire which is represented in the House of Commons of the UK Parliament since 2010 by Mark Menzies, formerly of the Conservative Party, but now an Independent after the whip was withdrawn in April 2024, with allegations he misused campaign funds.
Bootle is a constituency which has been represented in the House of Commons of the UK Parliament, since 2015 by Peter Dowd of the Labour Party.
Crosby was a constituency in Merseyside, represented in the House of Commons of the Parliament of the United Kingdom from 1950 until 2010. It elected one Member of Parliament (MP) by the first past the post system of election.
Knowsley North and Sefton East was a county constituency represented in the House of Commons of the Parliament of the United Kingdom. It elected one Member of Parliament (MP) by the first past the post system of election.
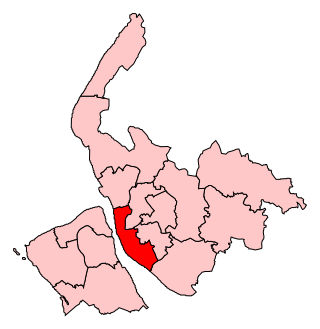
Liverpool Garston was a borough constituency represented in the House of Commons of the Parliament of the United Kingdom which existed from 1950 and 2010. It elected one Member of Parliament (MP) by the first past the post system of election.
Liverpool Riverside is a constituency represented in the House of Commons of the UK Parliament since 2019 by Kim Johnson, who is a member of the Labour Party.
Southport is a constituency in Merseyside which has been represented in the House of Commons of the UK Parliament since 2017 by Damien Moore of the Conservative Party.
North West Norfolk is a constituency represented in the House of Commons of the UK Parliament since 2019 by James Wild, a Conservative.
Knowsley is a constituency represented in the House of Commons of the UK Parliament since its 2010 creation by George Howarth of the Labour Party.
Sefton Central is a constituency represented by Bill Esterson of the Labour Party since 2010.
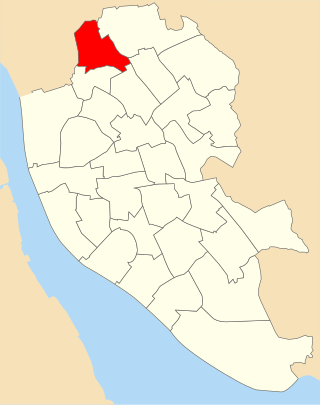
County ward is an electoral division of Liverpool City Council. The ward is within the Liverpool Walton Parliamentary constituency.
Warbreck ward was an electoral division of Liverpool City Council containing parts of the Walton and Orrell Park areas of Liverpool.
Norris Green ward is an electoral division of Liverpool City Council centred on the Norris Green district of Liverpool. The ward sits within the Liverpool West Derby and Liverpool Walton Parliamentary constituencies.
Fazakerley ward was an electoral division of Liverpool City Council between 1953 and 2022.
Clubmoor ward was an electoral division of Liverpool City Council in the Liverpool Walton Parliamentary constituency.
The 2023 Liverpool City Council election took place on 4 May 2023 to elect members of Liverpool City Council. Following a Boundary Review by The Local Government Boundary Commission for England, the size of the council was reduced from 90 to 85 seats with a change from three-member seats, elected in thirds, three years out of every four, following the British Government instigated Best Value Inspection Report which led to the appointment by the government of Commissioners and the subsequent boundary review for Council Wards in Liverpool which the government initiated with the proviso that the number of councillors be reduced and the predominant number of wards be reduced to single members with all-up elections every four years. The election also marked the end of Liverpool's directly-elected mayoralty. After the election the council reverted to having a leader of the council chosen from amongst the councillors instead. Labour retained control of the council and their group leader Liam Robinson became leader of the council after the election.
{{cite web}}
: Missing or empty |title=
(help)