MRI artifact

Last updated

An MRI artifact is a visual artifact (an anomaly seen during visual representation) in magnetic resonance imaging (MRI). It is a feature appearing in an image that is not present in the original object. [1] Many different artifacts can occur during MRI, some affecting the diagnostic quality, while others may be confused with pathology. Artifacts can be classified as patient-related, signal processing-dependent and hardware (machine)-related. [1]

Contents

Motion artifacts

Fig. 1. Motion artifact (T1 coronal study of cervical vertebrae). MRI with motion artifacts.jpg
Fig. 1. Motion artifact (T1 coronal study of cervical vertebrae).

A motion artifact is one of the most common artifacts in MR imaging. [2] Motion can cause either ghost images or diffuse image noise in the phase-encoding direction. The reason for mainly affecting data sampling in the phase-encoding direction is the significant difference in the time of acquisition in the frequency- and phase-encoding directions. [1] Frequency-encoding sampling in all the rows of the matrix (128, 256 or 512) takes place during a single echo (milliseconds). Phase-encoded sampling takes several seconds, or even minutes, owing to the collection of all the k-space lines to enable Fourier analysis. Major physiological movements are of millisecond to seconds duration and thus too slow to affect frequency-encoded sampling, but they have a pronounced effect in the phase-encoding direction. Periodic movements such as cardiac movement and blood vessel or CSF pulsation cause ghost images, while non-periodic movement causes diffuse image noise (Fig. 1). Ghost image intensity increases with amplitude of movement and the signal intensity from the moving tissue. Several methods can be used to reduce motion artifacts, including patient immobilisation, cardiac and respiratory gating, signal suppression of the tissue causing the artifact, choosing the shorter dimension of the matrix as the phase-encoding direction, view-ordering or phase-reordering methods and swapping phase and frequency-encoding directions to move the artifact out of the field of interest. [1]

Flow

Fig. 2. Flow-related signal loss in the carotid and basillary arteries (T2 axial study of the brain). MRI with flow-related signal loss.jpg
Fig. 2. Flow-related signal loss in the carotid and basillary arteries (T2 axial study of the brain).

Flow can manifest as either an altered intravascular signal (flow enhancement or flow-related signal loss), or as flow-related artifacts (ghost images or spatial misregistration). Flow enhancement, also known as inflow effect, is caused by fully magnetised protons entering the imaged slice while the stationary protons have not fully regained their magnetization. [1] The fully magnetized protons yield a high signal in comparison with the rest of the surroundings. High velocity flow causes the protons entering the image to be removed from it by the time the 180-degree pulse is administered. The effect is that these protons do not contribute to the echo and are registered as a signal void or flow-related signal loss (Fig. 2). [1] Spatial misregistration manifests as displacement of an intravascular signal owing to position encoding of a voxel in the phase direction preceding frequency encoding by time TE/2.The intensity of the artifact is dependent on the signal intensity from the vessel, and is less apparent with increased TE. [1]

Metal artifacts

Fig. 3. Metal-related artifacts. MRI with metal artifacts.jpg
Fig. 3. Metal-related artifacts.
Fig. 4. Metal-related artifacts. Head MRI with metal artifacts.jpg
Fig. 4. Metal-related artifacts.

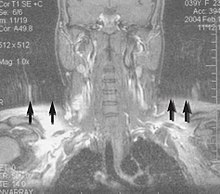
Metal artifacts occur at interfaces of tissues with different magnetic susceptibilities, which cause local magnetic fields to distort the external magnetic field. This distortion changes the precession frequency in the tissue leading to spatial mismapping of information. The degree of distortion depends on the type of metal (stainless steel having a greater distorting effect than titanium alloy), the type of interface (most striking effect at soft tissue-metal interfaces), pulse sequence and imaging parameters. Metal artifacts are caused by external ferromagnetics such as cobalt containing make-up, internal ferromagnetics such as surgical clips, spinal hardware and other orthopaedic devices, and in some cases, metallic objects swallowed by people with pica. [3] Manifestation of these artifacts is variable, including total signal loss, peripheral high signal and image distortion (Figs 3 and 4). [1] Reduction of these artifacts can be attempted by orientating the long axis of an implant or device parallel to the long axis of the external magnetic field, possible with mobile extremity imaging and an open magnet. Further methods used are choosing the appropriate frequency encoding direction, since metal artifacts are most pronounced in this direction, using smaller voxel sizes, fast imaging sequences, increased readout bandwidth and avoiding gradient-echo imaging when metal is present. A technique called MARS (metal artifact reduction sequence) applies an additional gradient, along the slice select gradient at the time the frequency encoding gradient is applied. ==Signal processing dependent artifacts== The ways in which the data are sampled, processed and mapped out on the image matrix manifest these artifacts. [1]

Chemical shift artifact

Fig. 5. Chemical shift artifact: bright and dark streaks around the kidneys in an axial gradientecho opposed-phase image. MRI with chemical shift artifact.jpg
Fig. 5. Chemical shift artifact: bright and dark streaks around the kidneys in an axial gradientecho opposed-phase image.

Chemical shift artifact occurs at the fat/water interface in the frequency encoding direction (Fig. 5). These artifacts arise due to the difference in resonance of protons as a result of their micromagnetic environment. The protons of fat resonate at a slightly lower frequency than those of water. High field strength magnets are particularly susceptible to this artifact. [1] Determination of the artifact can be made by swapping the phase- and frequency-encoding gradients and examining the resultant shift of fat tissue.

Partial volume

Partial volume artifacts arise from the size of the voxel over which the signal is averaged. Objects smaller than the voxel dimensions lose their identity, and loss of detail and spatial resolution occurs. Reduction of these artifacts is accomplished by using a smaller pixel size and/or a smaller slice thickness. [1]

Wrap-around

Fig. 6. Wrap-around artifacts. Head MRI with wrap around artifacts.jpg
Fig. 6. Wrap-around artifacts.
Fig. 7. Wrap-around artifacts. MRI with wrap around artifacts.jpg
Fig. 7. Wrap-around artifacts.

A wrap-around artifact also known as an aliasing artifact, is a result of mismapping of anatomy that lies outside the field of view but within the slice volume. [4] The selected field of view is smaller than the size of the imaged object. The anatomy is usually displaced to the opposite side of the image (Figs 6 and 7). It can be caused by non-linear gradients or by undersampling of the frequencies contained within the return signal. [1] The sampling rate must be twice the maximal frequency that occurs in the object (Nyquist sampling limit). If not, the Fourier transform will assign very low values to the frequency signals greater than the Nyquist limit. These frequencies will then ‘wrap around’ to the opposite side of the image, masquerading as low-frequency signals. In the frequency encode direction a filter can be applied to the acquired signal to eliminate frequencies greater than the Nyquist frequency. In the phase encode direction, artifacts can be reduced by an increasing number of phase encode steps (increased image time). For correction, a larger field of view may be chosen. [1]

Gibbs artifacts

Fig. 8. Gibbs artifact (T1 sagittal study of the brain). MRI with Gibbs artifacts.jpg
Fig. 8. Gibbs artifact (T1 sagittal study of the brain).

Gibbs artifacts or Gibbs ringing artifacts, also known as truncation artifacts are caused by the under-sampling of high spatial frequencies at sharp boundaries in the image. [5] [6] Lack of appropriate high-frequency components leads to an oscillation at a sharp transition known as a ringing artifact. It appears as multiple, regularly spaced parallel bands of alternating bright and dark signal that slowly fade with distance (Fig. 8). Ringing artifacts are more prominent in smaller digital matrix sizes. [1] Methods employed to correct Gibbs artifact include filtering the k-space data prior to Fourier transform, increasing the matrix size for a given field of view, the Gegenbauer reconstruction and Bayesian approach. [1]

This is a wide and still expanding subject. Only a few common artifacts are recognised. [1]

Radiofrequency (RF) quadrature

RF detection circuit failure arises from improper detector channel operation. Fourier-transformed data display a bright spot in the centre of the image. If one channel of the detector has a higher gain than the other it will result in object ghosting in the image. This is the result of a hardware failure and must be addressed by a service representative. [1]

External magnetic field (B0) inhomogeneity

Fig. 9. B0 inhomogeneity: intensity distortion across a T1 axial study of the lumbar vertebrae. MRI with B0 inhomogeneity.jpg
Fig. 9. B0 inhomogeneity: intensity distortion across a T1 axial study of the lumbar vertebrae.

B0 inhomogeneity leads to mismapping of tissues. Inhomogeneous external magnetic field causes either spatial, intensity, or both distortions. Intensity distortion occurs when the field in a location is greater or less than in the rest of the imaged object (Fig. 9). Spatial distortion results from long-range field gradients, which remain constant in the inhomogeneous field. [1]

Gradient field artifacts

Magnetic field gradients are used to spatially encode the location of signals from excited protons within the volume being imaged. The slice select gradient defines the volume (slice). Phase- and frequency-encoding gradients provide the information in the other two dimensions. Any deviation in the gradient would be represented as a distortion. [1] As the distance increases from the centre of the applied gradient, loss of field strength occurs at the periphery. Anatomical compression occurs and is especially pronounced on coronal and sagittal imaging. [1] When the phase-encoding gradient is different, the width or height of the voxel is different, resulting in distortion. Anatomical proportions are compressed along one or the other axis. Square pixels (and voxels) should be obtained. [1] Ideally the phase gradient should be assigned to the smaller dimension of the object and the frequency gradient to the larger dimension. In practice this is not always possible because of the necessity of displacing motion artifacts. [1] This may be corrected by reducing the field of view, by lowering the gradient field strength or by decreasing the frequency bandwidth of radio signal. If correction is not achieved, the cause might be either a damaged gradient coil or an abnormal current passing through the gradient coil. [1]

RF (B1) inhomogeneity

Variation in intensity across the image may be due to the failure of the RF coil, non-uniform B1 field, non-uniform sensitivity of the receive only coil (spaces between wire in the coil, uneven distribution of wire), or presence of non-ferromagnetic material in the imaged object. [1]

When using a FLASH sequence, tip angle variations due to B1 inhomogeneity can affect the contrast of the image. Similarly, for inversion recovery pulses, and other T1-dependent methods, will suffer from signal intensity errors and generally lower T1 weighting. [7] This is due to imperfect flip angles throughout the slice, but particularly around the edges of the body, resulting in imperfect magnetization recovery.

RF tip angle theory vs reality

Human body is full of protons and during imaging, the B0 field aligns these individual protons to a net magnetization in the direction of the magnetic field. An RF pulse that is applied perpendicular to the main magnetic field flips the spins to a desired angle. This flip angle scales with the B1 field amplitude. [8] Accurate flip angle is crucial because the measured MR signals depend on the flip angle of the protons. However, this theory assumes that the B1 field is homogenous and, therefore, all spins in a slice are flipped an equal amount.

In reality, different areas of a slice see different radio frequency fields, leading to different flip angles. One reason this occurs is because the RF wavelength is inversely proportional to B0. So RF wavelength decreases when B0 increases. At B0 fields of 1.5T, RF wavelengths are long compared to the size of the body. [9] But as the main magnetic field is increased, these wavelengths become the same or smaller than the regions of the body being imaged, resulting in flip angle inhomogeneity. In the images of a healthy patient's brain, it can be visually seen how inhomogeneous the fields are at 3T and 7T. [10]

On a side note, this isn't the only cause of B1 inhomogeneity. It could also be due to the RF pulse design, B0 field inhomogeneity, or even patient movement. [11]

Asymmetrical brightness

There is a uniform decrease in signal intensity along the frequency encoding axis. Signal drop-off is due to filters that are too tight about the signal band. Some of the signal generated by the imaged section is, thereby, inappropriately rejected. A similar artifact may be caused by non-uniformity in slice thickness. [1]

RF noise

RF pulses and precessional frequencies of MRI instruments occupy the same frequency bandwidth as common sources such as TV, radio, fluorescent lights and computers. Stray RF signals can cause various artifacts. Narrow-band noise is projected perpendicular to the frequency- encoding direction. Broadband noise disrupts the image over a much larger area. Appropriate site planning, proper installation and RF shielding (Faraday cage) eliminate stray RF interference. [1]

Zero line and star artifacts

A bright linear signal in a dashed pattern that decreases in intensity across the screen and can occur as a line or star pattern, depending on the position of the patient in the ‘phase-frequency space’. [1] Zero line and star artifacts are due to system noise or any cause of RF pollution within the room (Faraday cage). If this pattern persists, check for sources of system noise such as bad electronics or alternating current line noise, loose connections to surface coils, or any source of RF pollution. If a star pattern is encountered, the manufacturer needs to readjust the system software so that the image is moved off the zero point. [1]

Zipper artifacts

Although less common, zippers are bands through the image centre due to an imperfect Faraday cage, with RF pollution in, but originating from outside, the cage. [12] Residual free induction decay stimulated echo also causes zippers. [1]

Bounce point artifact

Fig. 10. Surface coil artifact: high signal at anterior thoracic wall adjacent to surface coil. MRI with surface coil artifact.jpg
Fig. 10. Surface coil artifact: high signal at anterior thoracic wall adjacent to surface coil.

Absence of signal from tissues of a particular T1 value is a consequence of magnitude sensitive reconstruction in inversion recovery imaging. When the chosen T1 equals 69% of the T1 value of a particular tissue, a bounce point artifact occurs. [1] Use phase-sensitive reconstruction inversion recovery techniques.

Surface coil artifacts

Close to the surface coil the signals are very strong resulting in a very intense image signal (Fig. 10). [1] Further from the coil the signal strength drops rapidly due to the attenuation with a loss of image brightness and significant shading to the uniformity. Surface coil sensitivity intensifies problems related to RF attenuation and RF mismatching.

Slice-to-slice interference

Fig. 11. Slice-to-slice interference (T1 axial study of lumbar vertebrae). MRI with slice-to-slice interference.jpg
Fig. 11. Slice-to-slice interference (T1 axial study of lumbar vertebrae).

Non-uniform RF energy received by adjacent slices during a multi-slice acquisition is due to cross-excitation of adjacent slices with contrast loss in reconstructed images (Fig. 11). To overcome these interference artifacts, the acquisition of two independent sets of gapped multi-slice images need to be included, and subsequently reordered during display of the full image set. [1]

Artifact correction

Motion correction

Gating

Gating, also known as triggering, is a technique that acquires MRI data at a low motion state. An example of this could be acquiring an MRI slice only when the lung capacity is low (i.e. between large breaths). Gating is a very simple solution that can have a very large result. Gating is best suited for mitigating breathing and cardiac artifacts. This is because these types of motion are repetitive, so we can leverage triggering acquisitions in a ‘low motion state’. Gating is used for cine imaging, MRA, free-breathing chest scans, CSF flow imaging, and more. [13]

In order to gate correctly, the system needs to have knowledge of the patient's cardiac motion and breathing pattern. This is commonly done by using a pulse oximeter or EKG sensor to read a cardiac signal and/or a bellows to read the breathing signal. A big disadvantage to gating is ‘dead time’, defined as time wasted due to waiting for a high motion state to pass. For example, we do not want to acquire an MRI image while someone is in the process of inhaling, since this would be a high motion state. So, we have many time periods where we are waiting for a high motion state to pass. This is even more prominent when we consider respiratory and cardiac gating together. The windows of time where the respiratory and cardiac motions are low are very infrequent, leading to high dead times. However, the advantage is that images acquired with both cardiac and respiratory gating have a significant improvement in image quality. [13]

Pilot tone

The Pilot Tone method involves turning on a constant RF frequency to detect patient motion. More specifically, the MRI machine will detect the pilot tone signal when acquiring an image. The strength of the pilot tone signal at every TR will be proportional to the breathing/motion patterns of the patient. That is, the patient's movements will cause the received constant RF tone to be amplitude modulated. A very large advantage to the pilot tone is that it requires no contact with the patient. Extracting a breathing signal using a pilot tone is simple in theory: One must place a constant frequency signal near the MRI bore, acquire an image, and take an FFT along the readout direction to extract the pilot tone. Technical considerations include choosing the RF frequency. The pilot tone must be detectable by the MRI machine, however must be carefully chosen not to interfere with the MRI image. The pilot tone shows up as a zipper (for a cartesian acquisition). [14]

The location of that line is determined by the frequency of the RF tone. For this reason, pilot tone acquisitions usually have slightly large FOVs, to make room for the pilot tone. Once an image has been acquired, the pilot tone signal can be extracted by taking the FFT along the readout direction and plotting the amplitude of the resulting signal. The pilot tone will show up as a line (of varying amplitude) when taking an FFT along the readout direction. The pilot tone method can also be used prospectively to acquire cardiac images. [15]

The Pilot Tone method is great for detecting respiratory motion artifacts. This is because there is a very large and distinct modulation due to human breathing patterns. Heart signals are much more subtle and difficult to detect using a pilot tone. Retrospective techniques using the pilot tone are able to increase the level of detail and reduce blurring in free-breathing radial images. [14]

TAMER

Targeted Motion Estimation and Reduction (TAMER) is a retrospective motion correction method developed by Melissa Haskell, Stephen Cauley, and Lawrence Wald. The method was first introduced in their paper Targeted Motion Estimation and Reduction (TAMER): Consistency Based Motion Mitigation for MRI using a Reduced Model Joint Optimization, as part of the IEEE Transactions on Medical Imaging Journal. [16] The method corrects motion-related artifacts by acquiring a joint estimation of the desired motion-free image and the associated motion trajectory by minimizing the data consistency error of a SENSE forward model that includes rigid-body subject motion. [16]

Preliminaries

The TAMER Method utilizes the SENSE forward model (described below) that has been modified to include the effects of motion in a 2D multi-shot imaging sequence. Note: the following modified SENSE model is described in detail in Melissa Haskell's doctoral dissertation, Retrospective Motion Correction for Magnetic Resonance Imaging. [17]

Suppose that we have coils. Let be a column vector of image voxel values where is the number of k space samples acquired per shot and let be the signal data from coils. Let encoding matrix for a given patient motion trajectory vector, . is composed of many sub-matrices (encoding matrices for each shot ).

For each shot , we have the sub-matrix which is the encoding matrix for that particular shot where:

is the under-sampling operator

is the Fourier Encoding Operator

is the in-place translation operator

is the through-plane translation operator

is the rotation operator

SENSE Motion Forward Model:

SENSE model Extended to describe a 2D multi-shot imaging sequence:

The rigid-body motion forward model is nonlinear and the process of solving for estimations of both the motion trajectory and the image volume is computationally challenging and time-consuming. In the effort to speed up and simplify computations, the TAMER method separates the vector of image voxel values, , into a vector of target voxel values, , and a vector of fixed voxels, . Given any choice of target voxels and fixed voxels, we have the following:

Note: The length of only makes up about 5% of the total length of .

Now the optimization can be reduced to fitting the signal contribution of the target voxels to the correct target voxel values and the correct motion, .

TAMER Algorithm

The TAMER algorithm has 3 main stages: Initialization, Jumpstart of Motion Parameter Search, and the Joint Optimization Reduced Model Search.

Initialization: The first stage of the TAMER algorithm acquires the initial reconstruction of the full image volume, , by assuming that all motion parameters are zero. One can solve for by minimizing the least squared error of the SENSE forward model without motion i.e. solve the system where and is the conjugate transpose of . [16] We have discussed the notion of separating the sense model into ; however, we haven't yet discussed how the target voxels are chosen. Voxels that are strongly coupled together indicate motion. In a motion-free Cartesian acquisition, each voxel would only be coupled to itself, so our goal is to essentially un-couple these voxels. As described in the paper Targeted Motion Estimation and Reduction (TAMER): Consistency Based Motion Mitigation for MRI using a Reduced Model Joint Optimization, as part of the IEEE Transactions on Medical Imaging Journal, the TAMER algorithm converges fastest when choosing target voxels that are highly coupled. [16] The target voxels can be entirely determined by the sequence parameters and coil sensitivities. [16]

Target Voxel Selection Process:

  1. Group coils based on artifact properties. The model error is first computed assuming no motion. The model correlation is then computed across all channels. TAMER is applied to groups of coils with the largest correlation artifacts to attain the motion and image estimation. [17]
  2. The initial target voxels are selected by first choosing a root voxel (generally the center of the image). Once the root voxel is chosen, the correlation between the root voxel and all other voxels is determined by attaining the column vector of the correlation matrix corresponding to the root voxel. The magnitude of the entries in this column vector represent the strength of interaction between the root voxel and all of the other voxels. [16] The root voxel along with the voxels that have the strongest interaction with the root voxel are then chosen to be the initial target voxels.

Note: For each iteration of the TAMER process, the target voxels are selected by shifting the target voxels from the previous iteration perpendicularly to the phase encode direction by a preset amount.

Jumpstart of Motion Parameter Search:

Now the initial guess of the patient's motion is determined by evaluating the data consistency metric over a range of values for each of the motion parameters and the best value for each parameter is selected to construct the initial guess. [17]

Joint Optimization Reduced Model Search:

We now have the initial target voxels, motion estimate, and coil groupings. The following procedure is now executed.

Let be the motion trajectory estimate for the search step. Let be the max number of iterations.

While repeat the following:

  1. Solve for
  2. Solve for
  3. Set
  4. Set
  5. Set

TAMER: Advantages and Disadvantages

Advantages:

  • TAMER retrospectively corrects for motion, so modifications to the MRI exam procedure isn't necessary.
  • TAMER doesn't alter the acquisition procedure, so it can be easily integrated into current clinical MRI scans.  
  • TAMER significantly reduces computation of the joint optimization model used to estimate motion parameters and image voxels.

Disadvantages:

  • Current TAMER implementations have lengthy overall computation times.
  • TAMER requires multi-channel data as the motion parameters need additional degrees of freedom which is provided by the multichannel acquisition. [16]
  • The TAMER algorithm assumes static coil profiles that don't change with the motion of the patient. This assumption would be an issue for larger motion.

Neural network approaches

In recent years, neural networks have generated a great deal of interest by outperforming traditional methods [18] on longstanding problems across many fields. Machine learning, and by extension neural networks, have been used in many facets of MRI [19] — for instance, speeding up image reconstruction, or improving reconstruction quality when working with a lack of data. [20] [21] Neural networks have also been used in motion artifact correction thanks to their ability to learn visual information from data, [18] as well as infer underlying, latent representations in data. [22]

NAMER

Network Accelerated Motion Estimation and Reduction (NAMER) [23] is a retrospective motion correction technique that utilizes convolutional neural networks (CNNs), a class of neural networks designed to process and learn from visual information such as images. This is a follow-up from the authors of the TAMER paper titled Network Accelerated Motion Estimation and Reduction (NAMER): Convolutional neural network guided retrospective motion correction using a separable motion model. [23] Similar to TAMER, the paper aims to correct for motion-related artifacts by way of estimating a desired motion-free image and optimizing parameters for a SENSE forward model describing the relationship between raw k-space data and image space while factoring in rigid motion.

Setup

A SENSE forward model is used to induce synthetic motion artifacts in raw k-space data, allowing us access to both data with motion artifacts, as well as the ground-truth image without motion artifacts. This is important to the NAMER technique, because it utilizes a Convolutional Neural Network (CNN) to frontload image estimation and guide model parameter estimation. Convolutional Neural Networks leverage convolution kernels to analyze visual imagery. Here, a 27-layer network is used with multiple convolution layers, batch normalization, and ReLU activations. It uses a standard ADAM optimizer. [24]

Image Estimation

The CNN attempts to learn the image artifacts from the motion-corrupted input data . The estimate for these artifacts, denoted as , are then subtracted from the motion-corrupted input data in order to produce a best estimate for the motion-free image: [23]

This serves two purposes: First, it allows the CNN to perform backpropagation and update its model weights by using a mean square error loss function comparing the difference between and the known ground-truth motion-free image. [23] Second, it gives us a good estimate of the motion-free image that gives us a starting point for model parameter optimization.

SENSE model parameter optimization

Using a CNN effectively allows us to bypass the second stage of TAMER by skipping the joint parameter search. This means that we can focus on solely estimating motion parameters . Because is really a vector of multiple, independent parameters, we can parallelize our optimization by estimating each parameter separately. [23]

Optimizing the Optimization Procedure

Before, we used the following to optimize both the image and parameters at once. Now, we can optimize solely the values:

On top of this, if a multi-shot acquisition was performed, we can estimate the parameters for each of shots separately, and go even further by estimating the parameters for each line in each shot : [23]

This allows us to massively reduce computation time, from around 50 minutes with TAMER [16] to just 7 minutes with NAMER. [23]

Reconstruction

The new model parameters are then used in a standard Least Squares optimization problem to reconstruct an image that minimizes the distance between the k-space data, and the result of applying the SENSE forward model under our new parameter estimate to our best estimate for the motion-free image: [23]

This process is repeated until a desired number of time steps, or when the change in reconstructed image is sufficiently low. The NAMER technique has shown itself to be very effective in correcting for rigid motion artifacts, and converges much faster than other methods including TAMER. [23] This illustrates the power of deep learning in improving results across myriad fields.

Generative adversarial networks

Other more advanced techniques take advantage of generative adversarial networks (GANs) which aim to learn the underlying latent representation of data in order to synthesize new examples that are indistinguishable from real data. Here, two neural networks, a Generator Network and a Discriminator Network, are modelled as agents competing in a game. The Generator Network's goal is to produce synthetic images that are as close as possible to images from the true distribution, while the Discriminator Network's goal is to distinguish generated synthetic images from the true data distribution. Specific to motion artifact correction in MRI, the Generator Network takes in an image with motion artifacts, and outputs an image without motion artifacts. The Discriminator Network then differentiates between the synthesized image and ground truth data. Various studies [25] [26] have shown that GANs perform very well in correcting for motion artifacts.

RF (B1) Inhomogeneity Correction

External Objects

B1 inhomogeneity due to constructive or destructive interference from the permittivity of body tissue can be mitigated using external objects with high dielectric constants and low conductivity. [27] These objects, called radiofrequency/dielectric cushion, can be placed over or near the imaging slice to improve B1 homogeneity. The combination of high dielectric constant and having low conductivity allows the cushion to alter the phase of the RF standing waves and has been shown to reduce signal loss due to B1 inhomogeneity. This correction method was shown to have the greatest effect on sequences that suffer from B1 inhomogeneity artifacts but has no effect on those with B0 inhomogeneity. In one study, the dielectric cushion improved image quality for turbo spin echo‐based T2‐weighted sequences but not on gradient echo‐based T2‐weighted sequences. [27]

Coil Mitigated Corrections

B1 inhomogeneity has been successfully mitigated by adjusting coil type and configurations.

Reducing the number of coils

One method is as simple as using the same transmit and receive coil to improve homogeneity. [28] This method exploits the tradeoff between B1 dependence and coil sensitivity dependence in FLASH sequences and allows the user to select an optimized flip angle that will reduce B1 dependence. By using the same coil for transmitting and receiving, the receiver coil sensitivity can offset some of the nonuniformities in the transmitter coil, reducing the overall RF inhomogeneity. For anatomical studies using the FLASH sequence that can be performed with one transmit and receive coil, this method can be used to reduce B1 inhomogeneity artifacts. However, the method would not be suitable for exams under strict time constraints, since the user first needs to perform flip angle optimization.

Coil excitation

Modifying the field distribution within the RF coils will create a more homogenous field. This can be done by changing the way that the RF coil is driven and excited. One method uses a four-port RF excitation that applies different phase shifts at each port. [29] By implementing a four-port drive, the power requirement is decreased by 2, SNR is increased by √2, and the overall B1 homogeneity is improved.

Spiral coil

Changing the shape of the coils can be used to reduce B1 inhomogeneity artifacts. The use of spiral coil instead of standard coils at higher fields has been shown to eliminate the effects of standing waves in larger samples. [30] This method can be effective when imaging large samples at 4T or higher; however, the proper equipment is required to implement this correction method. Unlike post-processing or sequence modulations, changing the coil shape is not feasible in all scanners.

Parallel excitation with coils

Another method to correct for B1 inhomogeneity is to employ the infrastructure in place from a parallel system to generate multiple RF pulses of lower flip angles that, together, can result in the same flip angle as that created using a single transmit coil. [31] This method uses the multiple transmit coils from parallel imaging systems to reduce and better mitigate the RF power deposition by relying on shorter RF pulses. One advantage of using parallel excitation with coils is the potential to reduce scan time by combining the multiple short RF pulses and the parallel imaging capabilities to cut scan time. Overall, when this method is used with the correct selection of RF pulses and optimized for a low power deposition, the artifacts from B1 inhomogeneity can be greatly reduced.

Active Power modulation

Actively modulating the RF transmit power for each slice position compensates for B1 inhomogeneity. [32] This method focuses on inhomogeneity along the axial, or z axis, direction since it is the most dominant in terms of poor homogeneity and least sample dependent.

Prior to inhomogeneity correction, measurement of the B1 profile along the z-axis of the coil is necessary for calibration. Once calibrated, the B1 data can be used for active transmit power modulation. For a specific pulse sequence, the values of each slice position are pre-determined and the appropriate RF transmitter power scale values are read from a look-up table. Then, while the sequence runs, a real time slice counter varies the attenuation of the RF transmit power. [32]

This method is advantageous for reducing artifacts at the source, particularly when accurate flip angle is critical and for increasing signal to noise ratio. Even though this technique can only be used to compensate for the B1 variation along the z-axis in axially acquired images, it's still significant since B1 inhomogeneity is most dominant along this axis.

B1 insensitive adiabatic pulses

One way to achieve perfect spin inversion despite B1 inhomogeneity is to use adiabatic pulses. This correction method works by removing the source of the problem and applying pulses that will not generate flip angle errors. Specific sequences that employ adiabatic pulses for increased flip angle uniformity include a slice selective spin-echo pulse, adiabatic 180 degrees inversion RF pulses, and 180 degrees refocusing pulses. [33] [34] [35]

Image post-processing

Post-processing techniques correct for intensity inhomogeneity (IIH) of the same tissue over an image domain. This method applies a filter to the data, typically based on a pre-acquired IIH map of the B1 field. If a map of the IIH in the image domain is known, then the IIH can be corrected by division into the pre-acquired image. [36] This popular model in describing the IIH effect is:

  • [36]

Where is the measured intensity, is the true intensity, is the IIH effect and ξ is the noise.

This method is advantageous because it can be conducted offline, i.e., the patient is not required to be in the scanner. Therefore, correction time is not an issue. However, this technique does not improve SNR and contrast of the image because it only utilizes information that was already acquired. Since the B1 field was not homogeneous when the images were acquired, the flip angles and subsequent acquired signals are imprecise.

The effects of an AI-based image post-scan processing denoising system in brain scans have been demonstrated to be effective in higher image quality and morphometric analysis. Post-scan image processing systems enable noise reduction while retaining contrast. The subsequent image enhancement can be processed with shorter scan times for higher throughput and plausible earlier detection. [37] [38]

B1 mapping techniques for image post-processing corrections

To correct RF inhomogeneity artifacts using post-processing corrections, there are a few methods to map the B1 field. Here is a short description of some common techniques.

Double angle method

A common and robust method that uses the results from two images acquired at flip angles of and . [39] The B1 map is then constructed using a ratio of the signal intensities of these two images. This method, although robust and accurate, requires a long TR and long scan time; therefore, the method is not optimal for imaging regions susceptible to motion.

Phase map method

Similar to the double angle method, the phase map method uses two images; however, this method relies on the accrual of phase to determine the real flip angle of each spin. [40] After applying a 180 degree rotation about the x-axis followed by a 90 degree rotation about the y axis, the resulting phase is then used to map the B1 field. By obtaining two images and subtracting one from the other, any phase from B0 inhomogeneity can be removed and only phase accumulated by the inhomogeneous RF field will be mapped. This method can be used to map 3D volumes but requires a long scan time, making it unsuitable for some scanning requirements.

Dual Refocusing Echo Acquisition Mode (DREAM)

This method is a multislice B1 mapping technique. DREAM can be used to acquire a 2D B1 map in 130 ms, making it insensitive to motion and feasible for scans that require breath holds, such as cardiac imaging. [41] The short acquisition also reduces effects of chemical shifts and susceptibility. Additionally, this method requires low SAR rates. Although not as accurate as the double angle method, DREAM achieves reliable B1 mapping during short acquisitions. T

Related Research Articles

<span class="mw-page-title-main">Magnetic resonance imaging</span> Medical imaging technique

Magnetic resonance imaging (MRI) is a medical imaging technique used in radiology to form pictures of the anatomy and the physiological processes of the body. MRI scanners use strong magnetic fields, magnetic field gradients, and radio waves to generate images of the organs in the body. MRI does not involve X-rays or the use of ionizing radiation, which distinguishes it from computed tomography (CT) and positron emission tomography (PET) scans. MRI is a medical application of nuclear magnetic resonance (NMR) which can also be used for imaging in other NMR applications, such as NMR spectroscopy.

<span class="mw-page-title-main">Functional magnetic resonance imaging</span> MRI procedure that measures brain activity by detecting associated changes in blood flow

Functional magnetic resonance imaging or functional MRI (fMRI) measures brain activity by detecting changes associated with blood flow. This technique relies on the fact that cerebral blood flow and neuronal activation are coupled. When an area of the brain is in use, blood flow to that region also increases.

<span class="mw-page-title-main">Diffusion MRI</span> Method of utilizing water in magnetic resonance imaging

Diffusion-weighted magnetic resonance imaging is the use of specific MRI sequences as well as software that generates images from the resulting data that uses the diffusion of water molecules to generate contrast in MR images. It allows the mapping of the diffusion process of molecules, mainly water, in biological tissues, in vivo and non-invasively. Molecular diffusion in tissues is not random, but reflects interactions with many obstacles, such as macromolecules, fibers, and membranes. Water molecule diffusion patterns can therefore reveal microscopic details about tissue architecture, either normal or in a diseased state. A special kind of DWI, diffusion tensor imaging (DTI), has been used extensively to map white matter tractography in the brain.

<span class="mw-page-title-main">Magnetic resonance angiography</span> Group of techniques based on magnetic resonance imaging (MRI) to image blood vessels.

Magnetic resonance angiography (MRA) is a group of techniques based on magnetic resonance imaging (MRI) to image blood vessels. Magnetic resonance angiography is used to generate images of arteries in order to evaluate them for stenosis, occlusions, aneurysms or other abnormalities. MRA is often used to evaluate the arteries of the neck and brain, the thoracic and abdominal aorta, the renal arteries, and the legs.

In MRI and NMR spectroscopy, an observable nuclear spin polarization (magnetization) is created by a homogeneous magnetic field. This field makes the magnetic dipole moments of the sample precess at the resonance (Larmor) frequency of the nuclei. At thermal equilibrium, nuclear spins precess randomly about the direction of the applied field. They become abruptly phase coherent when they are hit by radiofrequency (RF) pulses at the resonant frequency, created orthogonal to the field. The RF pulses cause the population of spin-states to be perturbed from their thermal equilibrium value. The generated transverse magnetization can then induce a signal in an RF coil that can be detected and amplified by an RF receiver. The return of the longitudinal component of the magnetization to its equilibrium value is termed spin-latticerelaxation while the loss of phase-coherence of the spins is termed spin-spin relaxation, which is manifest as an observed free induction decay (FID).

<span class="mw-page-title-main">Spin echo</span> Response of spin to electromagnetic radiation

In magnetic resonance, a spin echo or Hahn echo is the refocusing of spin magnetisation by a pulse of resonant electromagnetic radiation. Modern nuclear magnetic resonance (NMR) and magnetic resonance imaging (MRI) make use of this effect.

During nuclear magnetic resonance observations, spin–lattice relaxation is the mechanism by which the longitudinal component of the total nuclear magnetic moment vector (parallel to the constant magnetic field) exponentially relaxes from a higher energy, non-equilibrium state to thermodynamic equilibrium with its surroundings (the "lattice"). It is characterized by the spin–lattice relaxation time, a time constant known as T1.

<i>k</i>-space in magnetic resonance imaging

In magnetic resonance imaging (MRI), the k-space or reciprocal space is obtained as the 2D or 3D Fourier transform of the image measured. It was introduced in 1979 by Likes and in 1983 by Ljunggren and Twieg.

In vivo magnetic resonance spectroscopy (MRS) is a specialized technique associated with magnetic resonance imaging (MRI).

<span class="mw-page-title-main">Nuclear magnetic resonance</span> Spectroscopic technique based on change of nuclear spin state

Nuclear magnetic resonance (NMR) is a physical phenomenon in which nuclei in a strong constant magnetic field are perturbed by a weak oscillating magnetic field and respond by producing an electromagnetic signal with a frequency characteristic of the magnetic field at the nucleus. This process occurs near resonance, when the oscillation frequency matches the intrinsic frequency of the nuclei, which depends on the strength of the static magnetic field, the chemical environment, and the magnetic properties of the isotope involved; in practical applications with static magnetic fields up to ca. 20 tesla, the frequency is similar to VHF and UHF television broadcasts (60–1000 MHz). NMR results from specific magnetic properties of certain atomic nuclei. Nuclear magnetic resonance spectroscopy is widely used to determine the structure of organic molecules in solution and study molecular physics and crystals as well as non-crystalline materials. NMR is also routinely used in advanced medical imaging techniques, such as in magnetic resonance imaging (MRI). The original application of NMR to condensed matter physics is nowadays mostly devoted to strongly correlated electron systems. It reveals large many-body couplings by fast broadband detection and it should not to be confused with solid state NMR, which aims at removing the effect of the same couplings by Magic Angle Spinning techniques.

<span class="mw-page-title-main">Physics of magnetic resonance imaging</span> Overview article

Magnetic resonance imaging (MRI) is a medical imaging technique mostly used in radiology and nuclear medicine in order to investigate the anatomy and physiology of the body, and to detect pathologies including tumors, inflammation, neurological conditions such as stroke, disorders of muscles and joints, and abnormalities in the heart and blood vessels among others. Contrast agents may be injected intravenously or into a joint to enhance the image and facilitate diagnosis. Unlike CT and X-ray, MRI uses no ionizing radiation and is, therefore, a safe procedure suitable for diagnosis in children and repeated runs. Patients with specific non-ferromagnetic metal implants, cochlear implants, and cardiac pacemakers nowadays may also have an MRI in spite of effects of the strong magnetic fields. This does not apply on older devices, and details for medical professionals are provided by the device's manufacturer.

<span class="mw-page-title-main">Real-time MRI</span> Type of MRI

Real-time magnetic resonance imaging (RT-MRI) refers to the continuous monitoring ("filming") of moving objects in real time. Because MRI is based on time-consuming scanning of k-space, real-time MRI was possible only with low image quality or low temporal resolution. Using an iterative reconstruction algorithm these limitations have recently been removed: a new method for real-time MRI achieves a temporal resolution of 20 to 30 milliseconds for images with an in-plane resolution of 1.5 to 2.0 mm. Real-time MRI promises to add important information about diseases of the joints and the heart. In many cases MRI examinations may become easier and more comfortable for patients.

<span class="mw-page-title-main">Quantitative susceptibility mapping</span>

Quantitative susceptibility mapping (QSM) provides a novel contrast mechanism in magnetic resonance imaging (MRI) different from traditional susceptibility weighted imaging. The voxel intensity in QSM is linearly proportional to the underlying tissue apparent magnetic susceptibility, which is useful for chemical identification and quantification of specific biomarkers including iron, calcium, gadolinium, and super paramagnetic iron oxide (SPIO) nano-particles. QSM utilizes phase images, solves the magnetic field to susceptibility source inverse problem, and generates a three-dimensional susceptibility distribution. Due to its quantitative nature and sensitivity to certain kinds of material, potential QSM applications include standardized quantitative stratification of cerebral microbleeds and neurodegenerative disease, accurate gadolinium quantification in contrast enhanced MRI, and direct monitoring of targeted theranostic drug biodistribution in nanomedicine.

The problem of reconstructing a multidimensional signal from its projection is uniquely multidimensional, having no 1-D counterpart. It has applications that range from computer-aided tomography to geophysical signal processing. It is a problem which can be explored from several points of view—as a deconvolution problem, a modeling problem, an estimation problem, or an interpolation problem.

<span class="mw-page-title-main">Phase contrast magnetic resonance imaging</span>

Phase contrast magnetic resonance imaging (PC-MRI) is a specific type of magnetic resonance imaging used primarily to determine flow velocities. PC-MRI can be considered a method of Magnetic Resonance Velocimetry. It also provides a method of magnetic resonance angiography. Since modern PC-MRI is typically time-resolved, it provides a means of 4D imaging.

Adiabatic radio frequency (RF) pulses are used in magnetic resonance imaging (MRI) to achieve excitation that is insensitive to spatial inhomogeneities in the excitation field or off-resonances in the sampled object.

Synthetic MRI is a simulation method in Magnetic Resonance Imaging (MRI), for generating contrast weighted images based on measurement of tissue properties. The synthetic (simulated) images are generated after an MR study, from parametric maps of tissue properties. It is thereby possible to generate several contrast weightings from the same acquisition. This is different from conventional MRI, where the signal acquired from the tissue is used to generate an image directly, often generating only one contrast weighting per acquisition. The synthetic images are similar in appearance to those normally acquired with an MRI scanner.

Ghosting is a visual artifact that occurs in magnetic resonance imaging (MRI) scans. This artifact can be a consequence of environmental factors or the human body. Ghosting is a multidimensional artifact that occurs in the MRI in the phase encoded direction after applying the Fourier transform.

<span class="mw-page-title-main">MRI pulse sequence</span>

An MRI pulse sequence in magnetic resonance imaging (MRI) is a particular setting of pulse sequences and pulsed field gradients, resulting in a particular image appearance.

Magnetic resonance fingerprinting (MRF) is methodology in quantitative magnetic resonance imaging (MRI) characterized by a pseudo-randomized acquisition strategy. It involves creating unique signal patterns or 'fingerprints' for different materials or tissues after which a pattern recognition algorithm matches these fingerprints with a predefined dictionary of expected signal patterns. This process translates the data into quantitative maps, revealing information about the magnetic properties being investigated.

References

  1. 1 2 3 4 5 6 7 8 9 10 11 12 13 14 15 16 17 18 19 20 21 22 23 24 25 26 27 28 29 30 31 32 33 34 35 36 37 38 39 40 41 42 43 Erasmus LJ, Hurter D, Naudé M, Kritzinger HG, Acho S (2004). "A short overview of MRI artifacts". South African Journal of Radiology. 8 (2): 13. doi: 10.4102/sajr.v8i2.127 . ISSN   2078-6778. (CC-BY 4.0)
  2. Zaitsev M, Maclaren J, Herbst M (October 2015). "Motion artifacts in MRI: A complex problem with many partial solutions". Journal of Magnetic Resonance Imaging. 42 (4): 887–901. doi:10.1002/jmri.24850. PMC   4517972 . PMID   25630632.
  3. "Doctors pull out 38 metal objects including keys, coins, a SIM card, pencil sharpener blade and a magnet 'they were stuck to' from inside man's stomach | NEWS.am Medicine - All about health and medicine". med.news.am. Retrieved 2019-03-16.
  4. Yeung J. "Aliasing in MRI | Radiology Reference Article | Radiopaedia.org". Radiopaedia. Retrieved 26 May 2019.
  5. Bashir U. "Gibbs and truncation artifacts | Radiology Reference Article | Radiopaedia.org". Radiopaedia. Retrieved 26 May 2019.
  6. Ferreira PF, Gatehouse PD, Mohiaddin RH, Firmin DN (May 2013). "Cardiovascular magnetic resonance artefacts". Journal of Cardiovascular Magnetic Resonance. 15 (1): 41. doi: 10.1186/1532-429X-15-41 . PMC   3674921 . PMID   23697969.
  7. Kingsley, PB; Ogg, RJ; Reddick, WE; Steen, RG (1998). "Correction of errors caused by imperfect inversion pulses in MR imaging measurement of T1 relaxation times". Magn Reson Imaging. 16 (9): 1049–1055. doi: 10.1016/s0730-725x(98)00112-x . PMID   9839989.
  8. Nishimura, Dwight (2016). Principles of Magnetic Resonance Imaging.
  9. "Dielectric effect". Questions and Answers in MRI. Retrieved 2021-05-05.
  10. Dieringer, Matthias A.; Deimling, Michael; Santoro, Davide; Wuerfel, Jens; Madai, Vince I.; Sobesky, Jan; von Knobelsdorff-Brenkenhoff, Florian; Schulz-Menger, Jeanette; Niendorf, Thoralf (2014-03-12). "Rapid Parametric Mapping of the Longitudinal Relaxation Time T1 Using Two-Dimensional Variable Flip Angle Magnetic Resonance Imaging at 1.5 Tesla, 3 Tesla, and 7 Tesla". PLOS ONE. 9 (3): e91318. Bibcode:2014PLoSO...991318D. doi: 10.1371/journal.pone.0091318 . ISSN   1932-6203. PMC   3951399 . PMID   24621588.
  11. Hou, Zujun (2006). "A Review on MR Image Intensity Inhomogeneity Correction". International Journal of Biomedical Imaging. 2006: 49515. Bibcode:2006IJBI.200649515H. doi: 10.1155/ijbi/2006/49515 . ISSN   1687-4188. PMC   2324029 . PMID   23165035.
  12. Bashir U. "Zipper artifact | Radiology Reference Article | Radiopaedia.org". Radiopaedia. Retrieved 26 May 2019.
  13. 1 2 Elster AD. "Intro to Gating/Triggering".{{cite journal}}: Cite journal requires |journal= (help)
  14. 1 2 Solomon E (2021). "Free-breathing radial imaging using a pilot-tone radiofrequency transmitter for detection of respiratory motion". Magnetic Resonance in Medicine. 85 (5): 2672–2685. doi:10.1002/mrm.28616. PMC   7902348 . PMID   33306216.
  15. Ludwig J (2021). "Pilot tone–based motion correction for prospective respiratory compensated cardiac cine MRI". Magnetic Resonance in Medicine. 85 (5): 2403–2416. doi: 10.1002/mrm.28580 . PMID   33226699. S2CID   227135421.
  16. 1 2 3 4 5 6 7 8 Haskell MW, Cauley SF, Wald LL (May 2018). "TArgeted Motion Estimation and Reduction (TAMER): Data Consistency Based Motion Mitigation for MRI Using a Reduced Model Joint Optimization". IEEE Transactions on Medical Imaging. 37 (5): 1253–1265. doi:10.1109/TMI.2018.2791482. PMC   6633918 . PMID   29727288.
  17. 1 2 3 Haskell, Melissa West (2019-05-13). "Retrospective Motion Correction for Magnetic Resonance Imaging".{{cite journal}}: Cite journal requires |journal= (help)
  18. 1 2 Krizhevsky A, Sutskever I, Hinton GE (2017-05-24). "ImageNet classification with deep convolutional neural networks". Communications of the ACM. 60 (6): 84–90. doi: 10.1145/3065386 . ISSN   0001-0782.
  19. Lundervold AS, Lundervold A (May 2019). "An overview of deep learning in medical imaging focusing on MRI". Zeitschrift für Medizinische Physik. 29 (2): 102–127. arXiv: 1811.10052 . doi: 10.1016/j.zemedi.2018.11.002 . PMID   30553609.
  20. Mardani M, Gong E, Cheng JY, Vasanawala SS, Zaharchuk G, Xing L, Pauly JM (January 2019). "Deep Generative Adversarial Neural Networks for Compressive Sensing MRI". IEEE Transactions on Medical Imaging. 38 (1): 167–179. doi:10.1109/TMI.2018.2858752. PMC   6542360 . PMID   30040634.
  21. Lee D, Yoo J, Ye JC (April 2017). "Deep residual learning for compressed sensing MRI". 2017 IEEE 14th International Symposium on Biomedical Imaging (ISBI 2017). pp. 15–18. doi:10.1109/ISBI.2017.7950457. ISBN   978-1-5090-1172-8. S2CID   5518746.
  22. Creswell A, White T, Dumoulin V, Arulkumaran K, Sengupta B, Bharath AA (2020-10-22). "Generative adversarial networks". Communications of the ACM. 63 (11): 139–144. arXiv: 1406.2661 . doi: 10.1145/3422622 . ISSN   0001-0782.
  23. 1 2 3 4 5 6 7 8 9 Haskell MW, Cauley SF, Bilgic B, Hossbach J, Splitthoff DN, Pfeuffer J, et al. (October 2019). "Network Accelerated Motion Estimation and Reduction (NAMER): Convolutional neural network guided retrospective motion correction using a separable motion model". Magnetic Resonance in Medicine. 82 (4): 1452–1461. doi:10.1002/mrm.27771. PMC   6626557 . PMID   31045278.
  24. Kingma, Diederik P. (2015). "Adam: A Method for Stochastic Optimization". ICLR. arXiv: 1412.6980 .
  25. Yuan Z, Jiang M, Wang Y, Wei B, Li Y, Wang P, et al. (2020). "SARA-GAN: Self-Attention and Relative Average Discriminator Based Generative Adversarial Networks for Fast Compressed Sensing MRI Reconstruction". Frontiers in Neuroinformatics. 14: 611666. doi: 10.3389/fninf.2020.611666 . PMC   7726262 . PMID   33324189.
  26. Usman M, Latif S, Asim M, Lee BD, Qadir J (March 2020). "Retrospective Motion Correction in Multishot MRI using Generative Adversarial Network". Scientific Reports. 10 (1): 4786. arXiv: 1902.07430 . Bibcode:2020NatSR..10.4786U. doi:10.1038/s41598-020-61705-9. PMC   7075875 . PMID   32179823.
  27. 1 2 Franklin, KM; Dale, BM; Merkle, EM (2008). "Improvement in B1-inhomogeneity artifacts in the abdomen at 3T MR imaging using a radiofrequency cushion". J Magn Reson Imaging. 27 (6): 1443–7. doi: 10.1002/jmri.21164 . PMID   18421685. S2CID   12194069.
  28. Wang, D; Heberlein, K; LaConte, S; Hu, X (2004). "Inherent insensitivity to RF inhomogeneity in FLASH imaging". Magn Reson Med. 52 (4): 927–31. doi: 10.1002/mrm.20217 . hdl: 1853/5123 . PMID   15389953.
  29. Hayes, C., et al. (1985) "An efficient, highly homogeneous radiofrequency coil for whole-body NMR imaging at 1.5 T". Journal of Magnetic Resonance, 63(3), 622-628.
  30. Alsop, D. C., Connick, T. J., & Mizsei, G. (1998). A spiral volume coil for improved RF field homogeneity at high static magnetic field strength. Magnetic resonance in medicine, 40(1), 49–54. https://doi.org/10.1002/mrm.1910400107.
  31. Zhu, Yudong. (2004). Parallel Excitation With an Array of Transmit Coils. Magnetic resonance in medicine. 51. 775-84. 10.1002/mrm.20011.
  32. 1 2 Clare, S., Alecci, M., & Jezzard, P. (2001). Compensating for B(1) inhomogeneity using active transmit power modulation. Magnetic resonance imaging, 19(10), 1349–1352. https://doi.org/10.1016/s0730-725x(01)00467-2.
  33. Bendall, M. R., Garwood, M., Uğurbil, K., & Pegg, D. T. (1987). Adiabatic refocusing pulse which compensates for variable rf power and off-resonance effects. Magnetic resonance in medicine, 4(5), 493–499. https://doi.org/10.1002/mrm.1910040510.
  34. Silver, M.S, et al. (1984) Highly Selective π/2 and π Pulse Generation. Journal of Magnetic Resonance, 59(2), 347–351.
  35. Uǧurbil, K., et al.(1988). Amplitude- and frequency/phase-modulated refocusing pulses that induce plane rotations even in the presence of inhomogeneous B1 fields, Journal of Magnetic Resonance, 78(3), 472-497.
  36. 1 2 Hou Z. (2006). A Review on MR Image Intensity Inhomogeneity Correction. International journal of biomedical imaging, 2006, 49515. https://doi.org/10.1155/IJBI/2006/49515.
  37. "Case Reviews: Fast MRI & Image Enhancement". Medicvision. Retrieved 26 December 2021.
  38. Kanemaru, Noriko; Takao, Hidemasa; Amemiya, Shiori; Abe, Osamu (2022). "The effect of a post-scan processing denoising system on image quality and morphometric analysis". Journal of Neuroradiology. 49 (2): 205–212. doi: 10.1016/j.neurad.2021.11.007 . PMID   34863809. S2CID   244907903.
  39. Cunningham, C. H., Pauly, J. M., & Nayak, K. S. (2006). Saturated double-angle method for rapid B1+ mapping. Magnetic resonance in medicine, 55(6), 1326–1333. https://doi.org/10.1002/mrm.20896.
  40. Morrell G. R. (2008). A phase-sensitive method of flip angle mapping. Magnetic resonance in medicine, 60(4), 889–894. https://doi.org/10.1002/mrm.21729.
  41. Nehrke, K. and Börnert, P. (2012). DREAM-a Novel Approach for Robust, Ultrafast, multisliceB1mapping. Magnetic Resonance in Medicine, 68(5), 1517–1526., https://doi.org/10.1002/mrm.24158.