Related Research Articles

A geographic information system (GIS) consists of integrated computer hardware and software that store, manage, analyze, edit, output, and visualize geographic data. Much of this often happens within a spatial database, however, this is not essential to meet the definition of a GIS. In a broader sense, one may consider such a system also to include human users and support staff, procedures and workflows, the body of knowledge of relevant concepts and methods, and institutional organizations.
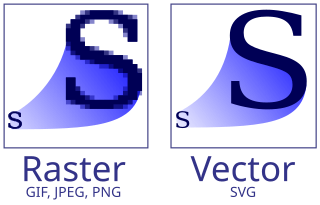
Vector graphics are a form of computer graphics in which visual images are created directly from geometric shapes defined on a Cartesian plane, such as points, lines, curves and polygons. The associated mechanisms may include vector display and printing hardware, vector data models and file formats, as well as the software based on these data models. Vector graphics are an alternative to raster or bitmap graphics, with each having advantages and disadvantages in specific situations.

The United States Fish and Wildlife Service is a U.S. federal government agency within the U.S. Department of the Interior which oversees the management of fish, wildlife, and natural habitats in the United States. The mission of the agency is "working with others to conserve, protect, and enhance fish, wildlife, plants and their habitats for the continuing benefit of the American people."
Environmental Systems Research Institute, Inc., doing business as Esri, is an American multinational geographic information system (GIS) software company headquartered in Redlands, California. It is best known for its ArcGIS products. With a 40% market share, Esri is the world's leading supplier of GIS software, web GIS and geodatabase management applications.
A GIS file format is a standard for encoding geographical information into a computer file, as a specialized type of file format for use in geographic information systems (GIS) and other geospatial applications. Since the 1970s, dozens of formats have been created based on various data models for various purposes. They have been created by government mapping agencies, GIS software vendors, standards bodies such as the Open Geospatial Consortium, informal user communities, and even individual developers.
TerraLib is an open-source geographic information system (GIS) software library. It extends object-relational database management systems (DBMS) to handle spatiotemporal data types.
A GIS software program is a computer program to support the use of a geographic information system, providing the ability to create, store, manage, query, analyze, and visualize geographic data, that is, data representing phenomena for which location is important. The GIS software industry encompasses a broad range of commercial and open-source products that provide some or all of these capabilities within various information technology architectures.
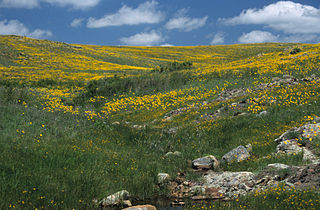
Wichita Mountains Wildlife Refuge, located in southwestern Oklahoma near Lawton, has protected unique wildlife habitats since 1901 and is the oldest managed wildlife facility in the United States Fish and Wildlife Service system. The refuge's location in the geologically unique Wichita Mountains and its areas of undisturbed mixed grass prairie make it an important conservation area. The Wichita Mountains are approximately 500 million years old. Measuring about 59,020 acres (238.8 km2), the refuge hosts a great diversity of species: 806 plant species, 240 species of birds, 36 fish, and 64 reptiles and amphibians are present.

gvSIG, geographic information system (GIS), is a desktop application designed for capturing, storing, handling, analyzing and deploying any kind of referenced geographic information in order to solve complex management and planning problems. gvSIG is known for having a user-friendly interface, being able to access the most common formats, both vector and raster ones. It features a wide range of tools for working with geographic-like information.

QGIS is a geographic information system (GIS) software that is free and open-source. QGIS supports Windows, macOS, and Linux. It supports viewing, editing, printing, and analysis of geospatial data in a range of data formats. QGIS was previously also known as Quantum GIS.
The Open Source Geospatial Foundation (OSGeo), is a non-profit non-governmental organization whose mission is to support and promote the collaborative development of open geospatial technologies and data. The foundation was formed in February 2006 to provide financial, organizational and legal support to the broader Libre/Free and open-source geospatial community. It also serves as an independent legal entity to which community members can contribute code, funding and other resources.
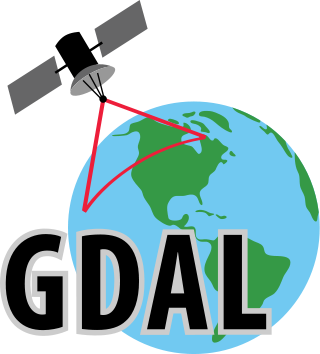
The Geospatial Data Abstraction Library (GDAL) is a computer software library for reading and writing raster and vector geospatial data formats, and is released under the permissive X/MIT style free software license by the Open Source Geospatial Foundation. As a library, it presents a single abstract data model to the calling application for all supported formats. It may also be built with a variety of useful command line interface utilities for data translation and processing. Projections and transformations are supported by the PROJ library.

The Ohio River Islands National Wildlife Refuge (ORINWR) is a National Wildlife Refuge (NWR) in non-contiguous sites consisting of islands along 362 miles (583 km) of the Ohio River, primarily in the U.S. state of West Virginia.
A geographic data model, geospatial data model, or simply data model in the context of geographic information systems, is a mathematical and digital structure for representing phenomena over the Earth. Generally, such data models represent various aspects of these phenomena by means of geographic data, including spatial locations, attributes, change over time, and identity. For example, the vector data model represents geography as collections of points, lines, and polygons, and the raster data model represent geography as cell matrices that store numeric values. Data models are implemented throughout the GIS ecosystem, including the software tools for data management and spatial analysis, data stored in a variety of GIS file formats, specifications and standards, and specific designs for GIS installations.
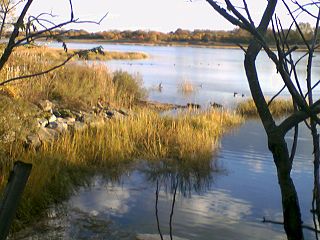
Wetlands of the United States are defined by the United States Army Corps of Engineers and the United States Environmental Protection Agency as "those areas that are inundated or saturated by surface or ground water at a frequency and duration sufficient to support, and that under normal circumstances do support, a prevalence of vegetations typically adapted for life in saturated soils. Wetlands generally include swamps, marshes, bogs, and similar areas." Wetlands can be valued in terms of their contributions to ecological, economic and social systems. Wetlands service these systems through multiple processes including water filtration, water storage and biological productivity. They also contribute the functions of flood control, providing a nutrient sink, groundwater recharge and habitat.
The National Wetlands Inventory (NWI) was established by the United States Fish and Wildlife Service (FWS) to conduct a nationwide inventory of U.S. wetlands to provide biologists and others with information on the distribution and type of wetlands to aid in conservation efforts. To do this, the NWI developed a wetland classification system that is now the official FWS wetland classification system and the Federal standard for wetland classification. The NWI also developed techniques for mapping and recording the inventory findings. The NWI relies on trained image analysts to identify and classify wetlands and deepwater habitats from aerial imagery. NWI started mapping wetlands at a small scale. Eventually, large-scale maps became the standard product delivered by NWI. As computerized mapping and geospatial technology evolved, NWI discontinued production of paper maps in favor of distributing data via online "mapping tools" where information can be viewed and downloaded. Today, FWS serves its data via an on-line data discovery "Wetlands Mapper". GIS users can access wetlands data through an online wetland mapping service or download data for various applications. The techniques used by NWI have recently been adopted by the Federal Geographic Data Committee as the federal wetland mapping standard. This standard applies to all federal grants involving wetland mapping to insure the data can be added to the Wetlands Layer of the National Spatial Data Infrastructure. NWI also produces national wetlands status and trends reports required by the United States Congress.
Vector tiles, tiled vectors or vectiles are packets of geographic data, packaged into pre-defined roughly-square shaped "tiles" for transfer over the web. This is an emerging method for delivering styled web maps, combining certain benefits of pre-rendered raster map tiles with vector map data. As with the widely used raster tiled web maps, map data is requested by a client as a set of "tiles" corresponding to square areas of land of a pre-defined size and location. Unlike raster tiled web maps, however, the server returns vector map data, which has been clipped to the boundaries of each tile, instead of a pre-rendered map image.
The Harvard Laboratory for Computer Graphics and Spatial Analysis pioneered early cartographic and architectural computer applications that led to integrated geographic information systems (GIS). Some of the Laboratory's influential programs included SYMAP, SYMVU, GRID, CALFORM, and POLYVRT. The Laboratory's Odyssey project created a geographic information system that served as a milestone in the development of integrated mapping systems. The Laboratory influenced numerous computer graphic, mapping and architectural systems such as Intergraph, Computervision, and Esri.
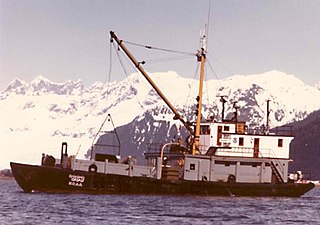
NOAAS Murre II, previously NOAAS Murre II, was an American research vessel in commission in the National Oceanic and Atmospheric Administration (NOAA) fleet from 1970 to 1989. Prior to her NOAA career, she operated under the United States Department of the Interior′s Fish and Wildlife Service from 1949 to 1956 and under the United States Fish and Wildlife Service′s Bureau of Commercial Fisheries from 1956 to 1970 as US FWS Murre II.
A Geodatabase is a proprietary GIS file format developed in the late 1990s by Esri to represent, store, and organize spatial datasets within a geographic information system. A geodatabase is both a logical data model and the physical implementation of that logical model in several proprietary file formats released during the 2000s. The geodatabase design is based on the spatial database model for storing spatial data in relational and object-relational databases. Given the dominance of Esri in the GIS industry, the term "geodatabase" is used by some as a generic trademark for any spatial database, regardless of platform or design.
References
- ↑ "Short History of the MOSS GIS".
- ↑ Federation of Rocky Mountain States. Information Systems Technical Laboratory (1978). WELUT - 02 Project : report 2200 : logical capabilities of the GIS : management summary version. Bureau of Land Management Library. Fort Collins, Colo. : Information Systems Technical Laboratory, Federation of Rocky Mountain States, Inc.
- ↑ User needs assessment for an operational geographic information system /. Fort Collins, Colo. : Washington, D.C.: Dept. of the Interior, Fish and Wildlife Service, Office of Biological Services, Western Energy and Land Use Team : For sale by the Supt. of Docs., U.S. Govt. Print. Off. 1977.
- ↑ Federation of Rocky Mountain States. Information Systems Technical Laboratory (1977). Comparison of selected operational capabilities of fifty-four geographic information systems. Bureau of Land Management Library.
- ↑ Workshop, National MOSS Users, Proceedings of the 1985 National MOSS Users Workshop (PDF), retrieved April 30, 2024
- ↑ ""Proceedings: Fifth National MOSS Users Workshop."". repository.library.noaa.gov. Retrieved April 30, 2024.
- ↑ National MOSS Users Workshop (3rd : 1986 : Fort Collins, Colo ); Feagan, Tracey R.; United States Bureau of Land Management; Unitred States Fish and Wildlife Service; TGS Technology, Inc (1987). Proceedings, Third National MOSS Users Workshop : [June 2-5, 1986, Fort Collins, Colorado] / $c compiled by U.S. Department of the Interior, Bureau of Land Management, Fish and Wildlife Service, and TGS Technology, Inc. ; [Tracey R. Feagan, workshop coordinator]. Bureau of Land Management Library. Lakewood, Colo. : The Bureau.
{{cite book}}:|first5=has generic name (help)CS1 maint: numeric names: authors list (link) - ↑ Ader, Robert; Stayner, Floyd (August 28, 1982). "THE ROLE OF THE USFWS GEOGRAPHIC INFORMATION SYSTEM IN COASTAL DECISIONMAKING". Citeseerx. Retrieved April 30, 2024.
- ↑ Forbes, Robert (1984). Feasibility and design study for the enhancement of MOSS : draft : logical functions. Bureau of Land Management Library. Fort Collins, Colo. : Autometric, Inc.
- ↑ "MOSS User's Manual" (PDF). Internet Archive. 1985. Retrieved April 29, 2024.