Meta-regression

Last updated

Meta-regression is defined to be a meta-analysis that uses regression analysis to combine, compare, and synthesize research findings from multiple studies while adjusting for the effects of available covariates on a response variable. A meta-regression analysis aims to reconcile conflicting studies or corroborate consistent ones; a meta-regression analysis is therefore characterized by the collated studies and their corresponding data sets—whether the response variable is study-level (or equivalently aggregate) data or individual participant data (or individual patient data in medicine). A data set is aggregate when it consists of summary statistics such as the sample mean, effect size, or odds ratio. On the other hand, individual participant data are in a sense raw in that all observations are reported with no abridgment and therefore no information loss. Aggregate data are easily compiled through internet search engines and therefore not expensive. However, individual participant data are usually confidential and are only accessible within the group or organization that performed the studies.

Contents

Although meta-analysis for observational data is also under extensive research, [1] [2] the literature still largely centers around combining randomized controlled trials (RCTs). In RCTs, a study typically includes a trial that consists of arms. An arm refers to a group of participants who received the same therapy, intervention, or treatment. A meta-analysis with some or all studies having more than two arms is called network meta-analysis, indirect meta-analysis, or a multiple treatment comparison. Despite also being an umbrella term, meta-analysis sometimes implies that all included studies have strictly two arms each—same two treatments in all trials—to distinguish itself from network meta-analysis. A meta-regression can be classified in the same way—meta-regression and network meta-regression—depending on the number of distinct treatments in the regression analysis.

Meta-analysis (and meta-regression) is often placed at the top of the evidence hierarchy provided that the analysis consists of individual participant data of randomized controlled clinical trials. [3] Meta-regression plays a critical role in accounting for covariate effects, especially in the presence of categorical variables that can be used for subgroup analysis.

Meta-regression models

Meta-regression covers a large class of models which can differ depending on the characterization of the data at one's disposal. There is generally no one-size-fits-all description for meta-regression models. Individual participant data, in particular, allow flexible modeling that reflects different types of response variable(s): continuous, count, proportion, and correlation. However, aggregate data are generally modeled as a normal linear regression ytk = xtkβ + εtk using the central limit theorem and variable transformation, where the subscript k indicates the kth study or trial, t denotes the tth treatment, ytk indicates the response endpoint for the kth study's tth arm, xtk is the arm-level covariate vector, εtk is the error term that is independently and identically distributed as a normal distribution. For example, a sample proportion tk can be logit-transformed or arcsine-transformed prior to meta-regression modeling, i.e., ytk= logit(tk) or ytk= arcsin(tk). Likewise, Fisher's z-transformation can be used for sample correlations, i.e., ytk= arctanh(rtk). The most common summary statistic reported in a study is the sample mean and the sample standard deviation, in which case no transformation is needed. It is also possible to derive an aggregate-data model from an underlying individual-participant-data model. For example, if yitk is the binary response either zero or one where the additional subscript i indicates the ith participant, the sample proportion tk as the sample average of yitk for i = 1, 2, ..., ntk may not require any transformation if de Moivre–Laplace theorem is assumed to be at play. Note that if a meta-regression is study-level, as opposed to arm-level, there is no subscript t indicating the treatment assigned for the corresponding arm.

One of the most important distinctions in meta-analysis models is whether to assume heterogeneity between studies. If a researcher assumes that studies are not heterogeneous, it implies that the studies are only different due to sampling error with no material difference between studies, in which case no other source of variation would enter the model. On the other hand, if studies are heterogeneous, the additional source(s) of variation—aside from the sampling error represented by εtk—must be addressed. This ultimately translates to a choice between fixed-effect meta-regression and random-effect (rigorously speaking, mixed-effect) meta-regression.

Fixed-effect meta-regression

Fixed-effect meta-regression reflects the belief that the studies involved lack substantial difference. An arm-level fixed-effect meta-regression is written as ytk=xtkβ + ɛtk. If only study-level summary statistics are available, the subscript t for treatment assignment can be dropped, yielding yk=xkβ + ɛk. The error term involves a variance term σtk2 (or σk2) which is not estimable unless the sample variance stk2 (or sk2) is reported as well as ytk (or yk). Most commonly, the model variance is assumed to be equal across arms and studies, in which case all subscripts are dropped, i.e., σ2. If the between-study variation is nonnegligible, the parameter estimates will be biased, and the corresponding statistical inference cannot be generalized.

Mixed-effect meta-regression

The terms random-effect meta-regression and mixed-effect meta-regression are equivalent. Although calling one a random-effect model signals the absence of fixed effects, which would technically disqualify it from being a regression model, one could argue that the modifier random-effect only adds to, not takes away from, what any regression model should include: fixed effects. Google Trends indicates that both terms enjoy similar levels of acceptance in publications as of July 24, 2021. [4]

Mixed-effect meta-regression includes a random-effect term in addition to the fixed effects, suggesting that the studies are heterogeneous. The random effects, denoted by wtkγk, capture between-trial variability. The full model then becomes ytk=xtkβ + wtkγk + εtk. Random effects in meta-regression are intended to reflect the noisy treatment effects—unless assumed and modeled otherwise—which implies that the length of the corresponding coefficient vector γk should be the same as the number of treatments included in the study. This implies that treatments themselves are assumed to be a source of variation in the outcome variable—e.g., the group receiving a placebo will not have the same level of variability in cholesterol level as another that receives a cholesterol-lowering drug. Restricting our attention to the narrow definition of meta-analysis including two treatments, γk is two-dimensional, i.e., γk= (γ1k, γ2k), for which the model is recast as ytk=xtkβ + γtk + εtk. The advantage of writing the model in a matrix-vector notation is that the correlation between the treatments, Corr(γ1k, γ2k), can be investigated. The random coefficient vector γk is then a noisy realization of the real treatment effect denoted by γ. The distribution of γk is commonly assumed to be one in the location-scale family, most notably, a multivariate normal distribution, i.e., γk ~ N(γ, Ω).

Which model to choose

Meta-regression has been employed as a technique to derive improved parameter estimates that are of direct use to policymakers. Meta-regression provides a framework for replication and offers a sensitivity analysis for model specification. [5] There are a number of strategies for identifying and coding empirical observational data. Meta-regression models can be extended for modeling within-study dependence, excess heterogeneity and publication selection. [5] The fixed-effect regression model does not allow for within-study variation. The mixed effects model allows for within-study variation and between-study variation and is therefore taken as the most flexible model to choose in many applications. Although the heterogeneity assumption can be statistically tested and it is a widespread practice in many fields, if this test is followed by another set of regression analysis, the corresponding statistical inference is subject to what is called selective inference. [6] These heterogeneity tests also do not conclude that there is no heterogeneity even when they come out insignificant, and some researchers advise to opt for mixed-effect meta-regression at any rate. [7]

Applications

Meta-regression is a statistically rigorous approach to systematic reviews. Recent applications include quantitative reviews of the empirical literature in economics, business, energy and water policy. [8] Meta-regression analyses have been seen in studies of price and income elasticities of various commodities and taxes, [8] productivity spillovers on multinational companies, [9] and calculations on the value of a statistical life (VSL). [10] Other recent meta-regression analyses have focused on qualifying elasticities derived from demand functions. Examples include own price elasticities for alcohol, tobacco, water and energy. [8]

In energy conservation, meta-regression analysis has been used to evaluate behavioral information strategies in the residential electricity sector. [11] In water policy analysis, meta-regression has been used to evaluate cost savings estimates due to privatization of local government services for water distribution and solid waste collection. [12] Meta-regression is an increasingly popular tool to evaluate the available evidence in cost-benefit analysis studies of a policy or program spread across multiple studies.

See also

Related Research Articles

Analysis of variance (ANOVA) is a collection of statistical models and their associated estimation procedures used to analyze the differences among means. ANOVA was developed by the statistician Ronald Fisher. ANOVA is based on the law of total variance, where the observed variance in a particular variable is partitioned into components attributable to different sources of variation. In its simplest form, ANOVA provides a statistical test of whether two or more population means are equal, and therefore generalizes the t-test beyond two means. In other words, the ANOVA is used to test the difference between two or more means.

Econometrics is an application of statistical methods to economic data in order to give empirical content to economic relationships. More precisely, it is "the quantitative analysis of actual economic phenomena based on the concurrent development of theory and observation, related by appropriate methods of inference". An introductory economics textbook describes econometrics as allowing economists "to sift through mountains of data to extract simple relationships". Jan Tinbergen is one of the two founding fathers of econometrics. The other, Ragnar Frisch, also coined the term in the sense in which it is used today.

<span class="mw-page-title-main">Meta-analysis</span> Statistical method that summarizes data from multiple sources

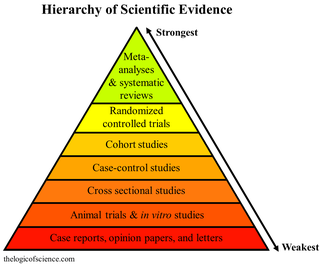
A meta-analysis is a statistical analysis that combines the results of multiple scientific studies. Meta-analyses can be performed when there are multiple scientific studies addressing the same question, with each individual study reporting measurements that are expected to have some degree of error. The aim then is to use approaches from statistics to derive a pooled estimate closest to the unknown common truth based on how this error is perceived. Meta-analytic results are considered the most trustworthy source of evidence by the evidence-based medicine literature.

In statistics, the power of a binary hypothesis test is the probability that the test correctly rejects the null hypothesis when a specific alternative hypothesis is true. It is commonly denoted by , and represents the chances of a true positive detection conditional on the actual existence of an effect to detect. Statistical power ranges from 0 to 1, and as the power of a test increases, the probability of making a type II error by wrongly failing to reject the null hypothesis decreases.

<span class="mw-page-title-main">Dependent and independent variables</span> Concept in mathematical modeling, statistical modeling and experimental sciences

Dependent and independent variables are variables in mathematical modeling, statistical modeling and experimental sciences. Dependent variables are studied under the supposition or demand that they depend, by some law or rule, on the values of other variables. Independent variables, in turn, are not seen as depending on any other variable in the scope of the experiment in question. In this sense, some common independent variables are time, space, density, mass, fluid flow rate, and previous values of some observed value of interest to predict future values.

Functional data analysis (FDA) is a branch of statistics that analyses data providing information about curves, surfaces or anything else varying over a continuum. In its most general form, under an FDA framework, each sample element of functional data is considered to be a random function. The physical continuum over which these functions are defined is often time, but may also be spatial location, wavelength, probability, etc. Intrinsically, functional data are infinite dimensional. The high intrinsic dimensionality of these data brings challenges for theory as well as computation, where these challenges vary with how the functional data were sampled. However, the high or infinite dimensional structure of the data is a rich source of information and there are many interesting challenges for research and data analysis.

A nested case–control (NCC) study is a variation of a case–control study in which cases and controls are drawn from the population in a fully enumerated cohort.

<span class="mw-page-title-main">Confounding</span> Variable in statistics

In statistics, a confounder is a variable that influences both the dependent variable and independent variable, causing a spurious association. Confounding is a causal concept, and as such, cannot be described in terms of correlations or associations. The existence of confounders is an important quantitative explanation why correlation does not imply causation.

In statistics, (between-) study heterogeneity is a phenomenon that commonly occurs when attempting to undertake a meta-analysis. In a simplistic scenario, studies whose results are to be combined in the meta-analysis would all be undertaken in the same way and to the same experimental protocols. Differences between outcomes would only be due to measurement error. Study heterogeneity denotes the variability in outcomes that goes beyond what would be expected due to measurement error alone.

In statistics, a fixed effects model is a statistical model in which the model parameters are fixed or non-random quantities. This is in contrast to random effects models and mixed models in which all or some of the model parameters are random variables. In many applications including econometrics and biostatistics a fixed effects model refers to a regression model in which the group means are fixed (non-random) as opposed to a random effects model in which the group means are a random sample from a population. Generally, data can be grouped according to several observed factors. The group means could be modeled as fixed or random effects for each grouping. In a fixed effects model each group mean is a group-specific fixed quantity.

Multilevel models are statistical models of parameters that vary at more than one level. An example could be a model of student performance that contains measures for individual students as well as measures for classrooms within which the students are grouped. These models can be seen as generalizations of linear models, although they can also extend to non-linear models. These models became much more popular after sufficient computing power and software became available.

<span class="mw-page-title-main">Mediation (statistics)</span> Statistical model

In statistics, a mediation model seeks to identify and explain the mechanism or process that underlies an observed relationship between an independent variable and a dependent variable via the inclusion of a third hypothetical variable, known as a mediator variable. Rather than a direct causal relationship between the independent variable and the dependent variable, a mediation model proposes that the independent variable influences the mediator variable, which in turn influences the dependent variable. Thus, the mediator variable serves to clarify the nature of the relationship between the independent and dependent variables.

Repeated measures design is a research design that involves multiple measures of the same variable taken on the same or matched subjects either under different conditions or over two or more time periods. For instance, repeated measurements are collected in a longitudinal study in which change over time is assessed.

In statistics, econometrics, political science, epidemiology, and related disciplines, a regression discontinuity design (RDD) is a quasi-experimental pretest-posttest design that aims to determine the causal effects of interventions by assigning a cutoff or threshold above or below which an intervention is assigned. By comparing observations lying closely on either side of the threshold, it is possible to estimate the average treatment effect in environments in which randomisation is unfeasible. However, it remains impossible to make true causal inference with this method alone, as it does not automatically reject causal effects by any potential confounding variable. First applied by Donald Thistlethwaite and Donald Campbell (1960) to the evaluation of scholarship programs, the RDD has become increasingly popular in recent years. Recent study comparisons of randomised controlled trials (RCTs) and RDDs have empirically demonstrated the internal validity of the design.

In the statistical analysis of observational data, propensity score matching (PSM) is a statistical matching technique that attempts to estimate the effect of a treatment, policy, or other intervention by accounting for the covariates that predict receiving the treatment. PSM attempts to reduce the bias due to confounding variables that could be found in an estimate of the treatment effect obtained from simply comparing outcomes among units that received the treatment versus those that did not. Paul R. Rosenbaum and Donald Rubin introduced the technique in 1983.

In statistics and regression analysis, moderation occurs when the relationship between two variables depends on a third variable. The third variable is referred to as the moderator variable or simply the moderator. The effect of a moderating variable is characterized statistically as an interaction; that is, a categorical or continuous variable that is associated with the direction and/or magnitude of the relation between dependent and independent variables. Specifically within a correlational analysis framework, a moderator is a third variable that affects the zero-order correlation between two other variables, or the value of the slope of the dependent variable on the independent variable. In analysis of variance (ANOVA) terms, a basic moderator effect can be represented as an interaction between a focal independent variable and a factor that specifies the appropriate conditions for its operation.

In statistics, the two-way analysis of variance (ANOVA) is an extension of the one-way ANOVA that examines the influence of two different categorical independent variables on one continuous dependent variable. The two-way ANOVA not only aims at assessing the main effect of each independent variable but also if there is any interaction between them.

In statistics, the Sobel test is a method of testing the significance of a mediation effect. The test is based on the work of Michael E. Sobel, a statistics professor at Columbia University in New York, NY, and is an application of the delta method. In mediation, the relationship between the independent variable and the dependent variable is hypothesized to be an indirect effect that exists due to the influence of a third variable. As a result when the mediator is included in a regression analysis model with the independent variable, the effect of the independent variable is reduced and the effect of the mediator remains significant. The Sobel test is basically a specialized t test that provides a method to determine whether the reduction in the effect of the independent variable, after including the mediator in the model, is a significant reduction and therefore whether the mediation effect is statistically significant.

In statistics, linear regression is a linear approach for modelling the relationship between a scalar response and one or more explanatory variables. The case of one explanatory variable is called simple linear regression; for more than one, the process is called multiple linear regression. This term is distinct from multivariate linear regression, where multiple correlated dependent variables are predicted, rather than a single scalar variable.

The Fay–Herriot model is a statistical model which includes some distinct variation for each of several subgroups of observations. It is an area-level model, meaning some input data are associated with sub-aggregates such as regions, jurisdictions, or industries. The model produces estimates about the subgroups. The model is applied in the context of small area estimation in which there is a lot of data overall, but not much for each subgroup.

References

  1. Stroup, Donna F.; Berlin, Jesse; Morton, Sally; Olkin, Ingram; Williamson, David; Rennie, Drummond; Moher, David; Becker, Betsy; Sipe, Theresa; Thacker, Stephen (19 April 2000). "Meta-analysis of Observational Studies in EpidemiologyA Proposal for Reporting". JAMA. 283 (15): 2008. doi:10.1001/jama.283.15.2008.
  2. Mueller, Monika; D’Addario, Maddalena; Egger, Matthias; Cevallos, Myriam; Dekkers, Olaf; Mugglin, Catrina; Scott, Pippa (December 2018). "Methods to systematically review and meta-analyse observational studies: a systematic scoping review of recommendations". BMC Medical Research Methodology. 18 (1): 44. doi:10.1186/s12874-018-0495-9. PMC   5963098 .
  3. Research, Center for Drug Evaluation and (27 April 2020). "Meta-Analyses of Randomized Controlled Clinical Trials to Evaluate the Safety of Human Drugs or Biological Products". U.S. Food and Drug Administration.
  4. "Google Trends". Google Trends.
  5. 1 2 T.D. Stanley and Stephen B. Jarrell, (1989). Meta-regression analysis: A quantitative method of literature surveys. Journal of Economic Surveys, 19(3) 299-308.
  6. Benjamini, Yoav (16 December 2020). "Selective Inference: The Silent Killer of Replicability". Harvard Data Science Review. 2 (4). doi: 10.1162/99608f92.fc62b261 .
  7. Thompson, Simon G.; Higgins, Julian P. T. (15 June 2002). "How should meta-regression analyses be undertaken and interpreted?". Statistics in Medicine. 21 (11): 1559–1573. doi:10.1002/sim.1187.
  8. 1 2 3 T.D. Stanley and Hristos Doucouliagos (2009). Meta-regression Analysis in Economics and Business, New York: Routledge.
  9. H. Gorg and Eric Strobl (2001). Multinational companies and productivity spillovers: A meta-analysis. The Economic Journal, 111(475) 723-739.
  10. F. Bellavance, Georges Dionne, and Martin Lebeau (2009). The value of a statistical life: A meta-analysis with a mixed effects regression model, Journal of Health Economics, 28(2) 444-464.
  11. M.A. Delmas, Miriam Fischlein and Omar I. Asensio (2013). Information strategies and energy conservation behavior: A meta-analysis of experimental studies 1975-2012. Energy Policy, 61, 729-739.
  12. G. Bel, Xavier Fageda and Mildred E. Warner (2010). Is private production of public services cheaper than public production? A meta-regression analysis of solid waste and water services. Journal of Policy Analysis and Management. 29(3), 553-577.

Further reading