Related Research Articles

Spectroscopy is the field of study that measures and interprets electromagnetic spectra. In narrower contexts, spectroscopy is the precise study of color as generalized from visible light to all bands of the electromagnetic spectrum.

An optical spectrometer is an instrument used to measure properties of light over a specific portion of the electromagnetic spectrum, typically used in spectroscopic analysis to identify materials. The variable measured is most often the irradiance of the light but could also, for instance, be the polarization state. The independent variable is usually the wavelength of the light or a closely derived physical quantity, such as the corresponding wavenumber or the photon energy, in units of measurement such as centimeters, reciprocal centimeters, or electron volts, respectively.

Raman spectroscopy is a spectroscopic technique typically used to determine vibrational modes of molecules, although rotational and other low-frequency modes of systems may also be observed. Raman spectroscopy is commonly used in chemistry to provide a structural fingerprint by which molecules can be identified.
Chemometrics is the science of extracting information from chemical systems by data-driven means. Chemometrics is inherently interdisciplinary, using methods frequently employed in core data-analytic disciplines such as multivariate statistics, applied mathematics, and computer science, in order to address problems in chemistry, biochemistry, medicine, biology and chemical engineering. In this way, it mirrors other interdisciplinary fields, such as psychometrics and econometrics.
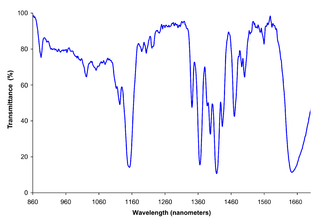
Near-infrared spectroscopy (NIRS) is a spectroscopic method that uses the near-infrared region of the electromagnetic spectrum. Typical applications include medical and physiological diagnostics and research including blood sugar, pulse oximetry, functional neuroimaging, sports medicine, elite sports training, ergonomics, rehabilitation, neonatal research, brain computer interface, urology, and neurology. There are also applications in other areas as well such as pharmaceutical, food and agrochemical quality control, atmospheric chemistry, combustion research and knowledge.

Laser-induced breakdown spectroscopy (LIBS) is a type of atomic emission spectroscopy which uses a highly energetic laser pulse as the excitation source. The laser is focused to form a plasma, which atomizes and excites samples. The formation of the plasma only begins when the focused laser achieves a certain threshold for optical breakdown, which generally depends on the environment and the target material.
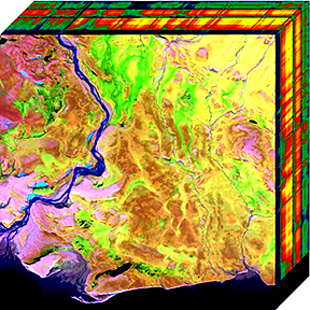
Hyperspectral imaging collects and processes information from across the electromagnetic spectrum. The goal of hyperspectral imaging is to obtain the spectrum for each pixel in the image of a scene, with the purpose of finding objects, identifying materials, or detecting processes. There are three general types of spectral imagers. There are push broom scanners and the related whisk broom scanners, which read images over time, band sequential scanners, which acquire images of an area at different wavelengths, and snapshot hyperspectral imagers, which uses a staring array to generate an image in an instant.

Near-field scanning optical microscopy (NSOM) or scanning near-field optical microscopy (SNOM) is a microscopy technique for nanostructure investigation that breaks the far field resolution limit by exploiting the properties of evanescent waves. In SNOM, the excitation laser light is focused through an aperture with a diameter smaller than the excitation wavelength, resulting in an evanescent field on the far side of the aperture. When the sample is scanned at a small distance below the aperture, the optical resolution of transmitted or reflected light is limited only by the diameter of the aperture. In particular, lateral resolution of 6 nm and vertical resolution of 2–5 nm have been demonstrated.
Chemical imaging is the analytical capability to create a visual image of components distribution from simultaneous measurement of spectra and spatial, time information. Hyperspectral imaging measures contiguous spectral bands, as opposed to multispectral imaging which measures spaced spectral bands.
A multivariate optical element (MOE), is the key part of a multivariate optical computer; an alternative to conventional spectrometry for the chemical analysis of materials.
Transmission Raman spectroscopy (TRS) is a variant of Raman spectroscopy which is advantageous in probing bulk content of diffusely scattering samples. Although it was demonstrated in the early days of Raman spectroscopy it was not exploited in practical settings until much later, probably due to limitations of technology at the time. It was rediscovered in 2006, where the authors showed that it was capable of allowing Raman spectroscopy through many millimetres of tabletted or powdered samples. In addition, this research has also identified several highly beneficial analytical properties of this approach, including the ability to probe bulk content of powders and tissue in the absence of subsampling and to reject Raman and fluorescence components originating from the surface of the sample.
The Unscrambler X is a commercial software product for multivariate data analysis, used for calibration of multivariate data which is often in the application of analytical data such as near infrared spectroscopy and Raman spectroscopy, and development of predictive models for use in real-time spectroscopic analysis of materials. The software was originally developed in 1986 by Harald Martens and later by CAMO Software.

Integral field spectrographs (IFS) combine spectrographic and imaging capabilities in the optical or infrared wavelength domains (0.32 μm – 24 μm) to get from a single exposure spatially resolved spectra in a bi-dimensional region. The name originates from the fact that the measurements result from integrating the light on multiple sub-regions of the field. Developed at first for the study of astronomical objects, this technique is now also used in many other fields, such bio-medical science and Earth remote sensing. Integral field spectrography is part of the broader category of snapshot hyperspectral imaging techniques, itself a part of hyperspectral imaging.

A liquid crystal tunable filter (LCTF) is an optical filter that uses electronically controlled liquid crystal (LC) elements to transmit a selectable wavelength of light and exclude others. Often, the basic working principle is based on the Lyot filter but many other designs can be used. The main difference with the original Lyot filter is that the fixed wave plates are replaced by switchable liquid crystal wave plates.
Paul J. Gemperline is an American analytical chemist and chemometrician. He is a Distinguished Professor of Chemistry at East Carolina University (ECU) located in Greenville, North Carolina and has been the recipient of several scientific awards, including the 2003 Eastern Analytical Symposium Award in Chemometrics. He is author of more than 60 publications in the field of chemometrics. Dr. Gemperline served as Dean of the Graduate School at ECU from 2008 to 2022. He retired from ECU June 30, 2022 and is now professor emeritus.
The technique of vibrational analysis with scanning probe microscopy allows probing vibrational properties of materials at the submicrometer scale, and even of individual molecules. This is accomplished by integrating scanning probe microscopy (SPM) and vibrational spectroscopy. This combination allows for much higher spatial resolution than can be achieved with conventional Raman/FTIR instrumentation. The technique is also nondestructive, requires non-extensive sample preparation, and provides more contrast such as intensity contrast, polarization contrast and wavelength contrast, as well as providing specific chemical information and topography images simultaneously.

The computed tomography imaging spectrometer (CTIS) is a snapshot imaging spectrometer which can produce in fine the three-dimensional hyperspectral datacube of a scene.

Diffuse optical imaging (DOI) is a method of imaging using near-infrared spectroscopy (NIRS) or fluorescence-based methods. When used to create 3D volumetric models of the imaged material DOI is referred to as diffuse optical tomography, whereas 2D imaging methods are classified as diffuse optical imaging.
Photon etc. is a Canadian manufacturer of infrared cameras, widely tunable optical filters, hyperspectral imaging and spectroscopic scientific instruments for academic and industrial applications. Its main technology is based on volume Bragg gratings, which are used as filters either for swept lasers or for global imaging.

The NIRSpec is one of the four scientific instruments flown on the James Webb Space Telescope (JWST). The JWST is the follow-on mission to the Hubble Space Telescope (HST) and is developed to receive more information about the origins of the universe by observing infrared light from the first stars and galaxies. In comparison to HST, its instruments will allow looking further back in time and will study the so-called Dark Ages during which the universe was opaque, about 150 to 800 million years after the Big Bang.
References
- ↑ 1 Myrick, Michael L.; Haibach, Frederick G. (2004-04-01), "Precision in Multivariate Optical Computing", Applied Optics, 43 (10): 2130–2140, Bibcode:2004ApOpt..43.2130H, doi:10.1364/AO.43.002130, PMID 15074423
- 1 2 Nelson, MP; Aust, JF; Dobrowolski, JA; Verly, PG; Myrick, Michael L. (1998), "Multivariate optical computation for predictive spectroscopy", Analytical Chemistry, 70 (1): 73–82, Bibcode:1998SPIE.3261..232N, doi:10.1021/ac970791w, PMID 21644602
- ↑ Vornehm, J.E. Jr; Dong, A.J.; Boyd, R.W.; et al. (2014). "Multiple-output multivariate optical computing for spectrum recognition". Optics Express. 22 (21): 25005–14. Bibcode:2014OExpr..2225005V. doi: 10.1364/OE.22.025005 . PMID 25401534. S2CID 28584987.
- 1 2 3 Jones, Christopher M.; et al. (2014-08-30), "Multivariate Optical Computing enables Accurate Harsh Environment Sensing for the Oil and Gas Industry", Laser Focus World, 50 (8): 27–31, retrieved 2014-08-30
- ↑ Bialkowski, S (1986). "Species discrimination and quantitative estimation using incoherent linear optical signal processing of emission signals". Analytical Chemistry. 58 (12): 2561–2563. doi:10.1021/ac00125a043.
- 1 2 Dobrowolski, Jerzy A.; Verly, Pierre G.; Myrick, Michael L.; Nelson, Matthew P.; Aust, Jeffrey F. (1997). "Design of thin-film filters for the monitoring of chemical reactions". In Hall, Randolph L (ed.). Optical Thin Films V: New Developments. Vol. 3133. p. 38. doi:10.1117/12.290200. S2CID 135787454.
- 1 2 3 Soyemi, O.; Eastwood, D.; Zhang, L.; et al. (2001). "Design and Testing of a Multivariate Optical Element: The First Demonstration of Multivariate Optical Computing for Predictive Spectroscopy". Analytical Chemistry. 73 (6): 1069–1079. doi:10.1021/ac0012896.
- 1 2 Eastwood, Delyle; Soyemi, Olusola O.; Karunamuni, Jeevanandra; Zhang, Lixia; Li, Hongli; Myrick, Michael L. (2001). "Field applications of stand-off sensing using visible/NIR multivariate optical computing". In Vo-Dinh, Tuan; Spellicy, Robert L (eds.). Water, Ground, and Air Pollution Monitoring and Remediation. Vol. 4199. p. 105. doi:10.1117/12.417366. S2CID 93350247.
- ↑ Myrick, M.L. (2002). "Multivariate optical elements simplify spectroscopy". Laser Focus World. 38 (3): 91–94.
- 1 2 3 Jones, C.M., Freese, B., Pelletier, M. et al. 2012. Laboratory Quality Optical Analysis in Harsh Environments. Presented at the SPE Kuwait International Petroleum Conference and Exhibition,
- 1 2 Davis, B.M.; Hemphill, A.J.; Maltaş, D.C.; et al. (2011). "Multivariate Hyperspectral Raman Imaging Using Compressive Detection". Analytical Chemistry. 83 (13): 5086–5092. doi:10.1021/ac103259v. PMID 21604741.
- 1 2 Smith, Z.J.; Strombom, S.; Wachsmann-Hogiu, S. (2011). "Multivariate optical computing using a digital micromirror device for fluorescence and Raman spectroscopy". Optics Express. 19 (18): 16950–16962. Bibcode:2011OExpr..1916950S. doi: 10.1364/OE.19.016950 . PMID 21935055.
- ↑ Priore, Ryan J.; Swanstrom, Joseph A. (2015). "Multivariate optical computing for fluorochrome discrimination". In Coté, Gerard L (ed.). Optical Diagnostics and Sensing XV: Toward Point-of-Care Diagnostics. Vol. 9332. p. 933212. doi:10.1117/12.2080996. S2CID 120527052.
- 1 2 Priore, Ryan J.; Swanstrom, Joseph A. (2014). "Multivariate optical element platform for compressed detection of fluorescence markers". In Druy, Mark A; Crocombe, Richard A (eds.). Next-Generation Spectroscopic Technologies VII. Vol. 9101. pp. 91010E. doi:10.1117/12.2053570. S2CID 120097929.
- 1 2 Priore, R.J. (2013). "OPTICS FOR BIOPHOTONICS: Multivariate optical elements beat bandpass filters in fluorescence analysis". Laser Focus World. 49 (6): 49–52.
- 1 2 Swanstrom, J.A.; Bruckman, L.S; Pearl, M.R.; et al. (2013). "Taxonomic Classification of Phytoplankton with Multivariate Optical Computing, Part I: Design and Theoretical Performance of Multivariate Optical Elements". Applied Spectroscopy. 67 (6): 220–229. Bibcode:2013ApSpe..67..620S. doi:10.1366/12-06783. PMID 23735247. S2CID 5400202.
- 1 2 Swanstrom, J.A.; Bruckman, L.S.; Pearl, M.R.; et al. (2013). "Taxonomic Classification of Phytoplankton with Multivariate Optical Computing, Part II: Design and Experimental Protocol of a Shipboard Fluorescence Imaging Photometer". Applied Spectroscopy. 67 (6): 230–239. Bibcode:2013ApSpe..67..630S. doi:10.1366/12-06784. PMID 23735248. S2CID 25533573.
- 1 2 Pearl, M.R.; Swanstrom, J.A.; Bruckman, L.S.; et al. (2013). "Taxonomic Classification of Phytoplankton with Multivariate Optical Computing, Part III: Demonstration". Applied Spectroscopy. 67 (6): 240–247. Bibcode:2013ApSpe..67..640P. doi:10.1366/12-06785. PMID 23735249. S2CID 12109872.
- 1 2 Qu, J.Y.; Chang, H.; Xiong, S. (2002). "Fluorescence spectral imaging for characterization of tissue based on multivariate statistical analysis". Journal of the Optical Society of America A. 19 (9): 1823–1831. Bibcode:2002JOSAA..19.1823Q. doi:10.1364/JOSAA.19.001823. PMID 12216876. S2CID 12214976.
- 1 2 Priore, R.J., Greer, A.E., Haibach, F.G. et al. 2003. Novel Imaging Systems: Multivariate Optical Computing in the UV-VIS. In Proc., IS&T's NIP19: International Conference on Digital Printing Technologies, Vol. 19, 906–910. New Orleans, Louisiana.
- 1 2 Pruett, Eric (2015). "Latest developments in Texas Instruments DLP near-infrared spectrometers enable the next generation of embedded compact, portable systems". In Druy, Mark A; Crocombe, Richard A; Bannon, David P (eds.). Next-Generation Spectroscopic Technologies VIII. Vol. 9482. pp. 94820C. doi:10.1117/12.2177430. S2CID 114904996.
- 1 2 Myrick, Michael L.; Soyemi, Olusola O.; Haibach, Fred; Zhang, Lixia; Greer, Ashley; Li, Hongli; Priore, Ryan; Schiza, Maria V.; Farr, J. R. (2002). "Application of multivariate optical computing to near-infrared imaging". In Christesen, Steven D; Sedlacek Iii, Arthur J (eds.). Vibrational Spectroscopy-based Sensor Systems. Vol. 4577. p. 148. doi:10.1117/12.455732. S2CID 109007082.
- 1 2 Myrick, Michael L.; Soyemi, Olusola O.; Schiza, M. V.; Farr, J. R.; Haibach, Fred; Greer, Ashley; Li, Hong; Priore, Ryan (2002). "Application of multivariate optical computing to simple near-infrared point measurements". In Jensen, James O; Spellicy, Robert L (eds.). Instrumentation for Air Pollution and Global Atmospheric Monitoring. Vol. 4574. pp. 208–215. doi:10.1117/12.455161. S2CID 110288509.
- ↑ Coates, J (2005). "A New Approach to Near- and Mid-Infrared Process Analysis – Encoded photometric infrared technology has the ability to address the demands of modern process applications, including those of the PAT initiative". Spectroscopy. 20 (1): 32–35.
- 1 2 Jones, C., Gao, L., Perkins, D. et al. 2013. Field Test of the Integrated Computational Elements: A New Optical Sensor for Downhole Fluid Analysis. Presented at the SPWLA 54th Annual Logging Symposium, New Orleans, Louisiana, 22–26 June. SPWLA-2013-YY.
- ↑ Nelson, Matthew P.; Aust, Jeffrey F.; Dobrowolski, Jerzy A.; Verly, Pierre G.; Myrick, Michael L. (1998). "Multivariate optical computation for predictive spectroscopy". In Cogswell, Carol J; Conchello, Jose-Angel; Lerner, Jeremy M; Lu, Thomas T; Wilson, Tony (eds.). Three-Dimensional and Multidimensional Microscopy: Image Acquisition and Processing V. Vol. 3261. pp. 232–243. doi:10.1117/12.310558. S2CID 108965881.
- 1 2 Boysworth, M.K.; Banerija, S.; Wilson, D.M.; et al. (2007). "Generalization of multivariate optical computations as a method for improving the speed and precision of spectroscopic analyses". Journal of Chemometrics. 22 (6): 355–365. doi:10.1002/cem.1132. S2CID 122073990.
- 1 2 Mendendorp, J.; Lodder, R.A. (2005). "Applications of integrated sensing and processing in spectroscopic imaging and sensing". Journal of Chemometrics. 19 (10): 533–542. CiteSeerX 10.1.1.141.4078 . doi:10.1002/cem.961. S2CID 17681571.
- ↑ Priore, R.J.; Haibach, F.G.; Schiza, M.V.; et al. (2004). "A Miniature Stereo Spectral Imaging System for Multivariate Optical Computing". Applied Spectroscopy. 58 (7): 870–873. Bibcode:2004ApSpe..58..870P. doi:10.1366/0003702041389418. PMID 15282055. S2CID 39015203.
- ↑ Soyemi, Olusola O.; Zhang, Lixia; Eastwood, Delyle; Li, Hongli; Gemperline, Paul J.; Myrick, Michael L. (2001). "Simple optical computing device for chemical analysis". In Descour, Michael R; Rantala, Juha T (eds.). Functional Integration of Opto-Electro-Mechanical Devices and Systems. Vol. 4284. pp. 17–28. doi:10.1117/12.426870. S2CID 137444406.
- ↑ Myrick, M.L.; Soyemi, O.; Li, H.; et al. (2001). "Spectral tolerance determination for multivariate optical element design". Fresenius' Journal of Analytical Chemistry. 369 (3–4): 351–355. doi:10.1007/s002160000642. PMID 11293715. S2CID 19109.
- 1 2 Fratkin, M. 2008. On-Line Oil Quality Sensors. Presented at the CTMA Symposium, Baltimore, Maryland, 7–9 April.
- ↑ Soyemi, Olusola O.; Gemperline, Paul J.; Zhang, Lixia; Eastwood, Delyle; Li, Hong; Myrick, Michael L. (2001). "Novel filter design algorithm for multivariate optical computing". In Vo-Dinh, Tuan; Buettgenbach, Stephanus (eds.). Advanced Environmental and Chemical Sensing Technology. Vol. 4205. p. 288. doi:10.1117/12.417462. S2CID 110391915.
- ↑ Myrick, Michael L. (1999). "New approaches to implementing predictive spectroscopy". In Siddiqui, Khalid J; Eastwood, Delyle (eds.). Pattern Recognition, Chemometrics, and Imaging for Optical Environmental Monitoring. Vol. 3854. pp. 98–102. doi:10.1117/12.372890. S2CID 119947119.
- ↑ Pruett, E. 2015. Techniques and applications of programmable spectral pattern coding in Texas Instruments DLP spectroscopy. In Proc. SPIE 9376, Emerging Digital Micromirror Device Based Systems and Applications VII, 93760H, eds. M.R. Douglass, P.S. King, and B.L. Lee. San Francisco, California, 10 March.
- ↑ Dai, B.; Urbas, A.; Douglas, C.C.; et al. (2007). "Molecular Factor Computing for Predictive Spectroscopy". Pharmaceutical Research. 24 (8): 1441–1449. CiteSeerX 10.1.1.141.5296 . doi:10.1007/s11095-007-9260-1. PMID 17380265. S2CID 3223005.
- ↑ Jones, C.M., van Zuilekom, T., and Iskander, F. 2016. How Accurate Is Enhanced Optical Fluid Analysis Compared to Lab PVT Measurements? Presented at the SPWLA 57th Annual Symposium, Reykjavik, Iceland, 25–29 June. SPWLA-2016-JJJ.
- ↑ Jones, C.M., He, T., Dai, B. et al. 2015. Measurement and Use of Formation Fluid, Saturate, and Aromatic Content, with Wireline Formation Testers. Presented at the SPWLA 56th Annual Symposium, Long Beach, California, 18–22 July. SPWLA-2015-EE.
- ↑ Hunt, I. 2014. ICE Core Technology in East Africa. Pipeline November (209): 142–145.
- ↑ Chemali, R.; Semac, W.; Balliet, R.; et al. (2014). "Formation-Evaluation Challenges and Opportunities in Deepwater". Petrophysics. 55 (2): 124–135.
- ↑ Jones, C. 2014. Optical Sensors Analyze Fluids In Situ. The American Oil and Gas Reporter September: 117–123.
- 1 2 Eriksen, K.O. (Statoil), Jones, C.M., Freese, R. et al. 2013. Field Tests of a New Optical Sensor Based on Integrated Computational. Presented at SPE Annual Technical Conference and Exhibition, New Orleans, Louisiana, 30 September–2 October. SPE-166415-MS.