National League East

Last updated

National League East
League National League
Sport Major League Baseball
Founded 1969
No. of teams5
Most recent
champion(s)
Atlanta Braves
(2023; 18th title)
Most titles Atlanta Braves (18)
National League East
Invisible Square.svg
Mapscaleline.svg
800km
500miles
Red pog.svg
Red pog.svg
Nationals
Red pog.svg
Phillies
Orange pog.svg
Mets
Blue pog.svg
Marlins
Red pog.svg
Braves
National League East Teams Location

The National League East is one of Major League Baseball's six divisions. Along with the American League Central, it is one of two divisions to have every member win at least one World Series title.

Contents

After having internal, informal divisions for scheduling purposes during the pre-expansion era, [1] the division was formally created when the National League (NL) (along with the American League) added two expansion teams and divided into two divisions, East and West effective for the 1969 season. The National League's geographical alignment was rather peculiar as its partitioning was really more north and south instead of east and west. Two teams in the Eastern Time Zone, the Atlanta Braves and the Cincinnati Reds, were in the same division as teams on the Pacific coast. This was due to the demands of the Chicago Cubs and St. Louis Cardinals, who refused to support expansion unless they were promised they would be kept together in the newly created East division.

During the two-division era, from 1969 to 1993, the Philadelphia Phillies and the Pittsburgh Pirates together owned more than half of the division titles, having won a combined 15 of 25 championships during that span. [2] They were also the only teams in the division to have won consecutive titles during that span. [3] [4] [5]

When the National League realigned into three divisions in 1994, the Pittsburgh Pirates were originally supposed to stay in the East while the Braves were to be moved to the newly created National League Central. However, the Braves, wanting to form a natural rivalry with the expansion Florida Marlins, elected to be placed in the East. Despite the Marlins offering to go to the Central, the Pirates instead gave up their spot in the East to the Braves. [6] Since then, the Pirates have tried several times unsuccessfully to be placed back in the East. [7]

Division membership

Current members

Former members

Division members

Place cursor over year for division champ or World Series team.

NL East Division [A]
Years
69 70 71 72 73 74 75 76 77 78 79 80 81 82 83 84 85 86 87 88 89 90 91 92 93 94 95 96
Chicago Cubs [C]  
Montreal Expos
New York Mets
Philadelphia Phillies
Pittsburgh Pirates [C]  
St. Louis Cardinals [C]  
  Florida Marlins [B]
  Atlanta Braves [C]
NL East Division [A]
Years
97 98 99 00 01 02 03 04 05 06 07 08 09 10 11 12 13 14 15 16 17 18 19 20 21 22 23 24
Montreal Expos Washington Nationals [D]
New York Mets
Philadelphia Phillies
Florida Marlins Miami Marlins [E]
Atlanta Braves
 Team not in division   Division Won World Series   Division Won NL Championship
A The creation of the division with the expansion of the league – with the Expos added.
B Florida Marlins added in the 1993 expansion
C The Atlanta Braves moved in from the NL West, and the Chicago Cubs, Pittsburgh Pirates, and St. Louis Cardinals moved into newly created National League Central Division
D The Montreal Expos relocated to Washington, D.C., becoming the Washington Nationals
E The Florida Marlins relocated from Miami Gardens, Florida to Miami and changed their name to the Miami Marlins

Champions by year

YearWinnerRecord%Playoff Results
1969 New York Mets (1) 100–62.617Won NLCS (Braves) 3–0
Won World Series (Orioles) 4–1
1970 Pittsburgh Pirates (1) 89–73.549Lost NLCS (Reds) 3–0
1971 Pittsburgh Pirates (2) 97–65.599Won NLCS (Giants) 3–1
Won World Series (Orioles) 4–3
1972 Pittsburgh Pirates (3) 96–59.619Lost NLCS (Reds) 3–2
1973 New York Mets (2) 82–79.509Won NLCS (Reds) 3–2
Lost World Series (Athletics) 4–3
1974 Pittsburgh Pirates (4) 88–74.543Lost NLCS (Dodgers) 3–1
1975 Pittsburgh Pirates (5) 92–69.571Lost NLCS (Reds) 3–0
1976 Philadelphia Phillies (1) 101–61.623Lost NLCS (Reds) 3–0
1977 Philadelphia Phillies (2) 101–61.623Lost NLCS (Dodgers) 3–1
1978 Philadelphia Phillies (3) 90–72.556Lost NLCS (Dodgers) 3–1
1979 Pittsburgh Pirates (6) 98–64.605Won NLCS (Reds) 3–0
Won World Series (Orioles) 4–3
1980 Philadelphia Phillies (4) 91–71.562Won NLCS (Astros) 3–2
Won World Series (Royals) 4–2
1981 Montreal Expos (1)† 60–48.556Won NLDS (Phillies) 3–2
Lost NLCS (Dodgers) 3–2
1982 St. Louis Cardinals (1) 92–70.570Won NLCS (Braves) 3–0
Won World Series (Brewers) 4–3
1983 Philadelphia Phillies (5) 90–72.556Won NLCS (Dodgers) 3–1
Lost World Series (Orioles) 4–1
1984 Chicago Cubs (1) 96–65.596Lost NLCS (Padres) 3–2
1985 St. Louis Cardinals (2) 101–61.623Won NLCS (Dodgers) 4–2
Lost World Series (Royals) 4–3
1986 New York Mets (3) 108–54.667Won NLCS (Astros) 4–2
Won World Series (Red Sox) 4–3
1987 St. Louis Cardinals (3) 95–67.586Won NLCS (Giants) 4–3
Lost World Series (Twins) 4–3
1988 New York Mets (4) 100–60.625Lost NLCS (Dodgers) 4–3
1989 Chicago Cubs (2) 93–69.574Lost NLCS (Giants) 4–1
1990 Pittsburgh Pirates (7) 95–67.586Lost NLCS (Reds) 4–2
1991 Pittsburgh Pirates (8) 98–64.605Lost NLCS (Braves) 4–3
1992 Pittsburgh Pirates (9) 96–66.593Lost NLCS (Braves) 4–3
1993 Philadelphia Phillies (6) 97–65.599Won NLCS (Braves) 4–2
Lost World Series (Blue Jays) 4–2
1994§No playoffs due to 1994–95 Major League Baseball strike
1995 Atlanta Braves (1) 90–54.625Won NLDS (Rockies) 3–1
Won NLCS (Reds) 4–0
Won World Series (Indians) 4–2
1996 Atlanta Braves (2) 96–66.593Won NLDS (Dodgers) 3–0
Won NLCS (Cardinals) 4–3
Lost World Series (Yankees) 4–2
1997 Atlanta Braves (3) 101–61.623Won NLDS (Astros) 3–0
Lost NLCS (Marlins) 4–2
1998 Atlanta Braves (4) 106–56.654Won NLDS (Cubs) 3–0
Lost NLCS (Padres) 4–2
1999 Atlanta Braves (5) 103–59.636Won NLDS (Astros) 3–1
Won NLCS (Mets) 4–2
Lost World Series (Yankees) 4–0
2000 Atlanta Braves (6) 95–67.586Lost NLDS (Cardinals) 3–0
2001 Atlanta Braves (7) 88–74.543Won NLDS (Astros) 3–0
Lost NLCS (Diamondbacks) 4–1
2002 Atlanta Braves (8) 101–59.631Lost NLDS (Giants) 3–2
2003 Atlanta Braves (9) 101–61.623Lost NLDS (Cubs) 3–2
2004 Atlanta Braves (10) 96–66.593Lost NLDS (Astros) 3–2
2005 Atlanta Braves (11) 90–72.556Lost NLDS (Astros) 3–1
2006 New York Mets (5) 97–65.599Won NLDS (Dodgers) 3–0
Lost NLCS (Cardinals) 4–3
2007 Philadelphia Phillies (7) 89–73.549Lost NLDS (Rockies) 3–0
2008 Philadelphia Phillies (8) 92–70.568Won NLDS (Brewers) 3–1
Won NLCS (Dodgers) 4–1
Won World Series (Rays) 4–1
2009 Philadelphia Phillies (9) 93–69.574Won NLDS (Rockies) 3–1
Won NLCS (Dodgers) 4–1
Lost World Series (Yankees) 4–2
2010 Philadelphia Phillies (10) 97–65.599Won NLDS (Reds) 3–0
Lost NLCS (Giants) 4–2
2011 Philadelphia Phillies (11) 102–60.630Lost NLDS (Cardinals) 3–2
2012 Washington Nationals (2) 98–64.605Lost NLDS (Cardinals) 3–2
2013 Atlanta Braves (12) 96–66.593Lost NLDS (Dodgers) 3–1
2014 Washington Nationals (3) 96–66.593Lost NLDS (Giants) 3–1
2015 New York Mets (6) 90–72.556Won NLDS (Dodgers) 3–2
Won NLCS (Cubs) 4–0
Lost World Series (Royals) 4–1
2016 Washington Nationals (4) 95–67.586Lost NLDS (Dodgers) 3–2
2017 Washington Nationals (5) 97–65.599Lost NLDS (Cubs) 3–2
2018 Atlanta Braves (13) 90–72.556Lost NLDS (Dodgers) 3–1
2019 Atlanta Braves (14) 97–65.599Lost NLDS (Cardinals) 3–2
2020†† Atlanta Braves (15) 35–25.583Won NLWC (Reds) 2–0
Won NLDS (Marlins) 3–0
Lost NLCS (Dodgers) 4–3
2021 Atlanta Braves (16) 88–73.547Won NLDS (Brewers) 3–1
Won NLCS (Dodgers) 4–2
Won World Series (Astros) 4–2
2022 Atlanta Braves (17)††† 101–61.623Lost NLDS (Phillies) 3–1
2023 Atlanta Braves (18) 104–58.642Lost NLDS (Phillies) 3–1

† – Due to the 1981 Major League Baseball strike, the season was split. Montreal won the second half and defeated first-half champion Philadelphia (59–48) in the postseason.
§ – Due to the 1994–95 Major League Baseball strike starting August 12, no official winner was awarded. Montreal was leading at the strike.
†† – Due to the COVID-19 pandemic, the season was shortened to 60 games. By virtue of the eight-team postseason format used for that season, division runner-up Miami (30–29, .508) also qualified for the playoffs.
††† – The Braves and Mets finished tied for first place with identical records. The Braves were declared division winners, due to having won the season series against the Mets, and the Mets received the wild card berth.

Most Division titles

TeamTitlesYear(s)
Atlanta Braves 181995–2005, 2013, 2018–2023
Philadelphia Phillies 111976–1978, 1980, 1983, 1993, 2007–2011
Pittsburgh Pirates 91970–1972, 1974–1975, 1979, 1990–1992
New York Mets 61969, 1973, 1986, 1988, 2006, 2015
Washington Nationals/Montreal Expos 51981, 2012, 2014, 2016–2017
St. Louis Cardinals 31982, 1985, 1987
Chicago Cubs 21984, 1989
Miami/Florida Marlins 0

Other postseason teams

YearWinnerRecord%GBPlayoff Results
1997 Florida Marlins 92–70.5689Won NLDS (Giants) 3–0
Won NLCS (Braves) 4–2
Won World Series (Indians) 4–3
1999 New York Mets* 97–66.5956.5Won NLDS (Diamondbacks) 3–1
Lost NLCS (Braves) 4–2
2000 New York Mets 94–68.5801Won NLDS (Giants) 3–1
Won NLCS (Cardinals) 4–1
Lost World Series (Yankees) 4–1
2003 Florida Marlins 91–71.56210Won NLDS (Giants) 3–1
Won NLCS (Cubs) 4–3
Won World Series (Yankees) 4–2
2010 Atlanta Braves 91–71.5626Lost NLDS (Giants) 3–1
2012 Atlanta Braves** 94–68.5804Lost NLWC (Cardinals)
2016 New York Mets** 87–75.5378Lost NLWC (Giants)
2019 Washington Nationals** 93–69.5744Won NLWC (Brewers)
Won NLDS (Dodgers) 3–2
Won NLCS (Cardinals) 4–0
Won World Series (Astros) 4–3
2020 Miami Marlins** 31–29.5174Won NLWC (Cubs) 2–0
Lost NLDS (Braves) 3–0
2022 New York Mets**††† 101–61.6230Lost NLWC (Padres) 2–1
Philadelphia Phillies** 87–75.53714Won NLWC (Cardinals) 2–0
Won NLDS (Braves) 3–1
Won NLCS (Padres) 4–1
Lost World Series (Astros) 4–2
2023 Philadelphia Phillies** 90–72.55614Won NLWC (Marlins) 2–0
Won NLDS (Braves) 3–1
Lost NLCS (Diamondbacks) 4–3
Miami Marlins** 84–78.51920Lost NLWC (Phillies) 2–0

* – Defeated the Cincinnati Reds in a one-game playoff for the Wild Card, 5–0.

** – From 2012 to 2019, and in 2021, the Wild Card was expanded to two teams. Those teams faced each other in the Wild Card Game to determine the final participant in the National League Division Series. In 2020 only, eight teams, including the three division winners, played in a best-of-three Wild Card Series, with the winners advancing to the Division Series. Starting in 2022, the Wild Card field was increased to three teams, and along with the lowest-ranked division winner, qualified for the best-of-three Wild Card Series to determine the remaining two slots in the Division Series.

††† – In 2022, the Braves and Mets finished tied for first place with identical 101-61 records. The Braves were declared division winners, due to having won the season series against the Mets, and the Mets received the wild card berth.

Season results

(#)Denotes team that won the World Series
(#)Denotes team that won the National League pennant, but lost World Series
(#)Denotes team that qualified for the MLB postseason
SeasonTeam (record)
1st2nd3rd4th5th6th7th
1969 N.Y. Mets (100–62) Chicago Cubs (92–70) Pittsburgh (88–74) St. Louis (87–75) Philadelphia (63–99) Montreal (52–110)
1970 Pittsburgh (89–73) Chicago Cubs (84–78) N.Y. Mets (83–79) St. Louis (76–86) Philadelphia (73–88) Montreal (73–89)
1971 Pittsburgh (97–65) St. Louis (90–72) Chicago Cubs (83–79) N.Y. Mets (83–79) Montreal (71–90) Philadelphia (67–95)
1972 Pittsburgh (96–59) Chicago Cubs (85–70) N.Y. Mets (83–73) St. Louis (75–81) Montreal (70–86) Philadelphia (59–97)
1973 N.Y. Mets (82–79) St. Louis (81–81) Pittsburgh (80–82) Montreal (79–83) Chicago Cubs (77–84) Philadelphia (71–91)
1974 Pittsburgh (88–74) St. Louis (86–75) Philadelphia (80–82) Montreal (79–82) N.Y. Mets (71–91) Chicago Cubs (66–96)
1975 Pittsburgh (92–69) Philadelphia (86–76) N.Y. Mets (82–80) St. Louis (82–80) Chicago Cubs (75–87) Montreal (75–87)
1976 Philadelphia (101–61) Pittsburgh (92–70) N.Y. Mets (86–76) Chicago Cubs (75–87) St. Louis (72–90) Montreal (55–107)
1977 Philadelphia (101–61) Pittsburgh (96–66) St. Louis (83–79) Chicago Cubs (81–81) Montreal (75–87) N.Y. Mets (64–98)
1978 Philadelphia (90–72) Pittsburgh (88–73) Chicago Cubs (79–83) Montreal (76–86) St. Louis (69–93) N.Y. Mets (66–96)
1979 Pittsburgh (98–64) Montreal (95–65) St. Louis (86–76) Philadelphia (84–78) Chicago Cubs (80–82) N.Y. Mets (63–99)
1980 Philadelphia (91–71) Montreal (90–72) Pittsburgh (83–79) St. Louis (74–88) N.Y. Mets (67–95) Chicago Cubs (64–98)
1981 St. Louis (59–43) Montreal (60–48) Philadelphia (59–48) Pittsburgh (46–56) N.Y. Mets (41–62) Chicago Cubs (38–65)
1982 St. Louis (92–70) Philadelphia (89–73) Montreal (86–76) Pittsburgh (84–78) Chicago Cubs (73–89) N.Y. Mets (65–97)
1983 Philadelphia (90–72) Pittsburgh (84–78) Montreal (82–80) St. Louis (79–83) Chicago Cubs (71–91) N.Y. Mets (68–94)
1984 Chicago Cubs (96–65) N.Y. Mets (90–72) St. Louis (84–78) Philadelphia (81–81) Montreal (78–83) Pittsburgh (75–87)
1985 St. Louis (101–61) N.Y. Mets (98–64) Montreal (84–77) Chicago Cubs (77–84) Philadelphia (75–87) Pittsburgh (57–104)
1986 N.Y. Mets (108–54) Philadelphia (86–75) St. Louis (79–82) Montreal (78–83) Chicago Cubs (70–90) Pittsburgh (64–98)
1987 St. Louis (95–67) N.Y. Mets (92–70) Montreal (91–71) Philadelphia (80–82) Pittsburgh (80–82) Chicago Cubs (76–85)
1988 N.Y. Mets (100–60) Pittsburgh (85–75) Montreal (81–81) Chicago Cubs (77–85) St. Louis (76–86) Philadelphia (65–96)
1989 Chicago Cubs (93–69) N.Y. Mets (87–75) St. Louis (86–76) Montreal (81–81) Pittsburgh (74–88) Philadelphia (67–95)
1990 Pittsburgh (95–67) N.Y. Mets (91–71) Montreal (85–77) Chicago Cubs (77–85) Philadelphia (77–85) St. Louis (70–92)
1991 Pittsburgh (98–64) St. Louis (84–78) Philadelphia (78–84) Chicago Cubs (77–83) N.Y. Mets (77–84) Montreal (71–90)
1992 Pittsburgh (96–66) Montreal (87–75) St. Louis (83–79) Chicago Cubs (78–84) N.Y. Mets (72–90) Philadelphia (70–92)
1993 Philadelphia (97–65) Montreal (94–68) St. Louis (87–75) Chicago Cubs (84–78) Pittsburgh (75–87) Florida (64–98) N.Y. Mets (59–103)
1994 Montreal (74–40) Atlanta (68–46) N.Y. Mets (55–58) Philadelphia (54–61) Florida (51–64)
1995 (1) Atlanta (90–54) N.Y. Mets (69–75) Philadelphia (69–75) Florida (67–76) Montreal (66–78)
1996 (1) Atlanta (96–66) Montreal (88–74) Florida (80–82) N.Y. Mets (71–91) Philadelphia (67–95)
1997 (1) Atlanta (101–61)(4) Florida (92–70) N.Y. Mets (88–74) Montreal (78–84) Philadelphia (68–94)
1998 (1) Atlanta (106–56) N.Y. Mets (88–74) Philadelphia (75–87) Montreal (65–97) Florida (54–108)
1999 (1) Atlanta (103–59)(4) N.Y. Mets [a] (97–66) Philadelphia (77–85) Montreal (68–94) Florida (64–98)
2000 (3) Atlanta [b] (95–67)(4) N.Y. Mets (94–68) Florida (79–82) Montreal (67–95) Philadelphia (65–97)
2001 (3) Atlanta (88–74) Philadelphia (86–76) N.Y. Mets (82–80) Florida (76–86) Montreal (68–94)
2002 (1) Atlanta (101–59) Montreal (83–79) Philadelphia (80–81) Florida (79–83) N.Y. Mets (75–86)
2003 (1) Atlanta (101–61)(4) Florida (91–71) Philadelphia (86–76) Montreal (83–79) N.Y. Mets (66–95)
2004 (2) Atlanta (96–66) Philadelphia (86–76) Florida (83–79) N.Y. Mets (71–91) Montreal (67–95)
2005 (2) Atlanta (90–72) Philadelphia (88–74) Florida (83–79) N.Y. Mets (83–79) Washington (81–81)
2006 (1) N.Y. Mets (97–65) Philadelphia (85–77) Atlanta (79–83) Florida (78–84) Washington (71–91)
2007 (2) Philadelphia (89–73) N.Y. Mets (88–74) Atlanta (84–78) Washington (73–89) Florida (71–91)
2008 (2) Philadelphia (92–70) N.Y. Mets (89–73) Florida (84–77) Atlanta (72–90) Washington (59–102)
2009 (2) Philadelphia (93–69) Florida (87–75) Atlanta (86–76) N.Y. Mets (70–92) Washington (59–103)
2010 (1) Philadelphia (97–65)(4) Atlanta (91–71) Florida (80–82) N.Y. Mets (79–83) Washington (69–93)
2011 (1) Philadelphia (102–60) Atlanta (89–73) Washington (80–81) N.Y. Mets (77–85) Florida (72–90)
2012 (1) Washington (98–64)(4) Atlanta (94–68) Philadelphia (81–81) N.Y. Mets (74–88) Miami (69–93)
2013 (2) Atlanta (96–66) Washington (86–76) N.Y. Mets (74–88) Philadelphia (73–89) Miami (62–100)
2014 (1) Washington (96–66) Atlanta (79–83) N.Y. Mets (79–83) Miami (77–85) Philadelphia (73–89)
2015 (3) N.Y. Mets (90–72) Washington (83–79) Miami (71–91) Atlanta (67–95) Philadelphia (63–99)
2016 (2) Washington (95–67)(4) N.Y. Mets [c] (87–75) Miami (79–82) Philadelphia (71–91) Atlanta (68–93)
2017 (2) Washington (97–65) Miami (77–85) Atlanta (72–90) N.Y. Mets (70–92) Philadelphia (66–96)
2018 (3) Atlanta (90–72) Washington (82–80) Philadelphia (80–82) N.Y. Mets (77–85) Miami (63–98)
2019 (2) Atlanta (97–65)(4) Washington (93–69) N.Y. Mets (86–76) Philadelphia (81–81) Miami (57–105)
  • 2020: Due to the COVID-19 pandemic, the season was shortened to 60 games. The postseason field was expanded to eight teams and the wild-card round became a best-of-three series.
2020 (2) Atlanta (35–25)(6) Miami (31–29) Philadelphia (28–32) Washington (26–34) N.Y. Mets (26–34)
2021 (3) Atlanta (88–73) Philadelphia (82–80) N.Y. Mets (77–85) Miami (67–95) Washington (65–97)
2022 (2) Atlanta [d] (101–61)(4) N.Y. Mets [d] (101–61)(6) Philadelphia (87–75) Miami (69–93) Washington (55–107)
2023 (1) Atlanta (104–58)(4) Philadelphia (90–72)(5) Miami [e] (84–78) N.Y. Mets (75–87) Washington (71–91)
Notes and Tiebreakers

See also

Related Research Articles

In Major League Baseball, the National League Division Series (NLDS) determines which two teams from the National League will advance to the National League Championship Series. The Division Series consists of two best-of-five series, featuring each of the two division winners with the best records and the winners of the wild-card play-offs.

<span class="mw-page-title-main">Miami Marlins</span> Major League Baseball team in Miami, Florida

The Miami Marlins are an American professional baseball team based in Miami. The Marlins compete in Major League Baseball (MLB) as a member club of the National League (NL) East Division. The club's home ballpark is LoanDepot Park.

<span class="mw-page-title-main">National League (baseball)</span> League within Major League Baseball

The National League of Professional Baseball Clubs, known simply as the National League (NL), is the older of two leagues constituting Major League Baseball (MLB) in the United States and Canada, and the world's oldest extant professional team sports league. Founded on February 2, 1876, to replace the National Association of Professional Base Ball Players (NAPBBP) of 1871–1875, the NL is sometimes called the Senior Circuit, in contrast to MLB's other league, the American League, which was founded 25 years later and is called the "Junior Circuit". Both leagues currently have 15 teams.

<span class="mw-page-title-main">Interleague play</span> Regular-season baseball games between the American and National Leagues

Interleague play in Major League Baseball refers to regular-season baseball games played between an American League (AL) team and a National League (NL) team. Interleague play was first introduced during the 1997 Major League Baseball season. Prior to that, matchups between AL teams and NL teams occurred only during spring training, the All-Star Game, other exhibition games, and the World Series. Unlike modern interleague play, none of these contests, except for the World Series, counted toward official team or league records.

<span class="mw-page-title-main">American League East</span> Division of Major League Baseball

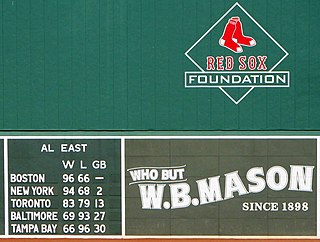
The American League East is one of Major League Baseball's six divisions. MLB consists of an East, Central, and West division for each of its two 15-team leagues, the American League (AL) and National League (NL). This division was created before the start of the 1969 season along with the American League West division. Before that time, each league consisted of 10 teams without any divisions.

The National League Central is one of Major League Baseball's six divisions. This division was created in 1994, by moving two teams from the National League West and three teams from the National League East.

The National League West is one of Major League Baseball's six divisions. This division was created for the 1969 season when the National League (NL) expanded to 12 teams by adding the San Diego Padres and the Montreal Expos. For purpose of keeping a regular-season of 162 games, half of the teams were put into the new East Division and half into the new West Division. Within each division, the teams played 18 games each against their five division mates, and also 12 games against the teams in the opposite division, totaling 162 games. Prior to 1969, the National League had informal, internal divisions strictly for scheduling purposes.

The 1995 National League Championship Series (NLCS), the second round of baseball's 1995 National League playoffs, matched the East Division champion Atlanta Braves against the Central Division champion Cincinnati Reds. The Reds had the home field advantage due to a predetermined formula which awarded home field advantage to the Central Division champion or its playoff opponent as opposed to the host being the team with the most wins.

This article details the history of the Atlanta Braves, which concerns the evolution of the Major League Baseball team Atlanta Braves over time.

The following is a timeline of franchise evolution in Major League Baseball. The histories of franchises in the National Association of Base Ball Players (NABBP), National Association of Professional Base Ball Players (NA), Union Association (UA), and American Association (AA) before they joined the National League (NL) are also included. In 1900 the minor league Western League renamed itself the American League (AL). All of the 1899 Western League teams were a part of the transformation with the Saint Paul Apostles moving to Chicago and to play as the White Stockings. In 1901 the AL declared itself a Major League. For its inaugural major league season the AL dropped its teams in Indianapolis, Buffalo and Minneapolis and replaced them with franchises in Boston, Philadelphia, and Baltimore and the Kansas City Blues moved to Washington to play as the Senators.

<span class="mw-page-title-main">Braves–Mets rivalry</span> Major League Baseball rivalry

The Braves–Mets rivalry is a rivalry between the Atlanta Braves and New York Mets. Both clubs are members of Major League Baseball's National League (NL) East division. The rivalry between the two clubs was particularly fierce during the late 1990s and early 2000s.

The 1999 National League Wild Card tie-breaker game was a one-game extension to Major League Baseball's (MLB) 1999 regular season, played between the New York Mets and Cincinnati Reds to determine the winner of the National League (NL) wild card. It was played at Cinergy Field in Cincinnati, on October 4, 1999. The Mets won the game, 5–0, with starting pitcher Al Leiter pitching a two-hit shutout. As a result, the Mets qualified for the postseason and the Reds did not.

<span class="mw-page-title-main">Phillies–Pirates rivalry</span> Major League Baseball in-state rivalry in Pennsylvania

The Phillies–Pirates rivalry is a Major League Baseball (MLB) rivalry between the Philadelphia Phillies and Pittsburgh Pirates. Both clubs are members of MLB's National League (NL); the Phillies are members of the NL East division, while the Pirates are members of the NL Central division. The rivalry was considered by some to be one of the best in the NL. The rivalry started when the Pittsburgh Pirates entered NL play in their fifth season of 1887, four years after the Phillies.

Throughout its history, Major League Baseball rivalries have occurred between many teams and cities. Rivalries have arisen for many different reasons, the primary ones including geographic proximity, familiarity with opponents, various incidents, and cultural, linguistic, or national pride.

<span class="mw-page-title-main">2014 National League Wild Card Game</span> Play-in game during postseason

The 2014 National League Wild Card Game was a play-in game during Major League Baseball's (MLB) 2014 postseason played between the National League's (NL) two wild card teams, the San Francisco Giants and the Pittsburgh Pirates. It was held at PNC Park in Pittsburgh, Pennsylvania, on October 1, 2014, starting at 8:07 p.m. EDT. After both teams finished the regular season with identical records of 88–74, the Pirates were awarded home field for the game, as they won the season series against the Giants, 4–2. Despite this advantage, the Giants won by a score of 8–0 and advanced to play the Washington Nationals in the NL Division Series. In addition to being the third NL Wild Card Game played, it is notable for the first postseason grand slam hit by a shortstop. The game was televised on ESPN, and was also broadcast on ESPN Radio.

<span class="mw-page-title-main">2019 New York Mets season</span> Major League Baseball team season

The 2019 New York Mets season was the franchise's 58th season and the team's 11th season at Citi Field. Despite improving on their 77–85 campaign from last year by 9 games with an 86–76 record, they were three games behind the Milwaukee Brewers for a wild card spot and thus missed the playoffs for the third consecutive season. Their division rival, the Washington Nationals, went on to win the World Series.

<span class="mw-page-title-main">2020 National League Division Series</span>

The 2020 National League Division Series were two best-of-five-games series in Major League Baseball (MLB) to determine the participating teams in the 2020 National League Championship Series. These matchups were:

The Slide was a baseball play that occurred in Game 7 of the 1992 National League Championship Series (NLCS) on October 14, 1992, at Atlanta–Fulton County Stadium in Atlanta, Georgia. In 1992, the Atlanta Braves returned to the NLCS and once again defeated the Pittsburgh Pirates in seven games, culminating in a dramatic game seven win. Francisco Cabrera's two-out single that scored David Justice and Sid Bream capped a three-run rally in the bottom of the ninth inning that gave the Braves a 3–2 victory. It was the third time in post-season history that the tying and winning runs had scored on a single play in the ninth inning. This marked the end of the three-year divisional championship run of the Pittsburgh Pirates, who after the 1992 season lost Barry Bonds, Doug Drabek, and other key players from those championship teams. The Pirates did not have another winning season until 2013.

The 2022 National League Wild Card Series were two best-of-three playoff series in Major League Baseball (MLB) to determine the participating teams of the 2022 National League Division Series. Both Wild Card Series began on October 7, with Game 2s scheduled for October 8 and Game 3s, if necessary, scheduled for October 9. ESPN broadcast both Wild Card Series together with ESPN Radio. These matchups were:

<span class="mw-page-title-main">2023 National League Wild Card Series</span>

The 2023 National League Wild Card Series were the two best-of-three playoff series in Major League Baseball (MLB) to determine the participating teams of the 2023 National League Division Series (NLDS). Both Wild Card Series began on October 3, with Game 2s scheduled for October 4. ESPN broadcast both Wild Card Series in the United States together with ESPN Radio.

References

  1. "Boston Braves go to Milwaukee". Pittsburgh Press. United Press. March 18, 1953. p. 1.
  2. Collier, Gene (September 27, 1993). "Pirates, Phillies Have Owned the Outgoing NL East Division". Pittsburgh Post-Gazette. p. D1.
  3. Collier, Gene (July 4, 2005). "PiratesPhillies: A Rivalry Lost and Missed". Pittsburgh Post-Gazette. p. D1.
  4. Von Benko, George (July 7, 2005). "Notes: Phils–Pirates rivalry fading". Philadelphia Phillies. Major League Baseball. Archived from the original on July 14, 2011. Retrieved January 3, 2011.
  5. "Pirates perform rare three-peat feat 4-2". USA Today. September 28, 1992. p. 5C.
  6. Chass, Murray (September 16, 1993). "BASEBALL; Pirates Relent on New Alignment". The New York Times.
  7. "Starkey: Pirates in American League' Yes!". TribLIVE.com. June 16, 2011. Retrieved October 4, 2014.