Independence is a fundamental notion in probability theory, as in statistics and the theory of stochastic processes.
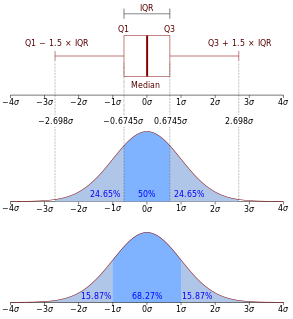
In probability theory, the central limit theorem (CLT) establishes that, in many situations, when independent random variables are added, their properly normalized sum tends toward a normal distribution even if the original variables themselves are not normally distributed. The theorem is a key concept in probability theory because it implies that probabilistic and statistical methods that work for normal distributions can be applicable to many problems involving other types of distributions.
In probability theory, a probability density function (PDF), or density of a continuous random variable, is a function whose value at any given sample in the sample space can be interpreted as providing a relative likelihood that the value of the random variable would equal that sample. In other words, while the absolute likelihood for a continuous random variable to take on any particular value is 0, the value of the PDF at two different samples can be used to infer, in any particular draw of the random variable, how much more likely it is that the random variable would equal one sample compared to the other sample.
In probability, and statistics, a multivariate random variable or random vector is a list of mathematical variables each of whose value is unknown, either because the value has not yet occurred or because there is imperfect knowledge of its value. The individual variables in a random vector are grouped together because they are all part of a single mathematical system — often they represent different properties of an individual statistical unit. For example, while a given person has a specific age, height and weight, the representation of these features of an unspecified person from within a group would be a random vector. Normally each element of a random vector is a real number.
In statistics, the kth order statistic of a statistical sample is equal to its kth-smallest value. Together with rank statistics, order statistics are among the most fundamental tools in non-parametric statistics and inference.
In statistics, Gibbs sampling or a Gibbs sampler is a Markov chain Monte Carlo (MCMC) algorithm for obtaining a sequence of observations which are approximated from a specified multivariate probability distribution, when direct sampling is difficult. This sequence can be used to approximate the joint distribution ; to approximate the marginal distribution of one of the variables, or some subset of the variables ; or to compute an integral. Typically, some of the variables correspond to observations whose values are known, and hence do not need to be sampled.

Given random variables , that are defined on a probability space, the joint probability distribution for is a probability distribution that gives the probability that each of falls in any particular range or discrete set of values specified for that variable. In the case of only two random variables, this is called a bivariate distribution, but the concept generalizes to any number of random variables, giving a multivariate distribution.
In probability theory, the multinomial distribution is a generalization of the binomial distribution. For example, it models the probability of counts for each side of a k-sided die rolled n times. For n independent trials each of which leads to a success for exactly one of k categories, with each category having a given fixed success probability, the multinomial distribution gives the probability of any particular combination of numbers of successes for the various categories.

In probability and statistics, the Dirichlet distribution, often denoted , is a family of continuous multivariate probability distributions parameterized by a vector of positive reals. It is a multivariate generalization of the beta distribution, hence its alternative name of multivariate beta distribution (MBD). Dirichlet distributions are commonly used as prior distributions in Bayesian statistics, and in fact the Dirichlet distribution is the conjugate prior of the categorical distribution and multinomial distribution.

In probability theory and statistics, the noncentral chi-square distribution is a noncentral generalization of the chi-square distribution. It often arises in the power analysis of statistical tests in which the null distribution is a chi-square distribution; important examples of such tests are the likelihood-ratio tests.

In statistics, multinomial logistic regression is a classification method that generalizes logistic regression to multiclass problems, i.e. with more than two possible discrete outcomes. That is, it is a model that is used to predict the probabilities of the different possible outcomes of a categorically distributed dependent variable, given a set of independent variables.
In probability theory, Dirichlet processes are a family of stochastic processes whose realizations are probability distributions. In other words, a Dirichlet process is a probability distribution whose range is itself a set of probability distributions. It is often used in Bayesian inference to describe the prior knowledge about the distribution of random variables—how likely it is that the random variables are distributed according to one or another particular distribution.
In probability theory and statistics, the Dirichlet-multinomial distribution is a family of discrete multivariate probability distributions on a finite support of non-negative integers. It is also called the Dirichlet compound multinomial distribution (DCM) or multivariate Pólya distribution. It is a compound probability distribution, where a probability vector p is drawn from a Dirichlet distribution with parameter vector , and an observation drawn from a multinomial distribution with probability vector p and number of trials n. The Dirichlet parameter vector captures the prior belief about the situation and can be seen as a pseudocount: observations of each outcome that occur before the actual data is collected. The compounding corresponds to a Pólya urn scheme. It is frequently encountered in Bayesian statistics, machine learning, empirical Bayes methods and classical statistics as an overdispersed multinomial distribution.
The sample mean or empirical mean and the sample covariance are statistics computed from a collection of data on one or more random variables. The sample mean and sample covariance are estimators of the population mean and population covariance, where the term population refers to the set from which the sample was taken.
In probability theory and statistics, a categorical distribution is a discrete probability distribution that describes the possible results of a random variable that can take on one of K possible categories, with the probability of each category separately specified. There is no innate underlying ordering of these outcomes, but numerical labels are often attached for convenience in describing the distribution,. The K-dimensional categorical distribution is the most general distribution over a K-way event; any other discrete distribution over a size-K sample space is a special case. The parameters specifying the probabilities of each possible outcome are constrained only by the fact that each must be in the range 0 to 1, and all must sum to 1.
In probability theory, the Bapat–Beg theorem gives the joint probability distribution of order statistics of independent but not necessarily identically distributed random variables in terms of the cumulative distribution functions of the random variables. Ravindra Bapat and Beg published the theorem in 1989, though they did not offer a proof. A simple proof was offered by Hande in 1994.
In statistics, the generalized Dirichlet distribution (GD) is a generalization of the Dirichlet distribution with a more general covariance structure and almost twice the number of parameters. Random variables with a GD distribution are not completely neutral.
In statistics, Lukacs's proportion-sum independence theorem is a result that is used when studying proportions, in particular the Dirichlet distribution. It is named after Eugene Lukacs.

In probability theory, a logit-normal distribution is a probability distribution of a random variable whose logit has a normal distribution. If Y is a random variable with a normal distribution, and P is the standard logistic function, then X = P(Y) has a logit-normal distribution; likewise, if X is logit-normally distributed, then Y = logit(X)= log is normally distributed. It is also known as the logistic normal distribution, which often refers to a multinomial logit version (e.g.).
In probability theory and statistics, the Dirichlet negative multinomial distribution is a multivariate distribution on the non-negative integers. It is a multivariate extension of the beta negative binomial distribution. It is also a generalization of the negative multinomial distribution allowing for heterogeneity or overdispersion to the probability vector. It is used in quantitative marketing research to flexibly model the number of household transactions across several brands.


