Related Research Articles

Psychological statistics is application of formulas, theorems, numbers and laws to psychology. Statistical methods for psychology include development and application statistical theory and methods for modeling psychological data. These methods include psychometrics, factor analysis, experimental designs, and Bayesian statistics. The article also discusses journals in the same field.

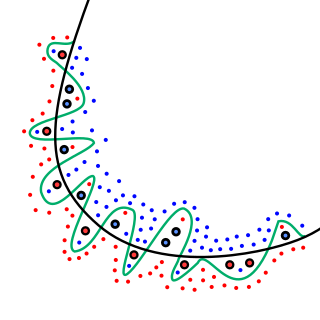
In mathematical modeling, overfitting is "the production of an analysis that corresponds too closely or exactly to a particular set of data, and may therefore fail to fit to additional data or predict future observations reliably". An overfitted model is a mathematical model that contains more parameters than can be justified by the data. The essence of overfitting is to have unknowingly extracted some of the residual variation as if that variation represented underlying model structure.

In statistics, the logistic model is a statistical model that models the probability of an event taking place by having the log-odds for the event be a linear combination of one or more independent variables. In regression analysis, logistic regression is estimating the parameters of a logistic model. Formally, in binary logistic regression there is a single binary dependent variable, coded by an indicator variable, where the two values are labeled "0" and "1", while the independent variables can each be a binary variable or a continuous variable. The corresponding probability of the value labeled "1" can vary between 0 and 1, hence the labeling; the function that converts log-odds to probability is the logistic function, hence the name. The unit of measurement for the log-odds scale is called a logit, from logistic unit, hence the alternative names. See § Background and § Definition for formal mathematics, and § Example for a worked example.
In statistics, a categorical variable is a variable that can take on one of a limited, and usually fixed, number of possible values, assigning each individual or other unit of observation to a particular group or nominal category on the basis of some qualitative property. In computer science and some branches of mathematics, categorical variables are referred to as enumerations or enumerated types. Commonly, each of the possible values of a categorical variable is referred to as a level. The probability distribution associated with a random categorical variable is called a categorical distribution.
In statistics, the coefficient of multiple correlation is a measure of how well a given variable can be predicted using a linear function of a set of other variables. It is the correlation between the variable's values and the best predictions that can be computed linearly from the predictive variables.
Linear discriminant analysis (LDA), normal discriminant analysis (NDA), or discriminant function analysis is a generalization of Fisher's linear discriminant, a method used in statistics and other fields, to find a linear combination of features that characterizes or separates two or more classes of objects or events. The resulting combination may be used as a linear classifier, or, more commonly, for dimensionality reduction before later classification.
In statistics, multicollinearity is a phenomenon in which one predictor variable in a multiple regression model can be linearly predicted from the others with a substantial degree of accuracy. In this situation, the coefficient estimates of the multiple regression may change erratically in response to small changes in the model or the data. Multicollinearity does not reduce the predictive power or reliability of the model as a whole, at least within the sample data set; it only affects calculations regarding individual predictors. That is, a multivariate regression model with collinear predictors can indicate how well the entire bundle of predictors predicts the outcome variable, but it may not give valid results about any individual predictor, or about which predictors are redundant with respect to others.

In statistics, the coefficient of determination, denoted R2 or r2 and pronounced "R squared", is the proportion of the variation in the dependent variable that is predictable from the independent variable(s).

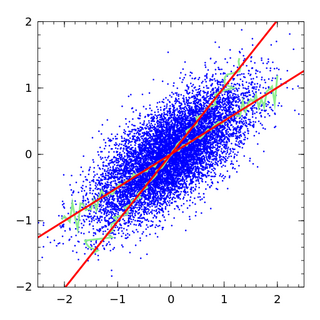
Regression dilution, also known as regression attenuation, is the biasing of the linear regression slope towards zero, caused by errors in the independent variable.
In statistics, canonical analysis belongs to the family of regression methods for data analysis. Regression analysis quantifies a relationship between a predictor variable and a criterion variable by the coefficient of correlation r, coefficient of determination r2, and the standard regression coefficient β. Multiple regression analysis expresses a relationship between a set of predictor variables and a single criterion variable by the multiple correlation R, multiple coefficient of determination R², and a set of standard partial regression weights β1, β2, etc. Canonical variate analysis captures a relationship between a set of predictor variables and a set of criterion variables by the canonical correlations ρ1, ρ2, ..., and by the sets of canonical weights C and D.
In statistics, multinomial logistic regression is a classification method that generalizes logistic regression to multiclass problems, i.e. with more than two possible discrete outcomes. That is, it is a model that is used to predict the probabilities of the different possible outcomes of a categorically distributed dependent variable, given a set of independent variables.
Multilevel models are statistical models of parameters that vary at more than one level. An example could be a model of student performance that contains measures for individual students as well as measures for classrooms within which the students are grouped. These models can be seen as generalizations of linear models, although they can also extend to non-linear models. These models became much more popular after sufficient computing power and software became available.
Omnibus tests are a kind of statistical test. They test whether the explained variance in a set of data is significantly greater than the unexplained variance, overall. One example is the F-test in the analysis of variance. There can be legitimate significant effects within a model even if the omnibus test is not significant. For instance, in a model with two independent variables, if only one variable exerts a significant effect on the dependent variable and the other does not, then the omnibus test may be non-significant. This fact does not affect the conclusions that may be drawn from the one significant variable. In order to test effects within an omnibus test, researchers often use contrasts.
In statistics, shrinkage is the reduction in the effects of sampling variation. In regression analysis, a fitted relationship appears to perform less well on a new data set than on the data set used for fitting. In particular the value of the coefficient of determination 'shrinks'. This idea is complementary to overfitting and, separately, to the standard adjustment made in the coefficient of determination to compensate for the subjunctive effects of further sampling, like controlling for the potential of new explanatory terms improving the model by chance: that is, the adjustment formula itself provides "shrinkage." But the adjustment formula yields an artificial shrinkage.
Joseph Michael Hilbe was an American statistician and philosopher, founding President of the International Astrostatistics Association(IAA) and one of the most prolific authors of books on statistical modeling in the early twenty-first century. Hilbe was an elected Fellow of the American Statistical Association as well as an elected member of the International Statistical Institute (ISI), for which he founded the ISI astrostatistics committee in 2009. Hilbe was also a Fellow of the Royal Statistical Society and Full Member of the American Astronomical Society.
Segmented regression, also known as piecewise regression or broken-stick regression, is a method in regression analysis in which the independent variable is partitioned into intervals and a separate line segment is fit to each interval. Segmented regression analysis can also be performed on multivariate data by partitioning the various independent variables. Segmented regression is useful when the independent variables, clustered into different groups, exhibit different relationships between the variables in these regions. The boundaries between the segments are breakpoints.
In statistics, regression validation is the process of deciding whether the numerical results quantifying hypothesized relationships between variables, obtained from regression analysis, are acceptable as descriptions of the data. The validation process can involve analyzing the goodness of fit of the regression, analyzing whether the regression residuals are random, and checking whether the model's predictive performance deteriorates substantially when applied to data that were not used in model estimation.
In statistics, separation is a phenomenon associated with models for dichotomous or categorical outcomes, including logistic and probit regression. Separation occurs if the predictor is associated with only one outcome value when the predictor range is split at a certain value.
In statistics, the one in ten rule is a rule of thumb for how many predictor parameters can be estimated from data when doing regression analysis while keeping the risk of overfitting low. The rule states that one predictive variable can be studied for every ten events. For logistic regression the number of events is given by the size of the smallest of the outcome categories, and for survival analysis it is given by the number of uncensored events.
Pseudo-R-squared values are used when the outcome variable is nominal or ordinal such that the coefficient of determination R2 cannot be applied as a measure for goodness of fit.
References
- 1 2 "N.J.D. Nagelkerke, 1951-". Album Academicum. Retrieved 2019-03-13.
- ↑ Nagelkerke, Nico J. D. (2012). Courtesans and Consumption. Eburon Uitgeverij B.V. p. 221. ISBN 9789059726031.
- ↑ "Collaborators". Manitoba HIV Research Group. Retrieved 2019-03-13.