Node influence metric

Last updated

In graph theory and network analysis, node influence metrics are measures that rank or quantify the influence of every node (also called vertex) within a graph. They are related to centrality indices. Applications include measuring the influence of each person in a social network, understanding the role of infrastructure nodes in transportation networks, the Internet, or urban networks, and the participation of a given node in disease dynamics.

Contents

Origin and development

The traditional approach to understanding node importance is via centrality indicators. Centrality indices are designed to produce a ranking which accurately identifies the most influential nodes. Since the mid 2000s, however, social scientists and network physicists have begun to question the suitability of centrality indices for understanding node influence. Centralities may indicate the most influential nodes, but they are rather less informative for the vast majority of nodes which are not highly influential.

Borgatti and Everett's 2006 review article [1] showed that the accuracy of centrality indices is highly dependent on network topology. This finding has been repeatedly observed since then. (e.g. [2] [3] ). In 2012, Bauer and colleagues reminded us that centrality indices only rank nodes but do not quantify the difference between them. [4] In 2013, Sikic and colleagues presented strong evidence that centrality indices considerably underestimate the power of non-hub nodes. [5] The reason is quite clear. The accuracy of a centrality measure depends on network topology, but complex networks have heterogeneous topology. Hence a centrality measure which is appropriate for identifying highly influential nodes will most likely be inappropriate for the remainder of the network. [3]

This has inspired the development of novel methods designed to measure the influence of all network nodes. The most general of these are the accessibility, which uses the diversity of random walks to measure how accessible the rest of the network is from a given start node, [6] and the expected force, derived from the expected value of the force of infection generated by a node. [3] Both of these measures can be meaningfully computed from the structure of the network alone.

Accessibility

The Accessibility is derived from the theory of random walks. It measures the diversity of self-avoiding walks which start from a given node. A walk on a network is a sequence of adjacent vertices; a self-avoiding walk visits (lists) each vertex at most once. The original work used simulated walks of length 60 to characterize the network of urban streets in a Brazilian city. [6] It was later formalized as a modified form of hierarchical degree which controls for both transmission probabilities and the diversity of walks of a given fixed length. [7]

Definition

The hierarchical degree measures the number of nodes reachable from a start node by performing walks of length . For a fixed and walk type, each of these neighbors is reached with a (potentially different) probability . Given a vector of such probabilities, the accessibility of node at scale is defined

The probabilities can be based on uniform-probability random walks, or additionally modulated by edge weights and/or explicit (per edge) transmission probabilities. [7]

Applications

The accessibility has been shown to reveal community structure in urban networks, [6] corresponds to the number of nodes which can be visited in a defined time period, [7] and is predictive of the outcome of epidemiological SIR model spreading processes on networks with large diameter and low density. [2]

Expected force

The expected force measures node influence from an epidemiological perspective. It is the expected value of the force of infection generated by the node after two transmissions.

Definition

The expected force of a node is given by

where the sum is taken over the set of all possible transmission clusters resulting from two transmissions starting from . That is, node and two of its neighbors or , one of its neighbors (called infected) and a neighbor of the infected neighbor. contains all possible orderings of the transmission events, so two clusters may contain the same nodes if they got infected in a different order. is the normalized cluster degree of cluster , that is, the number of edges with exactly one endpoint in cluster .

The definition naturally extends to directed networks by limiting the enumeration by edge direction. Likewise, extension to weighted networks, or networks with heterogeneous transmission probabilities, is a matter of adjusting the normalization of to include the probability that that cluster forms. It is also possible to use more than two transmissions to define the set . [3]

Applications

The expected force has been shown to strongly correlate with SI, SIS, and SIR epidemic outcomes over a broad range of network topologies, both simulated and empirical. [3] [8] It has also been used to measure the pandemic potential of world airports, [9] and mentioned in the context of digital payments, [10] ecology, [11] fitness, [12] and project management. [13]

Other approaches

Others suggest metrics which explicitly encode the dynamics of a specified process unfolding on the network. The dynamic influence is the proportion of infinite walks starting from each node, where walk steps are scaled such that the linear dynamics of the system are expected to converge to a non-null steady state. [14] The Impact sums, over increasing walk lengths, the probability of transmission to the end node of the walk and that the end node has not been previously visited by a shorter walk. [4] While both measures well predict the outcome of the dynamical systems they encode, in each case the authors admit that results from one dynamic do not translate to other dynamics.

Related Research Articles

<span class="mw-page-title-main">Scale-free network</span> Network whose degree distribution follows a power law

A scale-free network is a network whose degree distribution follows a power law, at least asymptotically. That is, the fraction P(k) of nodes in the network having k connections to other nodes goes for large values of k as

<span class="mw-page-title-main">Small-world network</span> Graph where most nodes are reachable in a small number of steps

A small-world network is a graph characterized by a high clustering coefficient and low distances. On an example of social network, high clustering implies the high probability that two friends of one person are friends themselves. The low distances, on the other hand, mean that there is a short chain of social connections between any two people. Specifically, a small-world network is defined to be a network where the typical distance L between two randomly chosen nodes grows proportionally to the logarithm of the number of nodes N in the network, that is:

<span class="mw-page-title-main">Centrality</span> Degree of connectedness within a graph

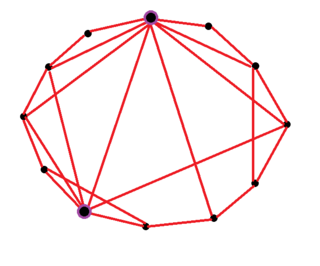
In graph theory and network analysis, indicators of centrality assign numbers or rankings to nodes within a graph corresponding to their network position. Applications include identifying the most influential person(s) in a social network, key infrastructure nodes in the Internet or urban networks, super-spreaders of disease, and brain networks. Centrality concepts were first developed in social network analysis, and many of the terms used to measure centrality reflect their sociological origin.

<span class="mw-page-title-main">Degree distribution</span>

In the study of graphs and networks, the degree of a node in a network is the number of connections it has to other nodes and the degree distribution is the probability distribution of these degrees over the whole network.

<span class="mw-page-title-main">Barabási–Albert model</span> Scale-free network generation algorithm

The Barabási–Albert (BA) model is an algorithm for generating random scale-free networks using a preferential attachment mechanism. Several natural and human-made systems, including the Internet, the World Wide Web, citation networks, and some social networks are thought to be approximately scale-free and certainly contain few nodes with unusually high degree as compared to the other nodes of the network. The BA model tries to explain the existence of such nodes in real networks. The algorithm is named for its inventors Albert-László Barabási and Réka Albert.

<span class="mw-page-title-main">Community structure</span> Concept in graph theory

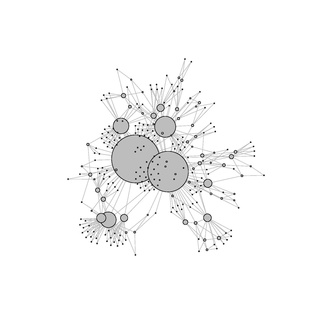
In the study of complex networks, a network is said to have community structure if the nodes of the network can be easily grouped into sets of nodes such that each set of nodes is densely connected internally. In the particular case of non-overlapping community finding, this implies that the network divides naturally into groups of nodes with dense connections internally and sparser connections between groups. But overlapping communities are also allowed. The more general definition is based on the principle that pairs of nodes are more likely to be connected if they are both members of the same community(ies), and less likely to be connected if they do not share communities. A related but different problem is community search, where the goal is to find a community that a certain vertex belongs to.

<span class="mw-page-title-main">Watts–Strogatz model</span> Method of generating random small-world graphs

The Watts–Strogatz model is a random graph generation model that produces graphs with small-world properties, including short average path lengths and high clustering. It was proposed by Duncan J. Watts and Steven Strogatz in their article published in 1998 in the Nature scientific journal. The model also became known as the (Watts) beta model after Watts used to formulate it in his popular science book Six Degrees.

In applied probability theory, the Simon model is a class of stochastic models that results in a power-law distribution function. It was proposed by Herbert A. Simon to account for the wide range of empirical distributions following a power-law. It models the dynamics of a system of elements with associated counters. In this model the dynamics of the system is based on constant growth via addition of new elements as well as incrementing the counters at a rate proportional to their current values.

<span class="mw-page-title-main">Assortativity</span> Tendency for similar nodes to be connected

Assortativity, or assortative mixing, is a preference for a network's nodes to attach to others that are similar in some way. Though the specific measure of similarity may vary, network theorists often examine assortativity in terms of a node's degree. The addition of this characteristic to network models more closely approximates the behaviors of many real world networks.

<span class="mw-page-title-main">Boolean network</span> Discrete set of boolean variables

A Boolean network consists of a discrete set of boolean variables each of which has a Boolean function assigned to it which takes inputs from a subset of those variables and output that determines the state of the variable it is assigned to. This set of functions in effect determines a topology (connectivity) on the set of variables, which then become nodes in a network. Usually, the dynamics of the system is taken as a discrete time series where the state of the entire network at time t+1 is determined by evaluating each variable's function on the state of the network at time t. This may be done synchronously or asynchronously.

<span class="mw-page-title-main">Network science</span> Academic field

Network science is an academic field which studies complex networks such as telecommunication networks, computer networks, biological networks, cognitive and semantic networks, and social networks, considering distinct elements or actors represented by nodes and the connections between the elements or actors as links. The field draws on theories and methods including graph theory from mathematics, statistical mechanics from physics, data mining and information visualization from computer science, inferential modeling from statistics, and social structure from sociology. The United States National Research Council defines network science as "the study of network representations of physical, biological, and social phenomena leading to predictive models of these phenomena."

<span class="mw-page-title-main">Modularity (networks)</span> Measure of network community structure

Modularity is a measure of the structure of networks or graphs which measures the strength of division of a network into modules. Networks with high modularity have dense connections between the nodes within modules but sparse connections between nodes in different modules. Modularity is often used in optimization methods for detecting community structure in networks. Biological networks, including animal brains, exhibit a high degree of modularity. However, modularity maximization is not statistically consistent, and finds communities in its own null model, i.e. fully random graphs, and therefore it cannot be used to find statistically significant community structures in empirical networks. Furthermore, it has been shown that modularity suffers a resolution limit and, therefore, it is unable to detect small communities.

<span class="mw-page-title-main">Hierarchical network model</span>

Hierarchical network models are iterative algorithms for creating networks which are able to reproduce the unique properties of the scale-free topology and the high clustering of the nodes at the same time. These characteristics are widely observed in nature, from biology to language to some social networks.

<span class="mw-page-title-main">Multidimensional network</span> Networks with multiple kinds of relations

In network theory, multidimensional networks, a special type of multilayer network, are networks with multiple kinds of relations. Increasingly sophisticated attempts to model real-world systems as multidimensional networks have yielded valuable insight in the fields of social network analysis, economics, urban and international transport, ecology, psychology, medicine, biology, commerce, climatology, physics, computational neuroscience, operations management, and finance.

<span class="mw-page-title-main">Global cascades model</span>

Global cascades models are a class of models aiming to model large and rare cascades that are triggered by exogenous perturbations which are relatively small compared with the size of the system. The phenomenon occurs ubiquitously in various systems, like information cascades in social systems, stock market crashes in economic systems, and cascading failure in physics infrastructure networks. The models capture some essential properties of such phenomenon.

<span class="mw-page-title-main">Biased random walk on a graph</span> Structural analysis of a network

In network science, a biased random walk on a graph is a time path process in which an evolving variable jumps from its current state to one of various potential new states; unlike in a pure random walk, the probabilities of the potential new states are unequal.

<span class="mw-page-title-main">Hub (network science)</span> Node with a number of links that greatly exceeds the average

In network science, a hub is a node with a number of links that greatly exceeds the average. Emergence of hubs is a consequence of a scale-free property of networks. While hubs cannot be observed in a random network, they are expected to emerge in scale-free networks. The uprise of hubs in scale-free networks is associated with power-law distribution. Hubs have a significant impact on the network topology. Hubs can be found in many real networks, such as the brain or the Internet.

<span class="mw-page-title-main">Mediation-driven attachment model</span> Mathematics concept

In the scale-free network theory, a mediation-driven attachment (MDA) model appears to embody a preferential attachment rule tacitly rather than explicitly. According to MDA rule, a new node first picks a node from the existing network at random and connect itself not with that but with one of the neighbors also picked at random.

<span class="mw-page-title-main">Configuration model</span>

In network science, the configuration model is a method for generating random networks from a given degree sequence. It is widely used as a reference model for real-life social networks, because it allows the modeler to incorporate arbitrary degree distributions.

In network science, the network entropy is a disorder measure derived from information theory to describe the level of randomness and the amount of information encoded in a graph. It is a relevant metric to quantitatively characterize real complex networks and can also be used to quantify network complexity

References

  1. Borgatti, Steve; Everett, Martin (2006). "A graph-theoretic perspective on centrality". Social Networks. 28 (4): 466–484. doi:10.1016/j.socnet.2005.11.005.
  2. 1 2 da Silva, Renato; Viana, Matheus; da F. Costa, Luciano (2012). "Predicting epidemic outbreak from individual features of the spreaders". J. Stat. Mech.: Theory Exp. 2012 (7): P07005. arXiv: 1202.0024 . Bibcode:2012JSMTE..07..005A. doi:10.1088/1742-5468/2012/07/p07005. S2CID   2530998.
  3. 1 2 3 4 5 Lawyer, Glenn (2015). "Understanding the spreading power of all nodes in a network: a continuous-time perspective". Sci Rep. 5: 8665. arXiv: 1405.6707 . Bibcode:2015NatSR...5E8665L. doi:10.1038/srep08665. PMC   4345333 . PMID   25727453.
  4. 1 2 Bauer, Frank; Lizier, Joseph (2012). "Identifying influential spreaders and efficiently estimating infection numbers in epidemic models: A walk counting approach". Europhys Lett. 99 (6): 68007. arXiv: 1203.0502 . Bibcode:2012EL.....9968007B. doi:10.1209/0295-5075/99/68007. S2CID   9728486.
  5. Sikic, Mile; Lancic, Alen; Antulov-Fantulin, Nino; Stefanic, Hrvoje (2013). "Epidemic centrality -- is there an underestimated epidemic impact of network peripheral nodes?". The European Physical Journal B. 86 (10): 1–13. arXiv: 1110.2558 . Bibcode:2013EPJB...86..440S. doi:10.1140/epjb/e2013-31025-5. S2CID   12052238.
  6. 1 2 3 Travencolo, B. a. N.; da F. Costa, Luciano (2008). "Accessibility in complex networks". Phys Lett A. 373 (1): 89–95. Bibcode:2008PhLA..373...89T. doi:10.1016/j.physleta.2008.10.069.
  7. 1 2 3 Viana, Matheus; Batista, Joao; da F. Costa, Luciano (2012). "Effective number of accessed nodes in complex networks". Phys Rev E. 85 (3 pt 2): 036105. arXiv: 1101.5379 . Bibcode:2012PhRvE..85c6105V. doi:10.1103/PhysRevE.85.036105. PMID   22587147. S2CID   643417.
  8. Lawyer, Glenn (2014). "Technical Report: Performance of the Expected Force on AS-level Internet topologies". arXiv: 1406.4785 [cs.NI].
  9. Lawyer, Glenn (2016). "Measuring the potential of individual airports for pandemic spread over the world airline network". BMC Infectious Diseases. 16: 70. doi: 10.1186/s12879-016-1350-4 . PMC   4746766 . PMID   26861206.
  10. Milkau, Udo; Bott, Jürgen (2015). "Digitalisation in payments: From interoperability to centralised models?". Journal of Payments Strategy & Systems. 9 (3).
  11. Jordan, Lyndon; Maguire, Sean; Hofmann, Hans; Kohda, Masanori (2016). "The social and ecological costs of an 'over-extended' phenotype". Proceedings of the Royal Society B. 283 (1822): 20152359. doi:10.1098/rspb.2015.2359. PMC   4721094 . PMID   26740619.
  12. Pereira, Vanessa; Gama, Maria; Sousa, Filipe; Lewis, Theodore; Gobatto, Claudio; Manchado-Gobatto, Fúlvia (2015). "Complex network models reveal correlations among network metrics, exercise intensity and role of body changes in the fatigue process". Scientific Reports. 5: 10489. Bibcode:2015NatSR...510489P. doi:10.1038/srep10489. PMC   4440209 . PMID   25994386.
  13. Ellinas, Christos; Allan, Neil; Durugbo, Christopher; Johansson, Anders (2015). "How Robust Is Your Project? From Local Failures to Global Catastrophes: A Complex Networks Approach to Project Systemic Risk". PLOS ONE. 10 (11): e0142469. Bibcode:2015PLoSO..1042469E. doi: 10.1371/journal.pone.0142469 . PMC   4659599 . PMID   26606518.
  14. Klemm, Konstantin; Serrano, M Angeles; Eguiluz, Victor; Miguel, Maxi San (2012). "A measure of individual role in collective dynamics". Sci Rep. 2: 292. arXiv: 1002.4042 . Bibcode:2012NatSR...2E.292K. doi:10.1038/srep00292. PMC   3289910 . PMID   22379597.