Related Research Articles
In software engineering, profiling is a form of dynamic program analysis that measures, for example, the space (memory) or time complexity of a program, the usage of particular instructions, or the frequency and duration of function calls. Most commonly, profiling information serves to aid program optimization, and more specifically, performance engineering.
Varnish is a reverse caching proxy used as HTTP accelerator for content-heavy dynamic web sites as well as APIs. In contrast to other web accelerators, such as Squid, which began life as a client-side cache, or Apache and nginx, which are primarily origin servers, Varnish was designed as an HTTP accelerator. Varnish is focused exclusively on HTTP, unlike other proxy servers that often support FTP, SMTP, and other network protocols.
Tracing in software engineering refers to the process of capturing and recording information about the execution of a software program. This information is typically used by programmers for debugging purposes, and additionally, depending on the type and detail of information contained in a trace log, by experienced system administrators or technical-support personnel and by software monitoring tools to diagnose common problems with software. Tracing is a cross-cutting concern.

FusionReactor is a developer and DevOps focused Java application performance monitor (APM), developed by Intergral GmbH for monitoring Java application servers such as Tomcat, WildFly. WebSphere, GlassFish and in particular Adobe ColdFusion and Lucee. FusionReactor provides low level metrics, telemetry and "insight". Since its initial release in November 2005, FusionReactor has been used by organizations to monitor their production environments.
DevOps is a methodology in the software development and IT industry. Used as a set of practices and tools, DevOps integrates and automates the work of software development (Dev) and IT operations (Ops) as a means for improving and shortening the systems development life cycle. DevOps is complementary to agile software development; several DevOps aspects came from the agile way of working.
Canigó is the name chosen for the Java EE framework of the Generalitat de Catalunya.
Middleware is a type of computer software program that provides services to software applications beyond those available from the operating system. It can be described as "software glue".
Software analytics is the analytics specific to the domain of software systems taking into account source code, static and dynamic characteristics as well as related processes of their development and evolution. It aims at describing, monitoring, predicting, and improving the efficiency and effectiveness of software engineering throughout the software lifecycle, in particular during software development and software maintenance. The data collection is typically done by mining software repositories, but can also be achieved by collecting user actions or production data.
Software diagnosis refers to concepts, techniques, and tools that allow for obtaining findings, conclusions, and evaluations about software systems and their implementation, composition, behaviour, and evolution. It serves as means to monitor, steer, observe and optimize software development, software maintenance, and software re-engineering in the sense of a business intelligence approach specific to software systems. It is generally based on the automatic extraction, analysis, and visualization of corresponding information sources of the software system. It can also be manually done and not automatic.
In software engineering, a microservice architecture is a variant of the service-oriented architecture structural style. It is an architectural pattern that arranges an application as a collection of loosely coupled, fine-grained services, communicating through lightweight protocols. One of its goals is that teams can develop and deploy their services independently of others. This is achieved by the reduction of several dependencies in the code base, allowing developers to evolve their services with limited restrictions from users, and for additional complexity to be hidden from users. As a consequence, organizations are able to develop software with fast growth and size, as well as use off-the-shelf services more easily. Communication requirements are reduced. These benefits come at a cost to maintaining the decoupling. So, you should use microservice architecture only if your application is too complex to manage as a monolith. Interfaces need to be designed carefully and treated as a public API. One technique that is used is having multiple interfaces on the same service, or multiple versions of the same service, so as to not disrupt existing users of the code.

Dynatrace, Inc. is a global technology company that provides a software observability platform based on artificial intelligence (AI) and automation. Dynatrace technologies are used to monitor, analyze, and optimize application performance, software development and security practices, IT infrastructure, and user experience for businesses and government agencies throughout the world.
"X as a service" is a phrasal template for any business model in which a product use is offered as a subscription-based service rather than as an artifact owned and maintained by the customer. Originating from the software as a service concept that appeared in the 2010s with the advent of cloud computing, the template has expanded to numerous offerings in the field of information technology and beyond it. The term XaaS can mean "anything as a service".

SNAMP is an open-source, cross-platform software platform for telemetry, tracing and elasticity management of distributed applications.
Site reliability engineering (SRE) is a set of principles and practices that applies aspects of software engineering to IT infrastructure and operations. SRE claims to create highly reliable and scalable software systems. Although they are closely related, SRE is slightly different from DevOps.
Serverless computing is a cloud computing execution model in which the cloud provider allocates machine resources on demand, taking care of the servers on behalf of their customers. "Serverless" is a misnomer in the sense that servers are still used by cloud service providers to execute code for developers. However, developers of serverless applications are not concerned with capacity planning, configuration, management, maintenance, fault tolerance, or scaling of containers, VMs, or physical servers. When an app is not in use, there are no computing resources allocated to the app. Pricing is based on the actual amount of resources consumed by an application. It can be a form of utility computing.
Mezmo is a technology company located in Silicon Valley, California. They provide a data pipeline intended to ingest telemetry data from multiple sources, transform it, enrich it, and route it to a variety of destinations.
Prometheus is a free software application used for event monitoring and alerting. It records metrics in a time series database built using an HTTP pull model, with flexible queries and real-time alerting. The project is written in Go and licensed under the Apache 2 License, with source code available on GitHub, and is a graduated project of the Cloud Native Computing Foundation, along with Kubernetes and Envoy.
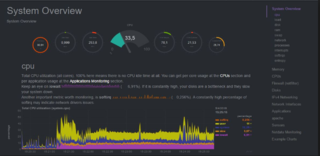
With Netdata Users can monitor their servers, containers, and applications,in high-resolution and in real-time. Netdata is an open source tool designed to collect real-time metrics, such as CPU usage, disk activity, bandwidth usage, website visits, etc., and then display them in low-latency dashboards. The tool is designed to visualize activity in the greatest possible detail, allowing the user to obtain an overview of what is happening and what has just happened in their system or application.
The Cloud Native Computing Foundation (CNCF) is a Linux Foundation project that was started in 2015 to help advance container technology and align the tech industry around its evolution.
Honeycomb is an American software company known for its eponymous observability and application performance management (APM) platform and for its diversity, equity, and inclusion (DEI) practices. Honeycomb's venture capital investors to date include Headline, Scale Venture Partners, and Insight Partners.
References
- ↑ Fellows, Geoff (1998). "High-Performance Client/Server: A Guide to Building and Managing Robust Distributed Systems". Internet Research. 8 (5). doi:10.1108/intr.1998.17208eaf.007. ISSN 1066-2243.
- ↑ Cantrill, Bryan (2006). "Hidden in Plain Sight: Improvements in the observability of software can help you diagnose your most crippling performance problems". Queue. 4 (1): 26–36. doi: 10.1145/1117389.1117401 . ISSN 1542-7730. S2CID 14505819.
- 1 2 3 4 5 6 7 8 9 Majors, Charity; Fong-Jones, Liz; Miranda, George (2022). Observability engineering : achieving production excellence (1st ed.). Sebastopol, CA: O'Reilly Media, Inc. ISBN 9781492076445. OCLC 1315555871.
- ↑ "What is observability". IBM. 15 October 2021. Retrieved 9 March 2023.
- ↑ "How to Begin Observability at the Data Source". Cisco. 26 October 2023. Retrieved 26 October 2023.
- 1 2 Livens, Jay (October 2021). "What is observability?". Dynatrace. Retrieved 9 March 2023.
- 1 2 3 "DevOps measurement: Monitoring and observability". Google Cloud. Retrieved 9 March 2023.
- ↑ Reinholds, Amy (30 November 2021). "What is observability?". New Relic. Retrieved 9 March 2023.
- ↑ "How Are Structured Logs Different from Events?". 26 June 2018.
- ↑ Hadfield, Ally (29 June 2022). "Observability vs. Monitoring: What's The Difference in DevOps?". Instana. Retrieved 15 March 2023.
- ↑ Kidd, Chrissy. "Monitoring, Observability & Telemetry: Everything You Need To Know for Observable Work" . Retrieved 15 March 2023.
- ↑ "What is Observability? A Beginner's Guide". Splunk. Retrieved 9 March 2023.
- 1 2 Sridharan, Cindy (2018). "Chapter 4. The Three Pillars of Observability". Distributed systems observability : a guide to building robust systems (1st ed.). Sebastopol, CA: O'Reilly Media, Inc. ISBN 978-1-4920-3342-4. OCLC 1044741317.
- ↑ "Trace Context". W3C. 2021-11-23. Retrieved 2023-09-27.
- ↑ "b3-propagation". openzipkin. Retrieved 2023-09-27.
- ↑ "What is continuous profiling?". Cloud Native Computing Foundation. 31 May 2022. Retrieved 9 March 2023.
| | This computer science article is a stub. You can help Wikipedia by expanding it. |