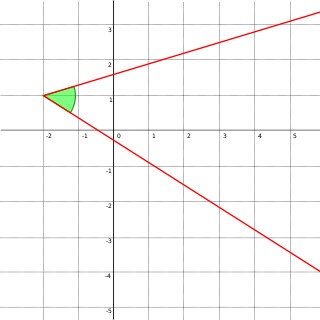
In Euclidean geometry, an angle is the figure formed by two rays, called the sides of the angle, sharing a common endpoint, called the vertex of the angle. Angles formed by two rays are also known as plane angles as they lie in the plane that contains the rays. Angles are also formed by the intersection of two planes; these are called dihedral angles. Two intersecting curves may also define an angle, which is the angle of the rays lying tangent to the respective curves at their point of intersection.

In analytic geometry, an asymptote of a curve is a line such that the distance between the curve and the line approaches zero as one or both of the x or y coordinates tends to infinity. In projective geometry and related contexts, an asymptote of a curve is a line which is tangent to the curve at a point at infinity.

In probability theory and statistics, the cumulative distribution function (CDF) of a real-valued random variable , or just distribution function of , evaluated at , is the probability that will take a value less than or equal to .
A histogram is a visual representation of the distribution of quantitative data. The term was first introduced by Karl Pearson. To construct a histogram, the first step is to "bin" the range of values— divide the entire range of values into a series of intervals—and then count how many values fall into each interval. The bins are usually specified as consecutive, non-overlapping intervals of a variable. The bins (intervals) are adjacent and are typically of equal size.
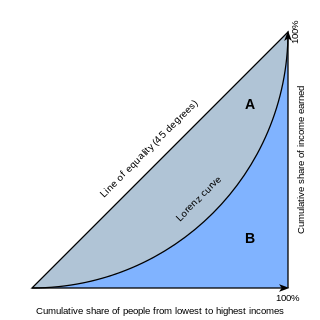
In economics, the Lorenz curve is a graphical representation of the distribution of income or of wealth. It was developed by Max O. Lorenz in 1905 for representing inequality of the wealth distribution.

In statistics and probability theory, the median is the value separating the higher half from the lower half of a data sample, a population, or a probability distribution. For a data set, it may be thought of as "the middle" value. The basic feature of the median in describing data compared to the mean is that it is not skewed by a small proportion of extremely large or small values, and therefore provides a better representation of the center. Median income, for example, may be a better way to describe the center of the income distribution because increases in the largest incomes alone have no effect on the median. For this reason, the median is of central importance in robust statistics.

In probability theory and statistics, a probability distribution is the mathematical function that gives the probabilities of occurrence of different possible outcomes for an experiment. It is a mathematical description of a random phenomenon in terms of its sample space and the probabilities of events.

In statistics, a power law is a functional relationship between two quantities, where a relative change in one quantity results in a relative change in the other quantity proportional to a power of the change, independent of the initial size of those quantities: one quantity varies as a power of another. For instance, considering the area of a square in terms of the length of its side, if the length is doubled, the area is multiplied by a factor of four. The rate of change exhibited in these relationships is said to be multiplicative.
In statistics, quartiles are a type of quantiles which divide the number of data points into four parts, or quarters, of more-or-less equal size. The data must be ordered from smallest to largest to compute quartiles; as such, quartiles are a form of order statistic. The three quartiles, resulting in four data divisions, are as follows:

In mathematics, the slope or gradient of a line is a number that describes both the direction and the steepness of the line. Slope is often denoted by the letter m; there is no clear answer to the question why the letter m is used for slope, but its earliest use in English appears in O'Brien (1844) who wrote the equation of a straight line as "y = mx + b" and it can also be found in Todhunter (1888) who wrote it as "y = mx + c".

In mathematics, the complex plane is the plane formed by the complex numbers, with a Cartesian coordinate system such that the horizontal x-axis, called the real axis, is formed by the real numbers, and the vertical y-axis, called the imaginary axis, is formed by the imaginary numbers.
In mathematics, a degenerate case is a limiting case of a class of objects which appears to be qualitatively different from the rest of the class; "degeneracy" is the condition of being a degenerate case.

In computational geometry, the point-in-polygon (PIP) problem asks whether a given point in the plane lies inside, outside, or on the boundary of a polygon. It is a special case of point location problems and finds applications in areas that deal with processing geometrical data, such as computer graphics, computer vision, geographic information systems (GIS), motion planning, and computer-aided design (CAD).
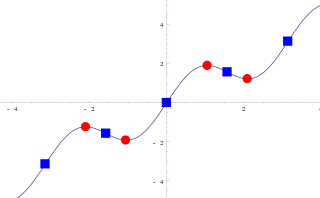
In mathematics, particularly in calculus, a stationary point of a differentiable function of one variable is a point on the graph of the function where the function's derivative is zero. Informally, it is a point where the function "stops" increasing or decreasing.

In geometry, the orientation, attitude, bearing, direction, or angular position of an object – such as a line, plane or rigid body – is part of the description of how it is placed in the space it occupies. More specifically, it refers to the imaginary rotation that is needed to move the object from a reference placement to its current placement. A rotation may not be enough to reach the current placement, in which case it may be necessary to add an imaginary translation to change the object's position. The position and orientation together fully describe how the object is placed in space. The above-mentioned imaginary rotation and translation may be thought to occur in any order, as the orientation of an object does not change when it translates, and its position does not change when it rotates.

In statistics, a Q–Q plot (quantile–quantile plot) is a probability plot, a graphical method for comparing two probability distributions by plotting their quantiles against each other. A point (x, y) on the plot corresponds to one of the quantiles of the second distribution (y-coordinate) plotted against the same quantile of the first distribution (x-coordinate). This defines a parametric curve where the parameter is the index of the quantile interval.
In statistics, the frequency or absolute frequency of an event is the number of times the observation has occurred/recorded in an experiment or study. These frequencies are often depicted graphically or in tabular form.
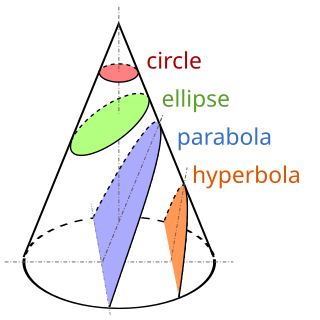
A conic section, conic or a quadratic curve is a curve obtained from a cone's surface intersecting a plane. The three types of conic section are the hyperbola, the parabola, and the ellipse; the circle is a special case of the ellipse, though it was sometimes called as a fourth type. The ancient Greek mathematicians studied conic sections, culminating around 200 BC with Apollonius of Perga's systematic work on their properties.
The survival function is a function that gives the probability that a patient, device, or other object of interest will survive past a certain time. The survival function is also known as the survivor function or reliability function. The term reliability function is common in engineering while the term survival function is used in a broader range of applications, including human mortality. The survival function is the complementary cumulative distribution function of the lifetime. Sometimes complementary cumulative distribution functions are called survival functions in general.
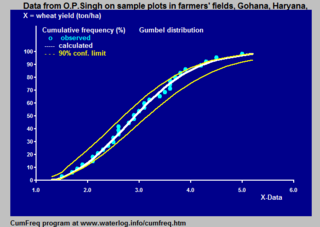
Cumulative frequency analysis is the analysis of the frequency of occurrence of values of a phenomenon less than a reference value. The phenomenon may be time- or space-dependent. Cumulative frequency is also called frequency of non-exceedance.
