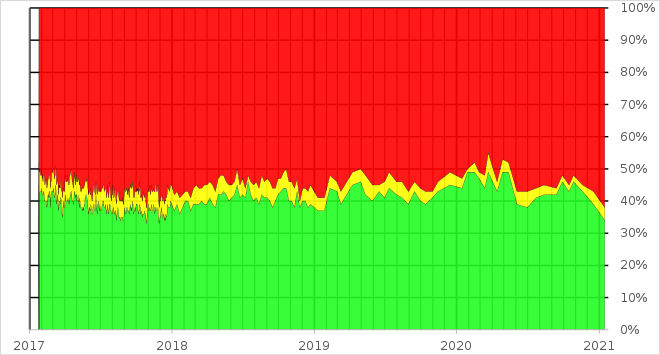
Opinion polling on the Donald Trump administration

Last updated

This article summarizes the results of polls taken during the presidency of Donald Trump which gather and analyze public opinion on his administration's performance and policies.

Contents

Graphical summary

Gallup approval polling
.mw-parser-output .legend{page-break-inside:avoid;break-inside:avoid-column}.mw-parser-output .legend-color{display:inline-block;min-width:1.25em;height:1.25em;line-height:1.25;margin:1px 0;text-align:center;border:1px solid black;background-color:transparent;color:black}.mw-parser-output .legend-text{}
Disapprove
Unsure
Approve Gallup Poll-Approval Rating-Donald Trump.svg
Gallup approval polling
  Disapprove
  Unsure
  Approve

Job approval ratings

Aggregate polls

Poll numbers verified as of January 15,2021

AggregatorSegment polledApproveDisapprove
FiveThirtyEight [1] All polls38.1%58.0%
Likely/registered voters39.7%56.5%
All adults36.7%59.4%
RealClearPolitics [2] All polls39.7%57.7%

2020

2019

2018

2017

Comparative favorability ratings

vs Barack Obama

Area polledSegment polledPolling groupDateDonald Trump favorableBarack Obama favorableSample sizePolling methodSource
Flag of Georgia (U.S. state).svg Georgia Likely Voters AtlasIntel December 25, 2020–January 1, 202147%52%1,680telephone and online [3]
Flag of the United States.svg United States Registered voters NBC News/ Wall Street Journal August 9–12, 202040%54%900telephone [4]
Flag of Wisconsin.svg Wisconsin Registered voters Marquette University Law School June 14–18, 202042%61%805telephone [5]
Flag of the United States.svg United States Registered voters NBC News/ Wall Street Journal May 28 – June 2, 202040%57%1,000telephone [6]
Flag of the United States.svg United States Registered voters Fox News May 17–20, 202043%63%1,207telephone [7]
Flag of the United States.svg United States Registered voters Monmouth University April 30 – May 4, 202040%57%739telephone [8]
Flag of Wisconsin.svg Wisconsin Registered voters Marquette University Law School November 13–17, 201946%54%801telephone [9]
Flag of the United States.svg United States All adults Grinnell College October 17–23, 201942%61%1,003telephone [10]
Flag of the United States.svg United States Registered voters NBC News/ Wall Street Journal September 13–16, 201941%54%900telephone [11]
Flag of the United States.svg United States Registered voters Fox News August 11–13, 201942%60%1,013telephone [12]
Flag of the United States.svg United States Registered voters NBC News/ Wall Street Journal September 16–19, 201839%54%900telephone [13]
Flag of New York.svg New York Registered voters Siena College Research Institute February 5–8, 201833%67%823telephone [14]
Flag of the United States.svg United States All adults CNN January 14–18, 201840%66%1,005telephone [15]
Flag of the United States.svg United States All adults NBC News/ Wall Street Journal January 13–17, 201836%57%900telephone [16]
Flag of Michigan.svg Michigan All adults NBC News/Marist August 13–17, 201734%64%907telephone [17]
Flag of the United States.svg United States All adults NBC News/ Wall Street Journal August 5–9, 201736%51%1,200telephone [18]
Flag of the United States.svg United States All adults Bloomberg News July 8–12, 201741%61%1,001telephone [19]
Flag of the United States.svg United States All adults NBC News/ Wall Street Journal April 17–20, 201739%52%900telephone [20]
Flag of the United States.svg United States All adults Ipsos (for Reuters )April 13–17, 201747%62%1,843online [21]
Flag of the United States.svg United States All adults Ipsos (for Reuters )March 24–28, 201751%64%1,646online [22]
Flag of the United States.svg United States All adults Pew Research Center February 28 – March 12, 201743%60%3,844telephone and online [23]
Flag of the United States.svg United States All adults YouGov (for The Economist )January 23–25, 201745%54%2,692online [24]

  Trump more favorable  Obama more favorable

vs Chuck Schumer

Area polledSegment polledPolling groupDateDonald Trump favorableChuck Schumer favorableSample sizePolling methodSource(s)
Flag of the United States.svg United States All adults Gallup February 17–28, 202046%31%1,020telephone [25]
Flag of New York.svg New York Registered voters Siena College Research Institute January 11–16, 202031%54%814telephone [26]
Flag of New York.svg New York Registered voters Siena College Research Institute September 8–12, 201932%48%798telephone [27]
Flag of New York.svg New York Registered voters Siena College Research Institute July 28 – August 1, 201935%53%810telephone [28]
Flag of New York.svg New York Registered voters Siena College Research Institute June 2–6, 201934%54%812telephone [29]
Flag of New York.svg New York Registered voters Siena College Research Institute April 8–11, 201938%49%735telephone [30]
Flag of New York.svg New York Registered voters Siena College Research Institute March 10–14, 201936%51%700telephone [31]
Flag of New York.svg New York Registered voters Siena College Research Institute February 4–7, 201935%47%778telephone [32]
Flag of the United States.svg United States All adults Gallup January 21–27, 201939%33%1,022telephone [33]
Flag of the United States.svg United States Registered voters Quinnipiac University January 9–13, 201941%26%1,209telephone [34]
Flag of New York.svg New York Registered voters Siena College Research Institute January 6–10, 201932%53%805telephone [35]
Flag of the United States.svg United States All adults Gallup December 3–12, 201840%32%1,025telephone [36]
Flag of the United States.svg United States Registered voters Fox News December 9–11, 201846%28%1,006telephone [37]
Flag of the United States.svg United States Registered voters Fox News August 19–21, 201841%28%1,009telephone [38]
Flag of New York.svg New York Likely voters Siena Research Institute June 4–7, 201838%56%745telephone [39]
Flag of the United States.svg United States Registered voters Fox News April 22–24, 201843%29%1,014telephone [40]
Flag of New York.svg New York Registered voters Siena Research Institute April 8–12, 201831%53%692telephone [41]
Flag of the United States.svg United States Registered voters Quinnipiac University February 16–19, 201837%26%1,249telephone [42]
Flag of New York.svg New York Registered voters Siena Research Institute February 5–8, 201833%52%823telephone [14]
Flag of the United States.svg United States Registered voters Fox News January 21–23, 201845%31%1,002telephone [43]
Flag of New York.svg New York Registered voters Siena Research Institute January 7–11, 201832%59%824telephone [44]
Flag of the United States.svg United States Registered voters Emerson College October 12–14, 201744%33%820telephone [45]
Flag of the United States.svg United States Registered voters Morning Consult (for Politico )October 5–9, 201743%24%1,996online [46]
Flag of New York.svg New York Registered voters Siena Research Institute September 25 – October 2, 201728%58%789telephone [47] [48]
Flag of the United States.svg United States All adults CNN September 17–20, 201741%28%1,053telephone [49] [50]
Flag of the United States.svg United States All adults NBC News/ Wall Street Journal September 14–18, 201739%18%900telephone [51]
Flag of New York.svg New York Registered voters Siena Research Institute August 26–30, 201729%58%771telephone [52]
Flag of the United States.svg United States Registered voters Fox News August 27–29, 201744%27%1,006telephone [53]
Flag of the United States.svg United States Registered voters Fox News June 25–27, 201747%26%1,017telephone [54]
Flag of New York.svg New York Registered voters Siena Research Institute May 15–21, 201730%57%770telephone [55]
Flag of the United States.svg United States Registered voters Quinnipiac University May 4–9, 201735%25%1,078telephone [56]
Flag of the United States.svg United States Registered voters Quinnipiac University March 30 – April 3, 201736%25%1,171telephone [57]
Flag of New York.svg New York Registered voters Siena Research Institute March 19–23, 201733%60%791telephone [58]
Flag of the United States.svg United States All adults YouGov (for The Economist )February 25 – March 1, 201740%26%1,500online [59]
Flag of the United States.svg United States All adults YouGov (for The Economist )January 23–25, 201745%26%2,692online [24]

  Trump more favorable  Schumer more favorable

vs Mike Pence

Area polledSegment polledPolling groupDateDonald Trump favorableMike Pence favorableSample sizePolling methodSource
Flag of the United States.svg United States All adults Gallup October 16–27, 202045%43%1,018telephone [60]
Flag of the United States.svg United States Registered voters NBC News/ Wall Street Journal October 9–12, 202042%39%1,000telephone [61]
Flag of the United States.svg United States Registered voters Fox News October 3–6, 202044%47%1,107telephone [62]
Flag of the United States.svg United States All adults CNN October 1–4, 202039%38%1,205telephone [63]
Flag of the United States.svg United States Registered voters NBC News/ Wall Street Journal September 30 – October 1, 202039%36%800telephone [64]
Flag of the United States.svg United States Likely voters Siena College/ New York Times September 22–24, 202044%44%950telephone [65]
Flag of the United States.svg United States Registered voters NBC News/ Wall Street Journal September 13–16, 202041%38%1,000telephone [66]
Flag of the United States.svg United States All adults Gallup August 31 – September 13, 202041%41%1,019telephone [67]
Flag of the United States.svg United States Likely voters Fox News September 7–10, 202046%48%1,191telephone [68]
Flag of the United States.svg United States Registered voters Monmouth University September 3–8, 202040%38%758telephone [69]
Flag of Florida.svg Florida All adults NBC News/Marist August 31 – September 6, 202045%43%1,146telephone [70]
Flag of the United States.svg United States All adults CNN August 28 – September 1, 202040%41%1,106telephone [71]
Flag of the United States.svg United States Likely voters Quinnipiac University August 28–31, 202041%38%1,081telephone [72]
Flag of the United States.svg United States Registered voters Suffolk University/ USA Today August 28–31, 202043%41%1,000telephone [73]
Flag of the United States.svg United States All adults ABC News/ Washington Post August 12–15, 202042%44%1,001telephone [74]
Flag of the United States.svg United States All adults CNN August 12–15, 202043%41%1,108telephone [75]
Flag of the United States.svg United States Registered voters Fox News August 9–12, 202043%41%1,000telephone [76]
Flag of the United States.svg United States Likely voters Georgetown Institute of Politics and Public Service August 1–6, 202040%41%1,000telephone [77]
Flag of Iowa.svg Iowa All adults The Des Moines Register /Mediacom June 7–10, 202045%44%801telephone [78]
Flag of the United States.svg United States Registered voters Fox News May 17–20, 202043%42%1,207telephone [7]
Flag of the United States.svg United States Registered voters Suffolk University/ USA Today April 21–25, 202039%40%1,000telephone [79]
Flag of the United States.svg United States All adults CNN March 4–7, 202043%37%1,211telephone [80] [81]
Flag of the United States.svg United States All adults Gallup February 17–28, 202046%41%1,020telephone [25]
Flag of the United States.svg United States All adults Associated Press/NORC at the University of Chicago February 13–16, 202043%41%1,074telephone and online [82]
Flag of the United States.svg United States Registered voters Suffolk University/ USA Today December 10–14, 201944%42%1,000telephone [83]
Flag of the United States.svg United States All adults Gallup October 14–31, 201941%39%1,506telephone [84]
Flag of the United States.svg United States Registered voters Suffolk University/ USA Today October 23–26, 201944%40%1,000telephone [85]
Flag of the United States.svg United States All adults Grinnell College October 17–23, 201942%44%1,003telephone [10]
Flag of the United States.svg United States All adults CNN October 17–20, 201942%38%1,003telephone [86]
Flag of the United States.svg United States Registered voters Fox News October 6–8, 201943%40%1,003telephone [87]
Flag of the United States.svg United States Registered voters Fox News August 11–13, 201942%39%1,013telephone [12]
Flag of the United States.svg United States Registered voters Suffolk University/ USA Today March 13–17, 201942%41%1,000telephone [88]
Flag of the United States.svg United States All adults Gallup February 12–28, 201944%42%1,932telephone [89]
Flag of the United States.svg United States Registered voters Fox News February 10–12, 201943%42%1,004telephone [90]
Flag of the United States.svg United States All adults CNN January 30 – February 2, 201942%39%1,011telephone [91]
Flag of the United States.svg United States Registered voters Suffolk University/ USA Today December 11–16, 201840%39%1,000telephone [92]
Flag of the United States.svg United States All adults Gallup September 4–12, 201841%43%1,035telephone [93]
Flag of the United States.svg United States Registered voters Suffolk University/ USA Today August 23–28, 201840%36%1,000telephone [94]
Flag of the United States.svg United States Registered voters Suffolk University/ USA Today June 13–18, 201840%42%1,000telephone [95]
Flag of New Hampshire.svg New Hampshire Likely voters Suffolk University April 26–30, 201842%43%800telephone [96]
Flag of the United States.svg United States All adults YouGov (for The Economist )April 22–24, 201839%39%1,500online [97]
Flag of the United States.svg United States Registered voters Suffolk University/ USA Today February 20–24, 201834%36%1,000telephone [98]
Flag of the United States.svg United States Registered voters Quinnipiac University February 16–19, 201837%36%1,249telephone [42]
Flag of the United States.svg United States All adults CNN January 14–18, 201840%40%1,005telephone [15]
Flag of the United States.svg United States All adults NBC News/ Wall Street Journal January 13–17, 201836%33%900telephone [16]
Flag of the United States.svg United States Registered voters Suffolk University/ USA Today December 5–9, 201734%33%1,000telephone [99]
Flag of the United States.svg United States All adults CNN November 2–5, 201738%38%1,021telephone [100]
Flag of the United States.svg United States Registered voters Morning Consult (for Politico )October 5–9, 201743%44%1,996online [46]
Flag of the United States.svg United States Registered voters Suffolk University/ USA Today September 27 – October 1, 201734%36%1,000telephone [101]
Flag of the United States.svg United States Registered voters Fox News August 27–29, 201744%46%1,006telephone [53]
Flag of the United States.svg United States Registered voters GW Battleground August 13–17, 201742%43%1,000telephone [102]
Flag of the United States.svg United States All adults Bloomberg News July 8–12, 201741%44%1,001telephone [19]
Flag of the United States.svg United States Registered voters Fox News June 25–27, 201747%47%1,017telephone [54]
Flag of the United States.svg United States Registered voters Suffolk University/ USA Today June 24–27, 201740%41%1,000telephone [103]
Flag of the United States.svg United States All adults CNN/ORC April 22–25, 201745%46%1,009telephone [104]
Flag of the United States.svg United States All adults NBC News/ Wall Street Journal April 17–20, 201739%38%900telephone [20]
Flag of the United States.svg United States Registered voters Fox News March 12–14, 201744%47%1,008telephone [105]
Flag of the United States.svg United States All adults Pew Research Center February 28 – March 12, 201743%45%3,844telephone and online [23]
Flag of the United States.svg United States Registered voters Quinnipiac University March 2–6, 201743%40%1,283telephone [106]
Flag of the United States.svg United States Registered voters Suffolk University/ USA Today March 1–5, 201745%47%1,000telephone [107]
Flag of the United States.svg United States All adults CNN/ORC March 1–4, 201745%47%1,025telephone [108]
Flag of the United States.svg United States All adults YouGov (for The Economist)February 25 – March 1, 201740%42%1,500online [59]
Flag of the United States.svg United States All adults NBC News/ Wall Street Journal February 18–22, 201743%42%1,000telephone [109]
Flag of the United States.svg United States All adults McClatchy/Marist College February 15–19, 201738%43%1,073telephone [110]
Flag of the United States.svg United States All adults YouGov (for The Economist )January 23–25, 201745%44%2,692online [24]

  Trump more favorable  Pence more favorable

vs Nancy Pelosi

Area polledSegment polledPolling groupDateDonald Trump favorableNancy Pelosi favorableSample sizePolling methodSource(s)
Flag of the United States.svg United States Registered voters Suffolk University/ USA Today August 28–31, 202043%35%1,000telephone [73]
Flag of the United States.svg United States Registered voters Suffolk University/ USA Today April 21–25, 202039%35%1,000telephone [79]
Flag of the United States.svg United States All adults Gallup February 17–28, 202046%39%1,020telephone [25]
Flag of the United States.svg United States Registered voters NBC News/ Wall Street Journal January 26–29, 202043%33%1,000telephone [111]
Flag of the United States.svg United States Registered voters Fox News January 19–22, 202045%43%1,005telephone [112]
Flag of the United States.svg United States All adults CNN December 12–15, 201943%39%1,005telephone [113] [114]
Flag of the United States.svg United States Registered voters Suffolk University/ USA Today December 10–14, 201944%36%1,000telephone [83]
Flag of the United States.svg United States All adults Gallup October 14–31, 201941%40%1,506telephone [84]
Flag of the United States.svg United States All adults NBC News/ Wall Street Journal October 27–30, 201940%31%900telephone [115]
Flag of the United States.svg United States All adults Grinnell College October 17–23, 201942%38%1,003telephone [10]
Flag of the United States.svg United States All adults CNN October 17–20, 201942%44%1,003telephone [86]
Flag of the United States.svg United States Likely voters Georgetown Institute of Politics and Public Service October 6–10, 201942%41%1,000telephone [116]
Flag of the United States.svg United States Registered voters Fox News October 6–8, 201943%42%1,003telephone [87]
Flag of New York.svg New York Registered voters Siena College Research Institute September 8–12, 201932%47%798telephone [27]
Flag of the United States.svg United States Registered voters Suffolk University/ USA Today August 20–25, 201941%31%1,000telephone [117]
Flag of the United States.svg United States Registered voters Fox News July 21–23, 201945%39%1,004telephone [118]
Flag of the United States.svg United States Registered voters Suffolk University/ USA Today June 11–15, 201946%32%1,000telephone [119]
Flag of New York.svg New York Registered voters Siena College Research Institute June 2–6, 201934%47%812telephone [120]
Flag of the United States.svg United States All adults CNN May 28–31, 201945%40%1,006telephone [121]
Flag of the United States.svg United States Likely voters Georgetown Institute of Politics and Public Service March 31 – April 4, 201940%37%1,000telephone [122]
Flag of the United States.svg United States Registered voters Suffolk University/ USA Today March 13–17, 201942%36%1,000telephone [88]
Flag of the United States.svg United States Registered voters Fox News February 10–12, 201943%36%1,004telephone [90]
Flag of the United States.svg United States All adults CNN January 30 – February 2, 201942%42%1,011telephone [91]
Flag of the United States.svg United States All adults Gallup January 21–27, 201939%38%1,022telephone [33]
Flag of the United States.svg United States All adults NBC News/ Wall Street Journal January 20–23, 201939%28%900telephone [123]
Flag of the United States.svg United States Registered voters Quinnipiac University January 9–13, 201941%35%1,209telephone [34]
Flag of the United States.svg United States All adults NBC News/ Wall Street Journal December 9–12, 201837%28%900telephone [124]
Flag of the United States.svg United States All adults Gallup December 3–12, 201840%38%1,025telephone [36]
Flag of the United States.svg United States Registered voters Fox News December 9–11, 201846%36%1,006telephone [37]
Flag of the United States.svg United States Registered voters NBC News/ Wall Street Journal October 14–17, 201842%22%900telephone [125]
Flag of the United States.svg United States Registered voters NBC News/ Wall Street Journal August 18–22, 201840%20%900telephone [126]
Flag of the United States.svg United States Registered voters Fox News August 19–21, 201841%29%1,009telephone [38]
Flag of Michigan.svg Michigan Likely voters EPIC-MRAApril 28–30, 201840%25%600telephone [127]
Flag of the United States.svg United States Registered voters Fox News April 22–24, 201843%31%1,014telephone [40]
Flag of the United States.svg United States All adults ABC News/ Washington Post April 8–11, 201832%32%1,002telephone [128]
Flag of the United States.svg United States All adults NBC News/ Wall Street Journal March 10–14, 201837%21%1,100telephone [129]
Flag of the United States.svg United States Registered voters Quinnipiac University February 16–19, 201837%29%1,249telephone [42]
Flag of the United States.svg United States Registered voters Fox News January 21–23, 201845%31%1,002telephone [43]
Flag of the United States.svg United States Registered voters Morning Consult (for Politico )October 5–9, 201743%29%1,996online [46]
Flag of the United States.svg United States All adults CNN September 17–20, 201741%29%1,053telephone [49] [50]
Flag of the United States.svg United States All adults NBC News/ Wall Street Journal September 14–18, 201739%25%900telephone [51]
Flag of the United States.svg United States Registered voters Fox News August 27–29, 201744%31%1,006telephone [53]
Flag of the United States.svg United States Registered voters Quinnipiac University May 4–9, 201735%31%1,078telephone [56]
Flag of the United States.svg United States Registered voters Quinnipiac University March 30 – April 3, 201736%30%1,171telephone [57]
Flag of the United States.svg United States Registered voters Fox News March 12–14, 201744%33%1,008telephone [105]
Flag of the United States.svg United States All adults NBC News/ Wall Street Journal February 18–22, 201743%19%500telephone [109]
Flag of the United States.svg United States Registered voters Morning Consult (for Politico)February 16–19, 201747%29%2,013online [130]
Flag of the United States.svg United States All adults YouGov (for The Economist )January 23–25, 201745%27%2,692online [24]

  Trump more favorable  Pelosi more favorable

vs Paul Ryan

Area polledSegment polledPolling groupDateDonald Trump favorablePaul Ryan favorableSample sizePolling methodSource(s)
Flag of the United States.svg United States All adults Gallup December 3–12, 201840%34%1,025telephone [36]
Flag of Wisconsin.svg Wisconsin Likely voters Marquette University Law School September 12–16, 201840%42%614telephone [131]
Flag of Wisconsin.svg Wisconsin Registered voters Marquette University Law School June 13–17, 201844%43%800telephone [132]
Flag of the United States.svg United States Registered voters Fox News April 22–24, 201843%36%1,014telephone [40]
Flag of the United States.svg United States All adults NBC News/ Wall Street Journal March 10–14, 201837%24%1,100telephone [129]
Flag of Wisconsin.svg Wisconsin Registered voters Marquette University Law School February 25 – March 1, 201844%46%800telephone [133]
Flag of the United States.svg United States Registered voters Quinnipiac University February 16–19, 201837%28%1,249telephone [42]
Flag of the United States.svg United States Registered voters Fox News January 21–23, 201845%40%1,002telephone [43]
Flag of the United States.svg United States All adults NBC News/ Wall Street Journal January 13–17, 201836%28%900telephone [16]
Flag of the United States.svg United States All adults CNN December 14–17, 201736%35%1,001telephone [134]
Flag of the United States.svg United States Registered voters Morning Consult (for Politico )October 5–9, 201743%32%1,996online [46]
Flag of the United States.svg United States All adults CNN September 17–20, 201741%32%1,053telephone [49] [50]
Flag of the United States.svg United States All adults NBC News/ Wall Street Journal September 14–18, 201739%24%900telephone [51]
Flag of the United States.svg United States Registered voters Fox News August 27–29, 201744%35%1,006telephone [53]
Flag of the United States.svg United States All adults Bloomberg News July 8–12, 201741%34%1,001telephone [19]
Flag of the United States.svg United States Registered voters Quinnipiac University May 4–9, 201735%24%1,078telephone [56]
Flag of the United States.svg United States All adults NBC News/ Wall Street Journal April 17–20, 201739%22%900telephone [20]
Flag of the United States.svg United States Registered voters Quinnipiac University March 30 – April 3, 201736%28%1,171telephone [57]
Flag of the United States.svg United States Registered voters Quinnipiac University March 16–21, 201736%27%1,056telephone [135]
Flag of the United States.svg United States Registered voters Fox News March 12–14, 201744%37%1,008telephone [105]
Flag of the United States.svg United States All adults NBC News/ Wall Street Journal February 18–22, 201743%34%500telephone [109]
Flag of the United States.svg United States Registered voters Morning Consult (for Politico)February 16–19, 201747%38%2,013online [130]
Flag of the United States.svg United States All adults YouGov (for The Economist )January 23–25, 201745%34%2,692online [24]

  Trump more favorable  Ryan more favorable

vs Vladimir Putin

Area polledSegment polledPolling groupDateDonald Trump favorableVladimir Putin favorableSample sizePolling methodSource(s)
Flag of the United States.svg United States Registered voters Fox News April 14–16, 201944%9%1,005telephone [136]
Flag of the United States.svg United States Registered voters NBC News/ Wall Street Journal July 15–18, 201840%5%450telephone [137]
Flag of the United States.svg United States All adults CNN June 14–17, 201840%11%1,012telephone [138] [139]
Flag of the United States.svg United States Registered voters Public Policy Polling October 27–29, 201738%7%572telephone and online [140]
Flag of the United States.svg United States Registered voters Emerson College October 12–14, 201744%11%820telephone [45]
Flag of the United States.svg United States Registered voters Public Policy Polling September 22–25, 201741%11%865telephone and online [141]
Flag of the United States.svg United States All adults Public Religion Research Institute August 2–8, 201738%15%2,024telephone [142]
Flag of the United States.svg United States All adults Bloomberg News July 8–12, 201741%15%1,001telephone [143]
Flag of the United States.svg United States Registered voters Public Policy Polling May 12–14, 201740%8%692telephone and online [144]
Flag of the United States.svg United States Registered voters Public Policy Polling March 27–28, 201741%9%677telephone and online [145]
Flag of the United States.svg United States All adults Pew Research Center February 28 – March 12, 201743%16%3,844telephone and online [23]
Flag of the United States.svg United States Registered voters Public Policy Polling January 23–24, 201744%10%1,043telephone and online [146]

  Trump more favorable  Putin more favorable

Issue-specific support

Appointment of Neil Gorsuch to Supreme Court

In February 2017, Donald Trump nominated Neil Gorsuch to the Supreme Court of the United States. [147] Gorsuch was confirmed on April 7, 2017, by a 54–45 vote. [148] [149]

Area polledSegment polledPolling groupDateSupportOpposeUnsureSample sizePolling methodSource
Flag of the United States.svg United States Registered voters Quinnipiac University April 12–18, 201749%36%15%1,062telephone [150]
Flag of the United States.svg United States Registered voters Quinnipiac University March 30 – April 3, 201748%35%17%1,171telephone [151]
Flag of the United States.svg United States Registered voters Quinnipiac University February 16–21, 201750%31%19%1,323telephone [152]
Flag of the United States.svg United States Registered voters Emerson College February 5–6, 201752%32%16%617telephone [153]

  majority support  plurality support  majority oppose  plurality oppose

Ban on military service by transgender people

Donald Trump signed a presidential memorandum banning transgender individuals from serving openly in the U.S. military. [154]

In the following table, the "support" column indicates the percentage of respondents who supported the ban, whereas the "oppose" column indicates the percentage of respondents who were opposed to the ban.

Area polledSegment polledPolling groupDateSupportOpposeUnsureSample sizePolling methodSource
Flag of the United States.svg United States All adults Gallup May 15–30, 201926%71%2%1,017telephone [155]
Flag of the United States.svg United States All adults Public Religion Research Institute April 9–20, 201932%63%5%1,100telephone [156]
Flag of the United States.svg United States Registered voters Quinnipiac University January 25–28, 201922%70%8%1,004telephone [157]
Flag of the United States.svg United States All adults CNN December 14–17, 201722%73%5%1,001telephone [158]
Flag of the United States.svg United States All adults Public Religion Research Institute August 2–8, 201730%64%6%2,024telephone [159]
Flag of the United States.svg United States Registered voters Quinnipiac University July 27 – August 1, 201727%68%5%1,125telephone [160]

  majority support  plurality support  majority oppose  plurality oppose

Climate change regulations repeal

Donald Trump has pledged to repeal certain U.S. government regulations intended to address climate change. [161]

Area polledSegment polledPolling groupDateSupportOpposeUnsureSample sizePolling methodSource
Flag of the United States.svg United States Registered voters Quinnipiac University May 4–9, 201728%65%7%1,078telephone [162]
Flag of the United States.svg United States Registered voters Quinnipiac University April 12–18, 201725%66%9%1,062telephone [150]
Flag of the United States.svg United States All adults CBS News April 11–15, 201738%51%---1,011telephone [163]
Flag of the United States.svg United States Registered voters Quinnipiac University March 30 – April 3, 201728%62%10%1,171telephone [151]
Flag of the United States.svg United States Registered voters Quinnipiac University March 16–21, 201729%63%8%1,056telephone [164]
Flag of the United States.svg United States Registered voters Quinnipiac University March 2–6, 201729%62%9%1,323telephone [165]
Flag of the United States.svg United States Registered voters Quinnipiac University February 16–21, 201727%63%10%1,323telephone [152]
Flag of the United States.svg United States All adults Quinnipiac University January 5–9, 201732%59%9%899telephone [161]

  majority support  plurality support  majority oppose  plurality oppose

Construction of border wall

In January 2017, Donald Trump ordered construction of a wall along portions of the Mexico–United States border. [166]

Area polledSegment polledPolling groupDateSupportOpposeUnsureSample sizePolling methodSource
Flag of the United States.svg United States All adults Associated Press/NORC at the University of Chicago July 16–20, 202035%47%1%1,057telephone [167]
Flag of Arizona.svg Arizona Registered voters Monmouth University March 11–14, 202045%50%5%847telephone [168]
Flag of California.svg California All adults Public Policy Institute of California January 3–12, 202030%68%2%1,694telephone [169]
Flag of the United States.svg United States Registered voters Fox News December 8–11, 201944%52%4%1,000telephone [170]
Flag of Wisconsin.svg Wisconsin Registered voters Fox News September 29 - October 2, 201942%52%7%1,512telephone [171]
Flag of the United States.svg United States Registered voters NBC News/ Wall Street Journal September 13–16, 201943%56%1%900telephone [11]
Flag of the United States.svg United States Registered voters Fox News June 9–12, 201942%55%2%1,001telephone [172]
Flag of the United States.svg United States Registered voters Fox News May 11–14, 201943%51%6%1,008telephone [173]
Flag of the United States.svg United States All adults Monmouth University April 11–15, 201942%56%3%801telephone [174]
Flag of the United States.svg United States Registered voters Fox News March 17–20, 201944%51%5%1,002telephone [175]
Flag of the United States.svg United States All adults Monmouth University March 1–4, 201944%51%4%802telephone [176]
Flag of the United States.svg United States Registered voters Quinnipiac University March 1–4, 201941%55%4%1,120telephone [177]
Flag of the United States.svg United States Registered voters Fox News February 10–12, 201946%50%4%1,004telephone [90]
Flag of North Carolina.svg North Carolina All adults High Point University February 4–11, 201944%46%11%873telephone and online [178]
Flag of California.svg California Registered voters Quinnipiac University January 30 - February 4, 201932%64%4%912telephone [179]
Flag of the United States.svg United States Registered voters Quinnipiac University January 25–28, 201941%55%4%1,004telephone [180]
Flag of the United States.svg United States All adults Monmouth University January 25–27, 201944%52%4%805telephone [181]
Flag of the United States.svg United States All adults Gallup January 21–27, 201940%60%1%1,022telephone [182]
Flag of the United States.svg United States All adults ABC News/ Washington Post January 21–24, 201942%54%4%1,001telephone [183]
Flag of the United States.svg United States All adults NBC News/ Wall Street Journal January 20–23, 201945%52%3%900telephone [123]
Flag of the United States.svg United States Registered voters Fox News January 20–22, 201943%51%6%1,008telephone [184]
Flag of the United States.svg United States All adults Pew Research Center January 9–14, 201940%58%2%1,505telephone [185]
Flag of the United States.svg United States Registered voters Quinnipiac University January 9–13, 201943%55%2%1,209telephone [186]
Flag of the United States.svg United States All adults Investor's Business Daily January 3–12, 201946%53%1%903telephone [187]
Flag of the United States.svg United States All adults CNN January 10–11, 201939%56%5%848telephone [188]
Flag of the United States.svg United States All adults ABC News/ Washington Post January 8–11, 201942%54%4%788telephone [189]
Flag of the United States.svg United States Registered voters Quinnipiac University December 12–17, 201843%54%3%1,147telephone [190]
Flag of the United States.svg United States All adults CNN December 6–9, 201838%57%4%1,015telephone [191]
Flag of California.svg California All adults Public Policy Institute of California October 12–21, 201824%74%2%1,690telephone [192]
Flag of the United States.svg United States All adults CBS News October 14–17, 201837%60%3%1,108telephone [193]
Flag of the United States.svg United States Registered voters Fox News September 16–19, 201839%51%10%1,003telephone [194]
Flag of the United States.svg United States Registered voters Quinnipiac University August 9–13, 201838%58%4%1,175telephone [195]
Flag of the United States.svg United States All adults Washington Post /Schar School of Policy and Government June 27 – July 2, 201842%55%3%1,473telephone and online [196]
Flag of the United States.svg United States Registered voters Quinnipiac University June 14–17, 201839%58%4%905telephone [197]
Flag of Wisconsin.svg Wisconsin Likely voters Marquette University Law School June 13–17, 201840%55%4%800telephone [132]
Flag of the United States.svg United States All adults Gallup June 1–13, 201841%57%2%1,520telephone [198]
Flag of the United States.svg United States All adults Pew Research Center June 5–12, 201840%56%4%2,002telephone [199]
Flag of the United States.svg United States All adults CBS News May 3–6, 201838%59%3%1,101telephone [200]
Flag of the United States.svg United States All adults Investor's Business Daily April 26 – May 4, 201840%59%1%900telephone [201]
Flag of Texas.svg Texas Registered voters Quinnipiac University April 12–17, 201843%53%4%1,029telephone [202]
Flag of the United States.svg United States Registered voters Quinnipiac University April 6–9, 201840%57%3%1,181telephone [203]
Flag of California.svg California All adults Public Policy Institute of California March 4–13, 201825%71%3%1,694telephone [204]
Flag of the United States.svg United States All adults CBS News March 8–11, 201838%60%2%1,223telephone [205]
Flag of Wisconsin.svg Wisconsin Registered voters Marquette University Law School February 25 – March 1, 201837%59%3%800telephone [133]
Flag of the United States.svg United States Registered voters Quinnipiac University February 2–5, 201837%59%4%1,333telephone [206]
Flag of the United States.svg United States All adults Monmouth University January 28–30, 201840%57%3%806telephone [207]
Flag of the United States.svg United States Registered voters Fox News January 21–23, 201840%53%7%1,002telephone [43]
Flag of the United States.svg United States All adults ABC News/ Washington Post January 15–18, 201834%63%3%1,005telephone [208]
Flag of the United States.svg United States All adults CNN January 14–18, 201835%62%3%1,005telephone [209]
Flag of the United States.svg United States All adults CBS News January 13–16, 201835%61%4%1,125telephone [210]
Flag of the United States.svg United States All adults Pew Research Center January 10–15, 201837%60%3%1,503telephone [211]
Flag of the United States.svg United States Registered voters Quinnipiac University January 5–9, 201834%63%3%1,106telephone [212]
Flag of the United States.svg United States Registered voters Quinnipiac University December 6–11, 201736%62%2%1,211telephone [213]
Flag of the United States.svg United States All adults CBS News December 3–5, 201736%61%3%1,120telephone [214]
Flag of New Hampshire.svg New Hampshire All adults University of New Hampshire October 26 – November 9, 201734%61%2%956telephone [215]
Flag of the United States.svg United States All adults Public Religion Research Institute October 18–30, 201736%63%2%2,019telephone [216]
Flag of the United States.svg United States All adults Associated Press/NORC September 28 – October 2, 201732%49%---1,150telephone and online [217]
Flag of the United States.svg United States Registered voters Quinnipiac University September 21–26, 201737%60%3%1,412telephone [218]
Flag of Virginia.svg Virginia Likely voters Roanoke College September 16–23, 201733%61%5%596telephone [219]
Flag of the United States.svg United States All adults ABC News/ Washington Post September 18–21, 201737%62%1%1,002telephone [220]
Flag of the United States.svg United States All adults CNN September 17–20, 201733%63%3%1,053telephone [221]
Flag of the United States.svg United States All adults Monmouth University September 15–19, 201735%60%5%1,009telephone [222]
Flag of California.svg California All adults Public Policy Institute of California September 10–19, 201724%73%2%1,726telephone [223]
Flag of the United States.svg United States All adults YouGov (for The Economist )September 3–5, 201738%47%16%1,500online [224]
Flag of the United States.svg United States Registered voters Fox News August 27–29, 201739%56%5%1,006telephone [53]
Flag of the United States.svg United States All adults CBS News August 3–6, 201736%61%3%1,111telephone [225]
Flag of the United States.svg United States Likely voters Rasmussen Reports July 26–27, 201737%56%---1,000telephone and online [226]
Flag of the United States.svg United States Registered voters Fox News May 21–23, 201732%65%3%1,011telephone [227]
Flag of the United States.svg United States All adults YouGov (for The Economist )May 6–9, 201740%46%14%1,500online [228]
Flag of the United States.svg United States Registered voters Quinnipiac University May 4–9, 201733%64%3%1,078telephone [162]
Flag of Mexico.svg Mexico All adults Pew Research Center March 2 – April 10, 20175%94%2%1,000face-to-face [229] [230]
Flag of the United States.svg United States Registered voters Quinnipiac University March 30 – April 3, 201733%64%3%1,171telephone [151]
Flag of the United States.svg United States All adults Gallup March 9–29, 201736%56%7%1,526telephone [231]
Flag of the United States.svg United States All adults Pew Research Center February 16 – March 15, 201735%64%1%1,505telephone [232]
Flag of California.svg California All adults Public Policy Institute of California March 5–14, 201725%72%3%1,690telephone [233]
Flag of the United States.svg United States All adults Pew Research Center February 28 – March 12, 201740%59%1%3,844telephone and online [23]
Flag of the United States.svg United States All adults SurveyMonkey March 1–5, 201744%54%3%4,551online [234]
Flag of the United States.svg United States All adults CBS News February 17–21, 201739%58%3%1,280telephone [235]
Flag of the United States.svg United States Registered voters Quinnipiac University February 16–21, 201737%60%3%1,323telephone [152]
Flag of the United States.svg United States All adults SurveyMonkey (for NBC News)February 13–19, 201741%56%2%11,512online [236]
Flag of the United States.svg United States All adults Pew Research Center February 7–12, 201735%62%3%1,503telephone [237]
Flag of the United States.svg United States Registered voters Morning Consult/Politico February 2–4, 201748%42%10%2,070online interviews [147]
Flag of San Diego, California.svg San Diego N/A SurveyUSA (for San Diego Union-Tribune )January 25, 201743%48%8%500N/A [238]
Flag of the United States.svg United States Registered voters Morning Consult (for Politico)January 20–22, 201747%45%7%1,992telephone [239]

  majority support  plurality support  majority oppose  plurality oppose

Construction of Keystone Pipeline

In January 2017, Donald Trump ordered the U.S. Army Corps of Engineers to permit construction of the proposed Keystone XL oil pipeline. [147] Donald Trump wanted to build the final uncompleted portion of the Dakota Access pipeline. The Keystone XL oil pipeline would bring oil from Alberta, Canada to the Nebraska area. It would then connect to an existing pipeline to bring the crude to the Illinois area. [240]

Area polledSegment polledPolling groupDateSupportOpposeUnsureSample sizePolling methodSource
Flag of Canada (Pantone).svg Canada All adults Angus Reid Institute February 16–22, 201748%33%19%1,515online [241]
Flag of the United States.svg United States All adults Pew Research Center February 7–12, 201742%48%10%1,503telephone [242]
Flag of the United States.svg United States Registered voters Morning Consult/Politico February 2–4, 201748%37%15%2,070online interviews [147]

  majority support  plurality support  majority oppose  plurality oppose

Deportation of illegal immigrants with criminal records

In an interview following his election, Donald Trump said illegal immigrants with criminal records should be deported. [243]

Area polledSegment polledPolling groupDateSupportOpposeUnsureSample sizePolling methodSource
Flag of the United States.svg United States Registered voters Morning Consult (for Politico)January 20–22, 201772%20%8%1,992online [239]

  majority support  plurality support  majority oppose  plurality oppose

Government employee staffing cuts

Donald Trump has proposed a 20-percent cut in parts of the U.S. Government workforce. [244]

Area polledSegment polledPolling groupDateSupportOpposeUnsureSample sizePolling methodSource
Flag of the United States.svg United States Likely voters Rasmussen Reports January 17–18, 201754%27%19%1,500telephone and online [244]

  majority support  plurality support  majority oppose  plurality oppose

Obamacare repeal

Donald Trump has called for the repeal of the Affordable Care Act ("Obamacare"). [161]

Area polledSegment polledPolling groupDateSupportOpposeUnsureSample sizePolling methodSource(s)
Flag of the United States.svg United States Registered voters Fox News October 3–6, 202032%64%4%1,107telephone [62]
Flag of Wisconsin.svg Wisconsin Registered voters Marquette University Law School August 4–9, 202040%54%6%801telephone [245]
Flag of the United States.svg United States Registered voters NBC News/ Wall Street Journal September 13–16, 201943%52%5%900telephone [11]
Flag of the United States.svg United States Registered voters Quinnipiac University June 14–17, 201844%51%5%905telephone [246]
Flag of Ohio.svg Ohio Registered voters Quinnipiac University June 7–12, 201844%51%4%1,082telephone [247]
Flag of Texas.svg Texas Registered voters Quinnipiac University April 12–17, 201845%49%5%1,029telephone [202]
Flag of the United States.svg United States Registered voters Quinnipiac University September 21–26, 201745%51%5%1,412telephone [218]
Flag of the United States.svg United States Registered voters Quinnipiac University August 9–15, 201745%52%3%1,361telephone [248]
Flag of the United States.svg United States All adults CNN August 3–6, 201733%64%3%1,018telephone [249]
Flag of the United States.svg United States Registered voters Quinnipiac University July 27 – August 1, 201742%54%4%1,125telephone [250]
Flag of the United States.svg United States All adults Associated Press/NORC July 13–17, 201746%53%---1,019telephone and online [251]
Flag of the United States.svg United States Registered voters Quinnipiac University June 22–27, 201745%51%4%1,212telephone [252]
Flag of the United States.svg United States Registered voters Quinnipiac University May 31 – June 6, 201744%53%4%1,361telephone [253]
Flag of the United States.svg United States Registered voters Quinnipiac University May 17–23, 201745%50%4%1,404telephone [254]
Flag of the United States.svg United States Registered voters Quinnipiac University May 4–9, 201744%53%3%1,078telephone [162]
Flag of the United States.svg United States Registered voters Quinnipiac University April 12–18, 201744%53%2%1,062telephone [150]
Flag of the United States.svg United States Registered voters Quinnipiac University March 30 – April 3, 201742%54%4%1,171telephone [151]
Flag of the United States.svg United States Registered voters Quinnipiac University March 16–21, 201745%51%5%1,056telephone [255]
Flag of the United States.svg United States All adults Kaiser Family Foundation March 6–12, 201745%51%3%1,206telephone [256]
Flag of the United States.svg United States Registered voters Quinnipiac University March 2–6, 201745%51%4%1,323telephone [165]
Flag of the United States.svg United States Registered voters Public Policy Polling February 21–22, 201743%51%6%941telephone and online [257]
Flag of the United States.svg United States Registered voters Quinnipiac University February 16–21, 201743%54%3%1,323telephone [152]
Flag of the United States.svg United States All adults Investor's Business Daily January 27 – February 2, 201742%54%4%885telephone [258]
Flag of the United States.svg United States All adults Quinnipiac University January 5–9, 201748%47%5%899telephone [161]

  majority support  plurality support  majority oppose  plurality oppose

Refugee restrictions

During his presidential campaign, Donald Trump called for the suspension of immigration to the United States from seven "terror prone" countries. In January 2017, he signed an executive order partially implementing that policy and halving annual U.S. refugee intake from 100,000 to 50,000. [161] [259]

Area polledSegment polledPolling groupDateSupportOpposeUnsureSample sizePolling methodSource
Flag of the United States.svg United States All adults YouGov (for HuffPost )May 25–26, 201745%43%13%1,000online [260]
Flag of the United States.svg United States All adults Gallup March 9–29, 201740%46%14%1,526telephone [231]
Flag of the United States.svg United States Registered voters Quinnipiac University March 16–21, 201742%52%6%1,056telephone [164]
Flag of California.svg California All adults Public Policy Institute of California March 6–14, 201737%58%5%1,487telephone [233]
Flag of the United States.svg United States All adults Pew Research Center February 28 – March 12, 201747%52%1%3,844telephone and online [23]
Flag of the United States.svg United States Registered voters Quinnipiac University March 2–6, 201742%51%7%1,323telephone [165]
Flag of the United States.svg United States Registered voters Morning Consult/Politico February 2–4, 201755%38%7%2,070online interviews [147]
Flag of the United States.svg United States All adults CBS News February 1–2, 201745%51%4%1,019telephone [261]
Flag of the United States.svg United States All adults Investor's Business Daily January 27 – February 2, 201751%48%1%885telephone [258]
Flag of the United States.svg United States Registered voters Ipsos (for Reuters)January 30–31, 201749%41%10%1,201online [262]
Flag of the United States.svg United States Likely voters Rasmussen Reports January 25–26, 201757%32%11%1,000telephone and online [263]
Flag of Utah.svg Utah Registered voters University of Utah January 9–16, 201740%55%5%605N/A [264]
Flag of the United States.svg United States All adults Quinnipiac University January 5–9, 201748%42%10%899telephone [161]

  majority support  plurality support  majority oppose  plurality oppose

Sanctuary city funding

In January 2017, Donald Trump issued an executive order that would block federal funding to "sanctuary cities". [147]

Area polledSegment polledPolling groupDateSupportOpposeUnsureSample sizePolling methodSource
Flag of the United States.svg United States Registered voters Morning Consult/Politico February 2–4, 201755%33%12%2,070online [147]

  majority support  plurality support  majority oppose  plurality oppose

UN funding

Donald Trump has said he plans to dramatically reduce United States funding to the United Nations and UN programs. [265]

Area polledSegment polledPolling groupDateSupportOpposeUnsureSample sizePolling methodSource
Flag of the United States.svg United States Likely voters Rasmussen Reports January 29–30, 201750%33%17%1,000telephone and online [265]

  majority support  plurality support  majority oppose  plurality oppose

Withdrawal from the Paris Agreement on climate change

On June 1, 2017, Donald Trump announced that the United States would withdraw from the Paris Agreement on climate change. [266]

Area polledSegment polledPolling groupDateSupportOpposeUnsureSample sizePolling methodSource
Flag of the United States.svg United States All adults NPR/PBS NewsHour/Marist College June 21–25, 201730%53%16%1,205telephone [267]
Flag of the United States.svg United States All adults Associated Press/NORC June 8–11, 201729%46%1%1,068telephone and online [268]
Flag of the United States.svg United States All adults YouGov (for The Economist )June 4–6, 201732%50%18%1,500online [269]
Flag of the United States.svg United States Registered voters Quinnipiac University June 1–6, 201732%62%6%1,361telephone [270]
Flag of the United States.svg United States All adults ABC News/ Washington Post June 2–4, 201728%59%13%527telephone [271]
Flag of the United States.svg United States All adults Princeton Survey Research Associates InternationalJune 1–4, 201734%54%8%1,003telephone [272]

  majority support  plurality support  majority oppose  plurality oppose

Withdrawal from Trans-Pacific Partnership

In January 2017, Donald Trump withdrew the United States from the Trans-Pacific Partnership trade pact. [273]

Area polledSegment polledPolling groupDateSupportOpposeUnsureSample sizePolling methodSource
Flag of the United States.svg United States Registered voters Morning Consult/Politico February 2–4, 201747%33%20%2,070online interviews [147]
Flag of the United States.svg United States Likely voters Rasmussen Reports January 26, 201756%27%17%1,500telephone and online [273]

  majority support  plurality support  majority oppose  plurality oppose

Global polls

A Gallup poll on 134 countries comparing the approval ratings of US leadership between the years 2016 and 2017 found that only in 29 of them did Trump lead Obama in job approval and that people living in authoritarian or hybrid regime states generally tended to rate Trump more favorably compared to people living in democratic states. [274] Overall, more international respondents disapproved rather than approved of the Trump administration and approval ratings were reported to be similar to those in the last 2 years of the Bush administration. [275] A Pew Research Center poll of 37 nations conducted in July 2017 found "a median of just 22% has confidence in Trump to do the right thing when it comes to international affairs". This compares to a median of 64% rate of confidence for his predecessor Barack Obama. Trump received a higher rating in only two countries: Russia and Israel. [276] In a 2018 Pew Research poll of 25 nations, the confidence in Trump rose to 27%. [277] In the 2019 poll, the confidence in Trump was at 29%. [278] In the September 2020 poll, the confidence in Trump decreased to 16%. [279]

Post-Presidency retrospective polls

In a 2023 Gallup poll measuring approval of recent former presidents during their time in office, Trump had a retrospective approval rating of 46%, which was second lowest among presidents, measuring only above Richard Nixon. Trump had 12% among Democrats, 41% among Independents, and 91% among Republicans. Trump had the lowest approval rating among all presidents surveyed with Democrats, the second lowest among Independents (ahead of only Richard Nixon), and the second highest among Republicans (behind only Ronald Reagan). Trump also had the biggest partisan gap of approval among all presidents listed with a 79% approval gap between Democrats and Republicans. [280]

See also

Related Research Articles

<span class="mw-page-title-main">Republican Party (United States)</span> American political party

The Republican Party, also referred to as the GOP, is one of the two major contemporary political parties in the United States. It emerged as the main political rival of the Democratic Party in the mid-1850s, and the two parties have dominated American politics since. The GOP was founded in 1854 by anti-slavery activists who opposed the Kansas–Nebraska Act, which allowed for the potential expansion of chattel slavery into the western territories. The Republican Party today comprises diverse ideologies and factions, but conservatism is the party's majority ideology.

<span class="mw-page-title-main">Public opinion of same-sex marriage in the United States</span>

Public opinion of same-sex marriage in the United States has had a significant change in last decades, and currently overwhelming majority of Americans are in favor of same-sex marriage. A 2023 Gallup poll found that 71% of Americans supports same-sex marriage.

Before the legalization of same-sex marriage in Florida in January 2015, same-sex couples were able to have their relationships recognized in some Florida localities that had established a legal status known as domestic partnership.

This is a list of nationwide public opinion polls that were conducted relating to the Republican primaries for the 2016 United States presidential election. The persons named in the polls were either declared candidates, former candidates, or received media speculation about their possible candidacy. On May 4, 2016, Donald Trump became the sole contender and presumptive nominee.

This is a list of nationwide public opinion polls that have been conducted relating to the Democratic primaries for the 2016 United States presidential election. The persons named in the polls are declared candidates, are former candidates, or have received media speculation about their possible candidacy.

<span class="mw-page-title-main">Statewide opinion polling for the 2016 Republican Party presidential primaries</span>

This article contains opinion polling by U.S. state for the 2016 Republican Party presidential primaries. The shading for each poll indicates the candidate(s) which are within one margin of error of the poll's leader.

<span class="mw-page-title-main">Statewide opinion polling for the 2016 Democratic Party presidential primaries</span>

This article contains opinion polling by U.S. state for the 2016 Democratic Party presidential primaries. For currency and accuracy, please note the specific dates for each polling as listed below. For the significance of the earliest state votes, the Iowa caucuses and the New Hampshire primary, see United States presidential primary – Iowa and New Hampshire. To know when any given state votes, see the timeline of primaries and caucuses.

This page lists nationwide public opinion polls that have been conducted relating to the 2016 United States presidential election. The two major party candidates were chosen at the Democratic National Convention and Republican National Convention in July 2016.

Statewide polls for the 2016 United States presidential election are as follows. The polls listed here, by state, are from 2013 to December 31, 2015, and provide early data on opinion polling between a possible Republican candidate against a possible Democratic candidate.

<span class="mw-page-title-main">2016 Florida Democratic presidential primary</span>

The 2016 Florida Democratic presidential primary took place on March 15 in the U.S. state of Florida as one of the Democratic Party's primaries ahead of the 2016 presidential election.

<span class="mw-page-title-main">2016 New York Republican presidential primary</span>

The 2016 New York Republican presidential primary was held on April 19 in the U.S. state of New York as one of the Republican Party's primaries ahead of the 2016 presidential election.

<span class="mw-page-title-main">2016 Ohio Republican presidential primary</span>

The 2016 Ohio Republican presidential primary took place March 15 in the U.S. state of Ohio, as a part of the Republican Party's series of presidential primaries ahead of the 2016 presidential election. The Ohio primary was held alongside Republican primary elections in Florida, Illinois, Missouri and North Carolina, along with the Democratic contest in Ohio.

Statewide polls for the 2016 United States presidential election are as follows. The polls listed here, by state, are from January 1 to August 31, 2016 and provide early data on opinion polling between a possible Republican candidate against a possible Democratic candidate.

<span class="mw-page-title-main">Trump travel ban</span> Ban by U.S. President Trump

The Trump travel ban denotes a series of executive actions taken by Donald Trump as President of the United States, beginning with Protecting the Nation from Foreign Terrorist Entry into the United States.

This is a list of opinion polls taken on the Presidency of Donald Trump in 2018.

This is a list of opinion polls taken on the presidency of Donald Trump in 2019. Polls throughout the year showed that more disapproved of Trump than approved of him, generally by a margin of between five and fifteen percentage points. The polls also showed that the margin may have been stronger or weaker in some states, when compared with the national polls.

This page lists nationwide public opinion polls that have been conducted relating to the 2016 United States presidential election in Florida, contested by Hillary Clinton, Donald Trump, Gary Johnson and Jill Stein. The state was won by Donald Trump with 49.02% of the vote against 47.82% for Hillary Clinton.

<span class="mw-page-title-main">2021 opinion polling on the Joe Biden administration</span>

This is a list of opinion polls taken on the presidency of Joe Biden in 2021. To navigate between years, see opinion polling on the Joe Biden administration. For 2022 opinion polling, see 2022 opinion polling on the Joe Biden administration.

<span class="mw-page-title-main">2022 opinion polling on the Joe Biden administration</span>

This is a list of opinion polls taken on the presidency of Joe Biden in 2022. To navigate between years, see opinion polling on the Joe Biden administration.

References

  1. "How Popular Is Donald Trump?". FiveThirtyEight . 2 March 2017. Archived from the original on August 12, 2017. Retrieved June 16, 2020.
  2. "President Trump Job Approval". RealClearPolitics . Archived from the original on October 4, 2017. Retrieved June 16, 2020.
  3. "AtlasIntel Survey". January 3, 2021.
  4. "NBC News/Wall Street Journal Survey". Hart Research Associates (D) and Public Opinion Strategies (R). August 17, 2020. Archived from the original on August 18, 2020. Retrieved August 18, 2020.
  5. "Marquette Law School Poll: June 14-18, 2020" (PDF). MAXimum Research, Inc. June 24, 2020. Archived (PDF) from the original on June 24, 2020. Retrieved June 24, 2020.
  6. "NBC News/Wall Street Journal Survey" (PDF). Hart Research Associates (D) and Public Opinion Strategies (R). June 7, 2020. Archived (PDF) from the original on December 6, 2020. Retrieved June 7, 2020.
  7. 1 2 "Fox News Poll" (PDF). Beacon Research (D) and Shaw & Company Research (R). May 21, 2020. Archived (PDF) from the original on May 27, 2020. Retrieved June 16, 2020.
  8. "Voters Divided on Alleged Biden Assault". Monmouth University Polling Institute. May 6, 2020. Archived from the original on May 13, 2020. Retrieved May 13, 2020.
  9. "Marquette Law School Poll: November 13 - 17, 2019" (PDF). Precision Opinion. November 20, 2019. Archived (PDF) from the original on November 22, 2019. Retrieved November 21, 2019.
  10. 1 2 3 "Grinnell College National Poll" (PDF). Selzer & Company. October 29, 2019. Archived (PDF) from the original on October 29, 2019. Retrieved October 29, 2019.
  11. 1 2 3 "NBC News/Wall Street Journal Survey" (PDF). Hart Research Associates (D) and Public Opinion Strategies (R). September 22, 2019. Archived (PDF) from the original on September 23, 2019. Retrieved September 23, 2019.
  12. 1 2 "Fox News Poll". Beacon Research (D) and Shaw & Company Research (R). August 15, 2019. Archived from the original on August 15, 2019. Retrieved August 16, 2019.
  13. "NBC News/Wall Street Journal Survey" (PDF). Hart Research Associates (D) and Public Opinion Strategies (R). September 23, 2018. Archived (PDF) from the original on September 23, 2018. Retrieved September 23, 2018.
  14. 1 2 "Obama is NY's Favorite Living President; Trump Least Favorite" (PDF). Siena Research Institute. February 15, 2018. Archived from the original (PDF) on February 15, 2018. Retrieved February 15, 2018.
  15. 1 2 "CNN January 2018" (PDF). SSRS. January 20, 2018. Archived (PDF) from the original on January 20, 2018. Retrieved January 20, 2018.
  16. 1 2 3 "NBC News/Wall Street Journal Survey" (PDF). Hart Research Associates (D) and Public Opinion Strategies (R). February 2, 2018. Archived (PDF) from the original on February 5, 2018. Retrieved June 22, 2018.
  17. "NBC News/Marist Poll of 907 Michigan Adults" (PDF). August 20, 2017. Archived (PDF) from the original on December 7, 2018. Retrieved July 14, 2019.
  18. "NBC News/Wall Street Journal Survey" (PDF). Hart Research Associates (D) and Public Opinion Strategies (R). September 6, 2017. Archived from the original (PDF) on September 6, 2017. Retrieved September 6, 2017.
  19. 1 2 3 "Bloomberg News National Poll". Selzer & Company. July 18, 2017. Archived from the original on July 18, 2017. Retrieved July 18, 2017.
  20. 1 2 3 "NBC News/Wall Street Journal Survey" (PDF). Hart Research Associates (D) and Public Opinion Strategies (R). Archived (PDF) from the original on April 25, 2017. Retrieved April 25, 2017.
  21. "Core Political Data" (PDF). April 18, 2017. Archived (PDF) from the original on April 19, 2017. Retrieved April 18, 2017.
  22. "Core Political Data". March 29, 2017. Archived from the original on March 31, 2017. Retrieved March 30, 2017.
  23. 1 2 3 4 5 "Wave 24.5 Mode Study- Final Topline" (PDF). March 31, 2017. Archived (PDF) from the original on April 1, 2017. Retrieved March 31, 2017.
  24. 1 2 3 4 5 "Polling Data". RealClearPolitics. Archived from the original on January 28, 2017. Retrieved January 28, 2017.{{cite web}}: CS1 maint: bot: original URL status unknown (link)
  25. 1 2 3 "Approval of U.S. Congressional Republicans Tops Democrats". Gallup. March 10, 2020. Archived from the original on March 10, 2020. Retrieved March 10, 2020.
  26. "Overwhelming Support for a Dozen of Cuomo's State of the State Proposals" (PDF). Siena College Research Institute. January 21, 2020. Archived (PDF) from the original on February 15, 2021. Retrieved January 21, 2020.
  27. 1 2 "SNY0919 Crosstabs 091719" (PDF). Siena College Research Institute. September 17, 2019. Archived (PDF) from the original on September 17, 2019. Retrieved September 17, 2019.
  28. "SNY0819 Crosstabs" (PDF). Siena College Research Institute. August 6, 2019. Archived (PDF) from the original on August 12, 2019. Retrieved August 12, 2019.
  29. "Voters on End of Session Agenda: 'Yes' on Marijuana (55-40%)" (PDF). Siena College Research Institute. June 10, 2019. Archived (PDF) from the original on June 10, 2019. Retrieved June 10, 2019.
  30. "Voters Strongly Say Permanent Property Tax Cap & Plastic Bag Ban Are Good for NY" (PDF). Siena College Research Institute. April 16, 2019. Archived (PDF) from the original on April 16, 2019. Retrieved April 16, 2019.
  31. "2/3 of Voters Say Amazon Cancelling Queens HQ Bad for NY" (PDF). Siena Research Institute. March 18, 2019. Archived (PDF) from the original on March 19, 2019. Retrieved March 18, 2019.
  32. "Voters Give Cuomo & Schumer Their Lowest Ratings Ever" (PDF). Siena Research Institute. February 11, 2019. Archived (PDF) from the original on February 12, 2019. Retrieved February 11, 2019.
  33. 1 2 "190130Shutdown". Gallup . January 30, 2019. Archived from the original on January 30, 2019. Retrieved January 30, 2019.
  34. 1 2 "Shutdown Does Not Change Trump's Already Bad Grades, Quinnipiac University National Poll Finds; Trump Approval For Handling Economy Down Slightly". Quinnipiac University. January 15, 2019. Archived from the original on January 15, 2019. Retrieved January 15, 2019.
  35. "SNY0119 Crosstabs011819" (PDF). Siena Research Institute. January 18, 2019. Archived (PDF) from the original on January 19, 2019. Retrieved January 19, 2019.
  36. 1 2 3 "190103Favorables". Gallup . January 3, 2019. Archived from the original on January 3, 2019. Retrieved January 3, 2019.
  37. 1 2 "Fox News Poll". Anderson Robbins Research (D) and Shaw & Company Research (R). December 17, 2018. Archived from the original on December 17, 2018. Retrieved December 17, 2018.
  38. 1 2 "Fox News Poll". Anderson Robbins Research (D) and Shaw & Company Research (R). August 23, 2018. Archived from the original on August 23, 2018. Retrieved August 23, 2018.
  39. "Cuomo Leads Molinaro by 19 Points Among Likely Voters" (PDF). Siena Research Institute. June 13, 2018. Archived from the original (PDF) on June 13, 2018. Retrieved June 13, 2018.
  40. 1 2 3 "Fox News Poll". Anderson Robbins Research (D) and Shaw & Company Research (R). April 26, 2018. Archived from the original on April 26, 2018. Retrieved April 26, 2018.
  41. "SNY0418 Crosstabs" (PDF). Siena Research Institute. April 17, 2018. Archived from the original (PDF) on April 17, 2018.
  42. 1 2 3 4 "American Voters Still Want To See Trump's Tax Returns, Quinnipiac University National Poll Finds; Approval Dips Back Below 40 Percent". Quinnipiac University. February 21, 2018. Archived from the original on February 21, 2018. Retrieved February 21, 2018.
  43. 1 2 3 4 "Fox News Poll" (PDF). Anderson Robbins Research (D) and Shaw & Company Research (R). February 7, 2018. Archived from the original (PDF) on February 7, 2018. Retrieved February 8, 2018.
  44. "Cuomo Starts Re-Election Year & Tough Budget Season with All Ratings Up & Best Favorable Rating Since June 2014" (PDF). January 16, 2018. Archived from the original (PDF) on January 16, 2018. Retrieved January 16, 2018.
  45. 1 2 "Emerson College Poll" (PDF). Emerson College Polling Society. Archived from the original (PDF) on April 11, 2019. Retrieved October 16, 2017.
  46. 1 2 3 4 "National Tracking Poll #171004". Politico. October 11, 2017. Archived from the original on October 12, 2017. Retrieved October 11, 2017.
  47. "SNY0917 Crosstabs" (PDF). October 6, 2017. Archived from the original (PDF) on October 6, 2017. Retrieved October 6, 2017.
  48. "Support for ConCon Fading; Voters Evenly Divided on Whether It's a Waste of Time". Siena Research Institute. October 6, 2017. Archived from the original on October 6, 2017. Retrieved October 6, 2017.
  49. 1 2 3 "CNN September 2017" (PDF). SSRS. September 21, 2017. Archived (PDF) from the original on September 21, 2017. Retrieved September 21, 2017.
  50. 1 2 3 "Poll - Parties and 2018" (PDF). SSRS. September 24, 2017. Archived (PDF) from the original on September 24, 2017. Retrieved September 24, 2017.
  51. 1 2 3 "NBC News/Wall Street Journal Survey" (PDF). Hart Research Associates (D) and Public Opinion Strategies (R). September 21, 2017. Archived from the original (PDF) on September 21, 2017. Retrieved September 21, 2017.
  52. "SNY0817 Crosstabs 090617" (PDF). Archived from the original (PDF) on September 8, 2017. Retrieved September 8, 2017.
  53. 1 2 3 4 5 "Fox News poll results 8/30". Anderson Robbins Research (D) and Shaw & Company Research (R). August 30, 2017. Archived from the original on August 30, 2017. Retrieved August 30, 2017.
  54. 1 2 "Fox News Poll: June 28, 2017". Anderson Robbins Research (D) and Shaw & Company Research (R). June 28, 2017. Archived from the original on June 28, 2017. Retrieved June 28, 2017.
  55. "SNY0517 Crosstabs 052517" (PDF). May 25, 2017.
  56. 1 2 3 "U.S. Voters Send Trump Approval To Near Record Low; Quinnipiac University National Poll Finds; No Winner In Media War, But Voters Trust Media More". Quinnipiac University. May 10, 2017. Archived from the original on May 10, 2017. Retrieved May 10, 2017.
  57. 1 2 3 "Trump Slump Continues As He Drops Below Obama, Quinnipiac University National Poll Finds; Republicans In Congress Drop To More Than 3-1 Negative". Quinnipiac University. April 4, 2017. Archived from the original on April 4, 2017. Retrieved April 4, 2017.
  58. "Siena College Poll Trends – March 2017" (PDF). Siena College. March 27, 2017. Archived from the original (PDF) on March 30, 2017. Retrieved March 28, 2017.
  59. 1 2 "The Economist/YouGov Poll" (PDF). Archived (PDF) from the original on March 3, 2017. Retrieved March 2, 2017.
  60. "U.S. Voters Enthusiastic, Anxious as 2020 Campaign Ends". Gallup. October 30, 2020. Archived from the original on October 30, 2020. Retrieved October 30, 2020.
  61. "NBC News/Wall Street Journal Survey" (PDF). Hart Research Associates (D) and Public Opinion Strategies (R). October 15, 2020. Archived (PDF) from the original on December 12, 2020. Retrieved October 25, 2020.
  62. 1 2 "Fox News Poll" (PDF). Beacon Research (D) and Shaw & Company Research (R). October 7, 2020. Archived (PDF) from the original on December 6, 2020. Retrieved October 12, 2020.
  63. "CNN October 2020" (PDF). SSRS. October 6, 2020. Archived (PDF) from the original on January 6, 2021. Retrieved October 6, 2020.
  64. "NBC News/Wall Street Journal Survey" (PDF). Hart Research Associates (D) and Public Opinion Strategies (R). October 4, 2020. Archived (PDF) from the original on October 4, 2020. Retrieved October 4, 2020.
  65. "Biden Leads Trump 49-41% Among Likely Voters Nationally" (PDF). Siena College Research Institute. September 27, 2020. Archived (PDF) from the original on September 27, 2020. Retrieved September 27, 2020.
  66. "NBC News/Wall Street Journal Survey" (PDF). Hart Research Associates (D) and Public Opinion Strategies (R). September 20, 2020. Archived (PDF) from the original on September 20, 2020. Retrieved September 20, 2020.
  67. "Trump, Biden Favorable Ratings Both Below 50%". Gallup. September 18, 2020. Archived from the original on September 18, 2020. Retrieved September 18, 2020.
  68. "Fox News Poll" (PDF). Beacon Research (D) and Shaw & Company Research (R). September 13, 2020. Archived (PDF) from the original on September 13, 2020. Retrieved September 13, 2020.
  69. "Voter Doubt of 2020 Outcome Possible". Monmouth University Polling Institute. September 10, 2020. Archived from the original on September 11, 2020. Retrieved September 11, 2020.
  70. "NBC News/Marist Poll of 1,146 Florida Adults" (PDF). Marist Poll. September 8, 2020. Archived (PDF) from the original on September 8, 2020. Retrieved September 8, 2020.
  71. "CNN September 2020" (PDF). SSRS. September 2, 2020. Archived (PDF) from the original on September 2, 2020. Retrieved September 2, 2020.
  72. "Biden Tops Trump By 10 Points Among Likely Voters, Quinnipiac University National Poll Finds; Nearly 6 In 10 Say The Country Is Worse Off Than It Was In 2016". Quinnipiac University Polling Institute. September 2, 2020. Archived from the original on September 2, 2020. Retrieved September 2, 2020.
  73. 1 2 "Suffolk University/USA TODAY FINAL" (PDF). Suffolk University Political Research Center. September 4, 2020. Archived (PDF) from the original on September 4, 2020. Retrieved September 4, 2020.
  74. "Washington Post-ABC News poll Aug. 12-15, 2020". Abt Associates of Rockville, MD. August 17, 2020. Archived from the original on August 17, 2020. Retrieved August 17, 2020.
  75. "CNN August 2020" (PDF). SSRS. August 16, 2020. Archived (PDF) from the original on August 17, 2020. Retrieved August 17, 2020.
  76. "Fox News Poll" (PDF). Beacon Research (D) and Shaw & Company Research (R). August 13, 2020. Archived (PDF) from the original on August 14, 2020. Retrieved August 14, 2020.
  77. "Battleground 66 Final" (PDF). Tarrance Group (R) and Lake Research Partners (D). August 10, 2020.
  78. "THE DES MOINES REGISTER/MEDIACOM IOWA POLL". Selzer & Company. June 19, 2020. Archived from the original on June 20, 2020. Retrieved June 20, 2020.
  79. 1 2 "Suffolk University/USA TODAY FINAL" (PDF). Suffolk University Political Research Center. Archived (PDF) from the original on May 13, 2020. Retrieved May 13, 2020.
  80. "CNN March 2020" (PDF). SSRS. March 9, 2020. Archived (PDF) from the original on March 9, 2020. Retrieved March 9, 2020.
  81. "CNN March 2020" (PDF). SSRS. March 9, 2020. Archived (PDF) from the original on October 18, 2020. Retrieved March 9, 2020.
  82. "The February 2020 AP-NORC Center Poll" (PDF). February 28, 2020. Archived (PDF) from the original on March 2, 2020. Retrieved March 9, 2020.
  83. 1 2 "Suffolk University/USA TODAY FINAL" (PDF). Suffolk University Political Research Center. January 1, 2020. Archived (PDF) from the original on January 2, 2020. Retrieved January 4, 2020.
  84. 1 2 "Approval of Members of Both Parties in Congress Under 40%". Gallup. November 6, 2019. Archived from the original on November 6, 2019. Retrieved November 6, 2019.
  85. "Suffolk University/USA TODAY Final" (PDF). Suffolk University Political Research Center. October 30, 2019. Archived (PDF) from the original on October 30, 2019. Retrieved November 3, 2019.
  86. 1 2 "CNN October 2019" (PDF). SSRS. October 22, 2019. Archived (PDF) from the original on October 22, 2019. Retrieved October 22, 2019.
  87. 1 2 "Fox News Poll". Beacon Research (D) and Shaw & Company Research (R). October 10, 2019. Archived from the original on October 11, 2019. Retrieved October 11, 2019.
  88. 1 2 "Suffolk University/USA TODAY Final" (PDF). Suffolk University Political Research Center. March 22, 2019. Archived (PDF) from the original on March 22, 2019. Retrieved March 22, 2019.
  89. "Favorability of Potential Democratic Presidential Candidates Plus Trump, Pence (Trends)". Gallup. March 7, 2019. Archived from the original on March 7, 2019. Retrieved March 7, 2019.
  90. 1 2 3 "Fox News Poll". Beacon Research (D) and Shaw & Company Research (R). February 20, 2019. Archived from the original on February 20, 2019. Retrieved February 20, 2019.
  91. 1 2 "CNN February 2019" (PDF). SSRS. February 4, 2019. Archived (PDF) from the original on February 4, 2019. Retrieved February 4, 2019.
  92. "Suffolk University/USA TODAY FINAL" (PDF). Suffolk University Political Research Center. December 20, 2018. Archived (PDF) from the original on January 13, 2019. Retrieved March 18, 2019.
  93. "U.S. Opinion on Pence Remains Divided". Gallup. October 12, 2018. Archived from the original on October 13, 2018. Retrieved October 12, 2018.
  94. "Suffolk University/USA TODAY August 2018" (PDF). Suffolk University Political Research Center. September 4, 2018. Archived (PDF) from the original on September 4, 2018. Retrieved September 4, 2018.
  95. "Suffolk University/USA TODAY Final" (PDF). Suffolk University Political Research Center. June 21, 2018. Archived (PDF) from the original on June 21, 2018. Retrieved June 21, 2018.
  96. "New Hampshire Marginals" (PDF). Suffolk University. May 2, 2018. Archived (PDF) from the original on May 3, 2018. Retrieved May 2, 2018.
  97. "The Economist/YouGov Poll" (PDF). April 25, 2018. Archived (PDF) from the original on April 25, 2018. Retrieved April 25, 2018.
  98. "Suffolk University/USA TODAY FINAL" (PDF). Suffolk University. March 1, 2018. Archived (PDF) from the original on March 1, 2018. Retrieved March 1, 2018.
  99. "Suffolk University/USA TODAY FINAL" (PDF). Suffolk University. December 13, 2017. Archived (PDF) from the original on December 14, 2017. Retrieved December 13, 2017.
  100. "CNN November 2017" (PDF). SSRS. November 8, 2017. Archived (PDF) from the original on November 8, 2017. Retrieved November 8, 2017.
  101. "Suffolk University/USA TODAY" (PDF). October 5, 2017. Archived (PDF) from the original on October 16, 2017. Retrieved October 16, 2017.
  102. "GW Battleground (LVXII)" (PDF). Tarrance Group (R) and Lake Research Partners (D). Archived (PDF) from the original on August 24, 2017. Retrieved August 24, 2017.
  103. "Suffolk University/USA TODAY Final" (PDF). Suffolk University. Archived (PDF) from the original on June 29, 2017. Retrieved June 29, 2017.
  104. "CNN/ORC International Poll" (PDF). CNN. April 26, 2017. Archived from the original (PDF) on May 17, 2017.
  105. 1 2 3 "Fox News Poll 3/15". Fox News. March 15, 2017. Archived from the original on March 16, 2017. Retrieved March 16, 2017.
  106. "Trump Inches Up, But Still Has Negative Approval Rating, Quinnipiac University National Poll Finds; U.S. Voters Say Media Is Not Enemy Of The People". Quinnipiac University. March 7, 2017. Archived from the original on March 7, 2017. Retrieved March 7, 2017.
  107. "Poll: Voters Say Trump Shows Leadership But Are Less Sure of Its Direction" (PDF). Suffolk University. March 7, 2017. Archived (PDF) from the original on March 8, 2017. Retrieved March 7, 2017.
  108. "CNN/ORC International Poll" (PDF). March 6, 2017. Archived (PDF) from the original on March 6, 2017. Retrieved March 6, 2017.
  109. 1 2 3 "NBC News/Wall Street Journal Survey" (PDF). The Wall Street Journal . February 26, 2017. Archived (PDF) from the original on February 26, 2017. Retrieved February 26, 2017.
  110. "McClatchy-Marist Poll of 1,073 National Adults" (PDF). McClatchy. February 22, 2017. Archived (PDF) from the original on February 23, 2017. Retrieved February 22, 2017.
  111. "NBC News/Wall Street Journal Survey" (PDF). Hart Research Associates (D) and Public Opinion Strategies (R). February 2, 2020. Archived (PDF) from the original on August 6, 2020. Retrieved February 2, 2020.
  112. "Fox News Poll". Beacon Research (D) and Shaw & Company Research (R). February 25, 2020. Archived from the original on January 27, 2020. Retrieved February 26, 2020.
  113. "CNN December 2019" (PDF). SSRS. December 20, 2019. Archived (PDF) from the original on December 23, 2019. Retrieved January 4, 2020.
  114. "CNN December 2019" (PDF). SSRS. December 16, 2019. Archived (PDF) from the original on December 18, 2019. Retrieved January 4, 2020.
  115. "NBC News/Wall Street Journal Survey" (PDF). Hart Research Associates (D) and Public Opinion Strategies (R). November 3, 2019. Archived (PDF) from the original on November 4, 2019. Retrieved November 6, 2019.
  116. "Battleground 65" (PDF). Tarrance Group (R) and Lake Research Partners (D). October 15, 2019. Archived (PDF) from the original on October 15, 2019. Retrieved October 18, 2019.
  117. "Suffolk University/USA TODAY Final" (PDF). Suffolk University Political Research Center. September 9, 2019. Archived (PDF) from the original on September 9, 2019. Retrieved September 10, 2019.
  118. "Fox News Poll". Beacon Research (D) and Shaw & Company Research (R). July 29, 2019. Archived from the original on August 1, 2019. Retrieved July 31, 2019.
  119. "Suffolk University/USA TODAY FINAL" (PDF). Suffolk University Political Research Center. June 24, 2019. Archived (PDF) from the original on June 24, 2019. Retrieved June 25, 2019.
  120. "In Aftermath of Mueller Report, New Yorkers Are Divided" (PDF). Siena College Research Institute. June 11, 2019. Archived (PDF) from the original on February 15, 2021. Retrieved June 11, 2019.
  121. "CNN May 2019" (PDF). SSRS. June 2, 2019. Archived (PDF) from the original on June 2, 2019. Retrieved June 2, 2019.
  122. "Battleground 64" (PDF). Tarrance Group (R) and Lake Research Partners (D). April 9, 2019. Archived (PDF) from the original on April 9, 2019. Retrieved April 11, 2019.
  123. 1 2 "NBC News/Wall Street Journal Survey" (PDF). Hart Research Associates (D) and Public Opinion Strategies (R). January 27, 2019. Archived (PDF) from the original on January 27, 2019. Retrieved January 27, 2019.
  124. "NBC News/Wall Street Journal Survey" (PDF). Hart Research Associates (D) and Public Opinion Strategies (R). December 17, 2018. Archived (PDF) from the original on December 17, 2018. Retrieved December 17, 2018.
  125. "NBC News/Wall Street Journal Survey" (PDF). Hart Research Associates (D) and Public Opinion Strategies (R). October 21, 2018. Archived (PDF) from the original on October 21, 2018. Retrieved October 21, 2018.
  126. "NBC News/Wall Street Journal Survey" (PDF). Hart Research Associates (D) and Public Opinion Strategies (R). August 26, 2018. Archived (PDF) from the original on August 26, 2018. Retrieved August 26, 2018.
  127. "EPIC▪MRA STATEWIDE POLL OF ACTIVE AND LIKELY NOVEMBER 2018 VOTERS" (PDF). Archived (PDF) from the original on May 8, 2018. Retrieved May 8, 2018.
  128. "Washington Post-ABC News poll April 8-11, 2018". Abt Associates of Rockville, MD. April 15, 2018. Archived from the original on June 29, 2018. Retrieved June 18, 2018.
  129. 1 2 "NBC News/Wall Street Journal Survey" (PDF). Hart Research Associates (D) and Public Opinion Strategies (R). March 30, 2018. Archived from the original (PDF) on March 30, 2018. Retrieved March 30, 2018.
  130. 1 2 "National Tracking Poll". Politico . February 22, 2017. Archived from the original on February 23, 2017. Retrieved February 22, 2017.
  131. "Marquette Law School Poll: September 12 - 16, 2018" (PDF). Marquette University Law School Poll. September 18, 2018. Archived (PDF) from the original on September 18, 2018. Retrieved September 18, 2018.
  132. 1 2 "Marquette Law School Poll: June 13 - June 17, 2018" (PDF). Marquette University Law School Poll. June 20, 2018. Archived (PDF) from the original on June 20, 2018. Retrieved June 20, 2018.
  133. 1 2 "Marquette Law School Poll: February 25 - March 1, 2018" (PDF). March 5, 2018. Archived (PDF) from the original on September 7, 2018. Retrieved April 11, 2018.
  134. "CNN December 2017" (PDF). SSRS. December 20, 2017. Archived (PDF) from the original on December 20, 2017. Retrieved December 20, 2017.
  135. "Base Erodes As Trump Drops To New Low Scores, Quinnipiac University National Poll Finds; Voters Say 60 – 35 Percent President Is Not Honest". Quinnipiac University. March 22, 2017. Archived from the original on March 22, 2017. Retrieved March 22, 2017.
  136. "Fox News Poll". Beacon Research (D) and Shaw & Company Research (R). April 18, 2019. Archived from the original on April 18, 2019. Retrieved June 11, 2019.
  137. "NBC News/Wall Street Journal Survey" (PDF). Hart Research Associates (D) and Public Opinion Strategies (R). July 22, 2018. Archived (PDF) from the original on February 11, 2019. Retrieved February 11, 2019.
  138. "Economy, Trade and Foreign Affairs". SSRS. June 21, 2018. Archived from the original on June 22, 2018. Retrieved June 22, 2018.
  139. "CNN June 2018" (PDF). SSRS. June 22, 2018. Archived (PDF) from the original on June 22, 2018. Retrieved June 22, 2018.
  140. "Support For Impeachment At Record High" (PDF). Public Policy Polling. October 31, 2017. Archived (PDF) from the original on October 31, 2017. Retrieved October 31, 2017.
  141. "2018 Shaping Up Big For Democrats" (PDF). Public Policy Polling. September 28, 2017. Archived (PDF) from the original on September 28, 2017. Retrieved September 28, 2017.
  142. "PRRI August 2017 Survey" (PDF). Archived (PDF) from the original on August 17, 2017. Retrieved August 17, 2017.
  143. "Bloomberg News National Poll". Selzer & Company. July 17, 2017. Archived from the original on July 17, 2017. Retrieved July 17, 2017.
  144. "Health Care Puts House in Play" (PDF). Public Policy Polling. May 16, 2017. Archived (PDF) from the original on May 16, 2017. Retrieved May 16, 2017.
  145. "Trump, Ryan Both Hit Record Low Approval" (PDF). Public Policy Polling. March 30, 2017. Archived (PDF) from the original on March 31, 2017. Retrieved March 30, 2017.
  146. Americans Think Trump Will Be Worst President Since Nixon (PDF). Public Policy Polling. January 26, 2017. Archived (PDF) from the original on January 26, 2017. Retrieved January 26, 2017.
  147. 1 2 3 4 5 6 7 8 "Trump's Approval Rating Slides Despite Support for Travel Ban". Morning Consult. 8 February 2017. Archived from the original on February 9, 2017. Retrieved February 9, 2017.
  148. Liptak, Adam; Flegenheimer, Matt (April 7, 2017). "Neil Gorsuch Confirmed by Senate as Supreme Court Justice". The New York Times . Archived from the original on April 29, 2019. Retrieved April 7, 2017.
  149. O'Keefe, Ed; Barnes, Robert (April 7, 2017). "Senate confirms Neil Gorsuch to Supreme Court". The Washington Post . Archived from the original on December 15, 2018. Retrieved April 7, 2017.
  150. 1 2 3 "U.S. Voter Support For Marijuana Hits New High; Quinnipiac University National Poll Finds; 76 Percent Say Their Finances Are Excellent Or Good". April 20, 2017. Archived from the original on April 20, 2017. Retrieved April 20, 2017.
  151. 1 2 3 4 "Two-Thirds Of U.S. Voters Take Climate Personally, Quinnipiac University National Poll Finds; Opposition To The Wall Hits New High". Quinnipiac University. April 5, 2017. Archived from the original on April 6, 2017. Retrieved April 5, 2017.
  152. 1 2 3 4 "Republicans Out Of Step With U.S. Voters On Key Issues, Quinnipiac University National Poll Finds; Most Voters Support Legalized Marijuana". Quinnipiac University. February 23, 2017. Archived from the original on March 3, 2017. Retrieved February 23, 2017.
  153. "Emerson College Poll: Voters Split on Trump 48% to 47%, Think Trump Admin is More Truthful than News Media. Majority Oppose DeVos for Education Secretary, But Support Other Nominees" (PDF). Emerson College Polling Society. Archived (PDF) from the original on February 11, 2017. Retrieved February 9, 2017.
  154. Diamond, Jeremy (August 26, 2017). "Trump signs directive banning transgender military recruits". CNN . Archived from the original on February 2, 2019. Retrieved February 2, 2019.
  155. "In U.S., 71% Support Transgender People Serving in Military". Gallup. June 20, 2019. Archived from the original on June 20, 2019. Retrieved June 20, 2019.
  156. "PRRI April 2019 Survey" (PDF). Public Religion Research Institute. June 25, 2019. Archived (PDF) from the original on June 25, 2019. Retrieved June 25, 2019.
  157. "National (US) Poll - January 29, 2019 - U.S. Voters Trust Pelosi More". Quinnipiac University . Archived from the original on January 29, 2019. Retrieved February 2, 2019.
  158. "CNN December 2017" (PDF). SSRS. December 22, 2017. Archived (PDF) from the original on June 14, 2018. Retrieved June 11, 2019.
  159. "PRRI August 2017 Survey" (PDF). Public Religion Research Institute. September 14, 2017. Archived (PDF) from the original on December 13, 2018. Retrieved June 11, 2019.
  160. "August 3, 2017 - U.S. Voters Say 68 - 27% Let Transgender People Serve, Quinnipiac University National Poll Finds; Voters Disapprove 5-1 Of GOP Handling Of Health Care". Quinnipiac University . Archived from the original on February 21, 2019. Retrieved February 2, 2019.
  161. 1 2 3 4 5 6 "American Voters Want Second Opinion on Obamacare, Quinnipiac University National Poll Finds; Voters Support Immigrants, but Also Back Muslim List". Quinnipiac University. Archived from the original on January 23, 2017. Retrieved January 27, 2017.
  162. 1 2 3 "21% Of U.S. Voters Approve Of Revised GOP Health Plan, Quinnipiac University National Poll Finds; Voters Reject Trump Tax Plan Almost 2-1". Quinnipiac University. May 11, 2017. Archived from the original on May 11, 2017. Retrieved May 11, 2017.
  163. "Ahead of Earth Day, most Americans pessimistic about environment's future". CBS News . April 21, 2017. Archived from the original on April 21, 2017. Retrieved April 21, 2017.
  164. 1 2 "American Voters Want To Save Big Bird, Quinnipiac University National Poll Finds; Most Oppose Spending Cuts In Trump Budget". Quinnipiac University. March 24, 2017. Archived from the original on March 24, 2017. Retrieved March 24, 2017.
  165. 1 2 3 "U.S. Voters Say Sessions Lied And Should Resign, Quinnipiac University National Poll Finds; Support For Immigrant 'path To Citizenship' At New High". Quinnipiac University. March 8, 2017. Archived from the original on March 9, 2017. Retrieved March 8, 2017.
  166. "President Trump Is Moving Forward With His Wall. Is It Really Going To Happen?". NPR. January 25, 2017. Archived from the original on January 26, 2017. Retrieved January 27, 2017.
  167. "The July 2020 AP-NORC Center Poll" (PDF). The Associated Press-NORC Center for Public Affairs Research. July 27, 2020. Archived (PDF) from the original on July 27, 2020. Retrieved July 27, 2020.
  168. "State Takes on a Purple Hue, Partisans Divided Over Coronavirus". Monmouth University Polling Institute. March 16, 2020. Archived from the original on March 16, 2020. Retrieved March 16, 2020.
  169. "Californians and Their Government - January 2020" (PDF). Public Policy Institute of California. January 15, 2020. Archived (PDF) from the original on January 16, 2020. Retrieved January 17, 2020.
  170. "Fox News Poll". Beacon Research (D) and Shaw & Company Research (R). December 19, 2019. Archived from the original on December 20, 2019. Retrieved December 20, 2019.
  171. "WISCONSIN". Beacon Research (D) and Shaw & Company Research (R). October 6, 2019. Archived from the original on October 6, 2019. Retrieved October 6, 2019.
  172. "Fox News Poll". Beacon Research (D) and Shaw & Company Research (R). June 28, 2019. Archived from the original on June 28, 2019. Retrieved June 28, 2019.
  173. "Fox News Poll". Beacon Research (D) and Shaw & Company Research (R). June 4, 2019. Archived from the original on June 5, 2019. Retrieved June 11, 2019.
  174. "Mixed Opinion on Trump's New Immigration Proposals". Monmouth University Polling Institute. April 25, 2019. Archived from the original on April 25, 2019. Retrieved April 25, 2019.
  175. "Fox News Poll". Beacon Research (D) and Shaw & Company Research (R). March 27, 2019. Archived from the original on March 27, 2019. Retrieved March 28, 2019.
  176. "Trump-Kim Summit Opinion Flat; 2-In-3 Oppose Border Wall 'Emergency'". Monmouth University Polling Institute. March 7, 2019. Archived from the original on March 7, 2019. Retrieved March 7, 2019.
  177. "U.S. Voters Oppose Trump Emergency Powers On Wall 2-1 Quinnipiac University National Poll Finds; 86% Back Democrats' Bill On Gun Background Checks". Quinnipiac University. March 6, 2019. Archived from the original on March 6, 2019. Retrieved March 6, 2019.
  178. "HPU POLL: NORTH CAROLINIANS ARE SPLIT ON SUPPORT FOR BORDER WALL". High Point University Survey Research Center. February 22, 2019. Archived from the original on February 22, 2019. Retrieved February 22, 2019.
  179. "California Dems Excited About Biden And Harris, Quinnipiac University Poll Finds; 43% Of Voters Say They Can't Afford To Live Here". Quinnipiac University. February 6, 2019. Archived from the original on February 6, 2019. Retrieved February 6, 2019.
  180. "U.S. Voters Trust Pelosi More Than Trump On Big Issues, Quinnipiac University National Poll Finds; 2-1 Support For No-Wall Border Solution". Quinnipiac University. January 29, 2019. Archived from the original on January 29, 2019. Retrieved January 29, 2019.
  181. "Did Shutdown Make Trump Look Stronger or Weaker". Monmouth University Polling Institute. January 28, 2019. Archived from the original on January 28, 2019. Retrieved January 28, 2019.
  182. "Americans' Views on Immigration Issues (Trends)". Gallup . February 4, 2019. Archived from the original on February 4, 2019. Retrieved February 4, 2019.
  183. "Washington Post-ABC News poll Jan. 21-24". Langer Research Associates and Abt Associates of Rockville, Md. January 25, 2019. Archived from the original on January 25, 2019. Retrieved January 25, 2019.
  184. "Fox News Poll". Beacon Research (D) and Shaw & Company Research (R). January 23, 2019. Archived from the original on January 23, 2019. Retrieved January 23, 2019.
  185. "JANUARY 2019 POLITICAL SURVEY" (PDF). SSRS. January 16, 2019. Archived (PDF) from the original on January 16, 2019. Retrieved January 16, 2019.
  186. "U.S. Voters Back Dem Plan To Reopen Government 2-1, Quinnipiac University National Poll Finds; More U.S. Voters Say Trump TV Address Was Misleading". Quinnipiac University. January 14, 2019. Archived from the original on January 14, 2019. Retrieved January 14, 2019.
  187. "Investor's Business Daily/TIPP Poll-January 2019" (PDF). TechnoMetrica Market Intelligence. January 17, 2019. Archived (PDF) from the original on January 17, 2019. Retrieved January 20, 2019.
  188. "CNN January 2019" (PDF). SSRS. January 13, 2019. Archived (PDF) from the original on January 13, 2019. Retrieved January 13, 2019.
  189. "Washington Post-ABC News poll Jan. 8-11, 2019". Langer Research Associates and SSRS of Glen Mills, Pa. January 13, 2019. Archived from the original on January 13, 2019. Retrieved January 13, 2019.
  190. "U.S. Voters Say No Wall And Don't Shut Down Government, Quinnipiac University National Poll Finds; Focus On Issues, Not Impeachment, Voters Tell Dems 7-1". Quinnipiac University. December 18, 2018. Archived from the original on December 18, 2018. Retrieved December 18, 2018.
  191. "CNN December 2018" (PDF). SSRS. December 13, 2018. Archived (PDF) from the original on December 13, 2018. Retrieved December 13, 2018.
  192. "Californians and Their Government - October 2018" (PDF). Public Policy Institute of California. October 24, 2018. Archived (PDF) from the original on October 25, 2018. Retrieved October 25, 2018.
  193. "Partisans View the Other Side's Rallies and Protests with Suspicion". SSRS of Glen Mills, PA. October 19, 2018.
  194. "Fox News Poll". Anderson Robbins Research (D) and Shaw & Company Research (R). September 23, 2018. Archived from the original on September 23, 2018. Retrieved September 23, 2018.
  195. "Trump Hurts GOP as Dems Hold 9-Pt Lead in House Races, Quinnipiac University National Poll Finds; U.S. Must Do More on Climate Change, Voters Say 2-1". Quinnipiac University. August 15, 2018. Archived from the original on August 15, 2018. Retrieved August 15, 2018.
  196. "Washington Post-Schar School poll - U.S. and congressional battlegrounds". July 6, 2018. Archived from the original on January 13, 2019. Retrieved January 28, 2019.
  197. "Stop Taking The Kids, 66 Percent Of U.S. Voters Say, Quinnipiac University National Poll Finds; Support For Dreamers Is 79 Percent". Quinnipiac University. June 18, 2018. Archived from the original on June 18, 2018. Retrieved June 18, 2018.
  198. Frank Newport (June 20, 2018). "Americans Oppose Border Walls, Favor Dealing With DACA". Archived from the original on June 20, 2018. Retrieved June 20, 2018.
  199. "JUNE 2018 POLITICAL SURVEY" (PDF). Pew Research Center. June 18, 2018. Archived (PDF) from the original on June 18, 2018. Retrieved June 18, 2018.
  200. "Six Months to Midterms, Challenges for Both Parties". SSRS of Glen Mills, PA. May 8, 2018. Archived from the original on July 23, 2019. Retrieved May 8, 2018.
  201. "Investor's Business Daily/TIPP Poll - May 2018" (PDF). TechnoMetrica Market Intelligence. May 10, 2018. Archived (PDF) from the original on May 10, 2018. Retrieved May 10, 2018.
  202. 1 2 "Texas Voters Say Yes To The Guard, No To The Wall, Quinnipiac University Poll Finds; Voters Back Legal Marijuana Almost 2-1". Quinnipiac University. April 19, 2018. Archived from the original on April 19, 2018. Retrieved April 19, 2018.
  203. "Trade War With China Is Bad, U.S. Voters Say 3-1, Quinnipiac University National Poll Finds; Voters Support National Guard, But Not The Wall". Quinnipiac University. April 11, 2018. Archived from the original on April 11, 2018. Retrieved April 11, 2018.
  204. "Californians and Their Government- March 2018" (PDF). Public Policy Institute of California. March 21, 2018. Archived (PDF) from the original on March 28, 2018. Retrieved March 31, 2018.
  205. "Americans Continue to Oppose a U.S.-Mexico Border Wall". SSRS of Glen Mills, PA. March 12, 2018. Archived from the original on March 23, 2018. Retrieved March 13, 2018.
  206. "Trump Trying To Derail Russia Probe, U.S. Voters Tell Quinnipiac University National Poll; Don't Shut Government Over Immigration, Voters Say 2-1". Quinnipiac University. February 6, 2018. Archived from the original on February 6, 2018. Retrieved February 6, 2018.
  207. "Public Says Let Dreamers Stay". Monmouth University Polling Institute. February 4, 2018. Archived from the original on February 5, 2018. Retrieved February 5, 2018.
  208. "Washington Post-ABC News poll Jan. 15-18, 2018". Langer Research Associates and Abt Associates of Cambridge, Mass. January 21, 2018. Archived from the original on January 24, 2018. Retrieved January 29, 2018.
  209. "CNN January 2018" (PDF). SSRS. January 19, 2018. Archived (PDF) from the original on January 19, 2018. Retrieved January 19, 2018.
  210. "Most Americans Support DACA, Oppose Border Wall". SSRS of Glen Mills, PA. January 18, 2018. Archived from the original on February 15, 2021. Retrieved January 18, 2018.
  211. "JANUARY 2018 POLITICAL SURVEY" (PDF). January 19, 2018. Archived (PDF) from the original on January 19, 2018. Retrieved January 19, 2018.
  212. "Dreamers Should Stay, American Voters Say 8-1, Quinnipiac University National Poll Finds; Do Not Enforce Federal Pot Laws, U.S. Voters Say 3-1". Quinnipiac University. January 11, 2018. Archived from the original on January 11, 2018. Retrieved January 11, 2018.
  213. "Support For GOP Tax Plan Could Hurt Candidates, Quinnipiac University National Poll Finds; U.S. Voters Say 7-1 DACA Immigrants Should Stay". December 13, 2017. Archived from the original on December 13, 2017. Retrieved December 13, 2017.
  214. "Americans Say Tax Plan Helps Wealthy, Not Middle Class". SSRS of Glen Mills, PA. December 7, 2017. Archived from the original on May 7, 2019. Retrieved December 7, 2017.
  215. "Granite Staters Oppose Wall, Favor Path to Citizenship and Border Patrol Checkpoints" (PDF). University of New Hampshire Survey Center. November 16, 2017. Archived from the original (PDF) on November 16, 2017. Retrieved November 16, 2017.
  216. "PRRI 2017 American Values Survey" (PDF). December 5, 2017. Archived (PDF) from the original on December 5, 2017. Retrieved December 5, 2017.
  217. "The September 2017 AP-NORC Center Poll" (PDF). October 10, 2017. Archived (PDF) from the original on October 10, 2017. Retrieved October 10, 2017.
  218. 1 2 "Dreamers Should Stay, U.S. Voters Say 5-1 Quinnipiac University National Poll Finds; Voters Losing Hope For Peaceful Fix In North Korea". September 28, 2017. Archived from the original on September 28, 2017. Retrieved September 28, 2017.
  219. "Sept 2017 RC Poll Politics Topline". Roanoke College. Archived from the original on September 27, 2017. Retrieved September 27, 2017.
  220. "Americans Back DACA by a Huge Margin" (PDF). Langer Research Associates. September 25, 2017. Archived (PDF) from the original on September 25, 2017. Retrieved September 25, 2017.
  221. "REL8D - Taxes, immigration, priorities" (PDF). SSRS. September 27, 2017. Archived (PDF) from the original on September 27, 2017. Retrieved September 27, 2017.
  222. "Public Takes Softer Stance on Illegal Immigration". Monmouth University. September 21, 2017. Archived from the original on September 21, 2017. Retrieved September 21, 2017.
  223. "Californians and Their Government" (PDF). September 27, 2017. Archived (PDF) from the original on September 28, 2017. Retrieved September 28, 2017.
  224. "The Economist/YouGov Poll" (PDF). September 5, 2017. Archived (PDF) from the original on September 5, 2017. Retrieved September 5, 2017.
  225. "Americans Frustrated with Congress". August 8, 2017. Archived from the original on September 20, 2017. Retrieved August 8, 2017.
  226. "Most Voters Say 'No' To Border Wall". July 31, 2017. Archived from the original on July 31, 2017. Retrieved July 31, 2017.
  227. "Fox News Poll: May 24, 2017". Fox News . May 24, 2017. Archived from the original on May 24, 2017. Retrieved May 25, 2017.
  228. "The Economist/YouGov Poll" (PDF). May 10, 2017. Archived (PDF) from the original on May 10, 2017. Retrieved May 10, 2017.
  229. "Topline Questionnaire" (PDF). Pew Research Center. September 14, 2017. Archived (PDF) from the original on September 14, 2017. Retrieved September 14, 2017.
  230. "International survey methodology". Pew Research Center. September 14, 2017. Archived from the original on September 14, 2017. Retrieved September 14, 2017.
  231. 1 2 Frank Newport (April 7, 2017). "Trump Family Leave, Infrastructure Proposals Widely Popular". Gallup. Archived from the original on April 8, 2017. Retrieved April 7, 2017.
  232. "Border wall is Trump's least popular policy internationally". Pew Research Center. July 28, 2017. Archived from the original on July 28, 2017. Retrieved July 28, 2017.
  233. 1 2 "Californians and Their Government-March 2017" (PDF). Public Policy Institute of California. Archived (PDF) from the original on March 25, 2017. Retrieved March 24, 2017.
  234. Mark Blumenthal. "Trump's Speech: Approval Uptick & Opinion Headwinds". SurveyMonkey. Archived from the original on June 12, 2017. Retrieved March 8, 2017.
  235. "Optimism on the Economy, Concern about Immigration". Scribd. February 23, 2017. Archived from the original on February 23, 2017. Retrieved February 23, 2017.
  236. "NBC News-SurveyMonkey Poll Results" (PDF). NBC News . February 22, 2017. Archived (PDF) from the original on February 22, 2017. Retrieved February 22, 2017.
  237. "February 2017 Political Survey" (PDF). Pew Research Center. February 24, 2017. Archived (PDF) from the original on February 25, 2017. Retrieved February 24, 2017.
  238. "Poll: San Diegans oppose border wall, don't expect Mexico to pay for it". The San Diego Union-Tribune . January 27, 2017. Archived from the original on January 28, 2017. Retrieved January 25, 2017.
  239. 1 2 "Morning Consult National Tracking Poll #170103 January 20-22, 2017" (PDF). Politico. Archived (PDF) from the original on January 28, 2017. Retrieved January 26, 2017.
  240. DiChristopher, Tom (January 24, 2017). "Trump signs executive actions to advance Keystone XL, Dakota Access pipelines". CNBC. Archived from the original on September 30, 2017. Retrieved September 29, 2017.
  241. "Pipelines, Paris and cross-border politics: US energy policies leave Canadians divided over how to respond" (PDF). Angus Reid Institute. March 9, 2017. Archived (PDF) from the original on March 12, 2017. Retrieved March 9, 2017.
  242. Rob Suls (February 21, 2017). "Public divided over Keystone XL, Dakota pipelines; Democrats turn decisively against Keystone". Pew Research Center. Archived from the original on February 21, 2017. Retrieved February 21, 2017.
  243. Wang, Amy (November 14, 2016). "Donald Trump plans to immediately deport 2 million to 3 million undocumented immigrants". The Washington Post . Archived from the original on January 28, 2017. Retrieved January 28, 2017.
  244. 1 2 "Voters Support Trump's Proposed Spending, Staffing Cuts". Rasmussen Reports. Archived from the original on January 25, 2017. Retrieved January 26, 2017.
  245. "Marquette Law School Poll: August 4-9, 2020" (PDF). LHK Partners, Inc. August 11, 2020. Archived (PDF) from the original on August 11, 2020. Retrieved August 11, 2020.
  246. "Trump Gets OK Grades For North Korea Summit, Quinnipiac University National Poll Finds; But Two-Thirds Of U.S. Voters Say No Nobel Prize". Quinnipiac University. June 20, 2018. Archived from the original on June 20, 2018. Retrieved June 20, 2018.
  247. "Ohio Voters Back China Tariffs, But Not A Trade War, Quinnipiac University Poll Finds; Support For Dreamers Is 4-1". Quinnipiac University. June 14, 2018. Archived from the original on June 16, 2018. Retrieved June 16, 2018.
  248. "86% Of U.S. Voters Want To Negotiate With North Korea, Quinnipiac University National Poll Finds; But Most Not Confident Trump Can Handle It". August 16, 2017. Archived from the original on August 16, 2017. Retrieved August 16, 2017.
  249. "Poll toplines" (PDF). SSRS. August 10, 2017. Archived (PDF) from the original on August 11, 2017. Retrieved August 10, 2017.
  250. "U.S. Voters Say 68 - 27% Let Transgender People Serve, Quinnipiac University National Poll Finds; Voters Disapprove 5-1 Of GOP Handling Of Health Care". August 3, 2017. Archived from the original on August 3, 2017. Retrieved August 3, 2017.
  251. "Americans' Views on Replacing the ACA" (PDF). July 19, 2017. Archived (PDF) from the original on July 19, 2017. Retrieved July 19, 2017.
  252. "U.S. Voters Reject GOP Health Plan More Than 3-1, Quinnipiac University National Poll Finds; Voters Support Gun Background Checks 94 - 5 Percent". June 28, 2017. Archived from the original on June 28, 2017. Retrieved June 28, 2017.
  253. "Merkel Challenges Trump As Leader Of Free World, Quinnipiac University National Poll Finds; Voters Oppose GOP Health Care Bill Almost 4-1". Quinnipiac University. June 8, 2017. Archived from the original on June 8, 2017. Retrieved June 8, 2017.
  254. "GOP Health Plan Backers Could Feel Pain At The Polls, Quinnipiac University National Poll Finds; Only 20 Percent Of U.S. Voters Support Plan". Quinnipiac University. May 25, 2017. Archived from the original on May 25, 2017. Retrieved May 25, 2017.
  255. "U.S. Voters Oppose GOP Health Plan 3-1, Quinnipiac University National Poll Finds; Big Opposition To Cuts To Medicaid, Planned Parenthood". Quinnipiac University. March 23, 2017. Archived from the original on March 23, 2017. Retrieved March 23, 2017.
  256. "Kaiser Health Tracking Poll: ACA, Replacement Plans, Women's Health". Kaiser Family Foundation. March 15, 2017. Archived from the original on March 16, 2017. Retrieved March 15, 2017.
  257. "Trump Badly Losing His Fights With Media" (PDF). February 24, 2017. Archived (PDF) from the original on February 24, 2017. Retrieved February 24, 2017.
  258. 1 2 "51% Back Trump's Temporary Ban On Refugees — IBD/TIPP Poll". Investor's Business Daily . February 6, 2017. Archived from the original on February 6, 2017. Retrieved February 6, 2017.
  259. "Trump suspends US refugee programme and bans Syrians indefinitely". BBC News . January 28, 2017. Archived from the original on January 27, 2017. Retrieved January 28, 2017.
  260. "Public Narrowly Agrees With Court's Decision Not To Reinstate Travel Ban" (PDF). HuffPost. May 30, 2017. Archived (PDF) from the original on February 14, 2019. Retrieved May 30, 2017.
  261. "CBS News Poll: Country Divides on Travel Ban, Record Low Approval for President Trump". Scribd. February 3, 2017. Archived from the original on February 9, 2017. Retrieved February 9, 2017.
  262. "Exclusive: Trump's travel ban polarizes America – Reuters/Ipsos poll". Reuters. January 31, 2017. Archived from the original on January 31, 2017. Retrieved January 31, 2017.
  263. "Most Support Temporary Ban ..." Rasmussen Reports. Archived from the original on February 15, 2021. Retrieved January 30, 2017.
  264. "Utahns oppose Trump's plan to curtail refugee immigration". The Salt Lake Tribune . January 26, 2017. Archived from the original on January 27, 2017. Retrieved January 27, 2017.
  265. 1 2 "50% Favor Major Cutback In U.S. Funds To UN". Rasmussen Reports. Archived from the original on February 1, 2017. Retrieved February 1, 2017.
  266. "Trump announces U.S. will exit Paris climate deal, sparking criticism at home and abroad". The Washington Post . Archived from the original on June 6, 2017. Retrieved June 6, 2017.
  267. "Nature of the Sample: NPR/PBS NewsHour/Marist Poll of 1,205 National Adults" (PDF). June 28, 2017. Archived (PDF) from the original on June 28, 2017. Retrieved June 28, 2017.
  268. "Views on the Paris Climate Agreement". The Associated Press-NORC Center for Public Affairs Research. Archived from the original on June 21, 2017. Retrieved June 21, 2017.
  269. "The Economist/YouGov Poll" (PDF). June 7, 2017. Archived (PDF) from the original on June 7, 2017. Retrieved June 7, 2017.
  270. "Trump Ties To Russia Are Illegal Or Unethical, U.S. Voters Tell Quinnipiac University National Poll; Voters Disapprove 2-1 Of Pulling Out Of Paris Accord". June 7, 2017. Archived from the original on June 7, 2017. Retrieved June 7, 2017.
  271. "Americans Oppose Climate Pact Pullout 2-1; Plurality Rejects the Economic Argument" (PDF). Archived (PDF) from the original on June 5, 2017. Retrieved June 6, 2017.
  272. "Majority of Americans Disapprove of Decision to Withdraw from Paris Agreement, PSRAI Survey Shows" (PDF). Archived from the original (PDF) on June 6, 2017. Retrieved June 6, 2017.
  273. 1 2 "Most Applaud End of TPP, Want Changes in NAFTA". Rasmussen Reports. Archived from the original on January 26, 2017. Retrieved January 27, 2017.
  274. Datta, Monti. "3 countries where Trump is popular". The Conversation . Archived from the original on 2020-10-21. Retrieved 2020-10-15.
  275. "Rating World Leaders: 2016-2017 The U.S. vs. Germany, China and Russia (page 9)". Gallup. 2018. Archived from the original on 2020-12-13. Retrieved 2020-10-14.
  276. "U.S. Image Suffers as Publics Around World Question Trump's Leadership". Pew Research Center. 26 June 2017. Archived from the original on November 1, 2017. Retrieved January 11, 2018.
  277. "Trump's International Ratings Remain Low, Especially Among Key Allies". Pew Research Center. October 1, 2018. Archived from the original on October 2, 2018. Retrieved October 3, 2018.
  278. "Trump Ratings Remain Low Around Globe, While Views of U.S. Stay Mostly Favorable". Pew Research Center. January 8, 2020. Archived from the original on January 8, 2020. Retrieved January 9, 2020.
  279. Wike, Richard; Fetterolf, Janell; Mordecai, Mara (September 15, 2020). "U.S. Image Plummets Internationally as Most Say Country Has Handled Coronavirus Badly". Pew Research . Archived from the original on December 23, 2020. Retrieved September 27, 2020.
  280. Inc, Gallup (2023-07-17). "Retrospective Approval of JFK Rises to 90%; Trump at 46%". Gallup.com. Retrieved 2023-07-17.{{cite web}}: |last= has generic name (help)