Over-the-counter data

Last updated
Diagram of OTCD components Diagram of OTCD components created by J. G. Rankin, 2012.jpg
Diagram of OTCD components

Over-the-counter data (OTCD) is a design approach used in data systems, particularly educational technology data systems, in order to increase the accuracy of users' data analyses by better reporting data. [1] The approach involves adhering to standards that are organized by five components: Label, Supplemental Documentation, Help System, Package/Display, and Content. [2]

Contents

OTCD was inspired by the varied ways over-the-counter medication supports those using its contents. [3] Just as it would be negligent for over-the-counter medication to contain no labeling, documentation, or other supports helping people to use its contents safely, it is deemed negligent for data systems to display data for educators without providing them with the necessary supports to best ensure it is used correctly when educators use the data to treat students’ needs.

Background

Inspired by the varied ways over-the-counter medication supports those using its contents, OTCD was created in 2010 and applied to the improvement of education data systems. [4] Consider the way in which the Food and Drug Administration (FDA) requires over-the-counter medication to be accompanied by textual guidance proven to improve its use, deeming it negligent to do otherwise. [5] With such guidance, patients may take over-the-counter medication with the goal of improving wellbeing while a doctor is not present to explain how to use the medication. No or poor medication labels have resulted in many errors and tragedy, as people are left with no way to know how to use the contents wisely. [6]

Labeling conventions can translate to improved understanding on non-medication products, as well. [7] [8] Thus, in the way over-the-counter medicine’s proper use is communicated with a thorough label and added documentation, a data system used to analyze student performance can include components to help users better comprehend the data it contains. [9] Using an OTCD approach (i.e., following OTCD Standards) when communicating data involves following research-based recommendations likely to improve educators’ understanding, analysis, and use of the data being displayed. [10]

OTCD ComponentAppearance in Over-the-Counter MedicationAppearance in Data Systems & Their Reports
LabelThe container label provides the name and info to questions like, "How many should I take?" and "What are the possible side effects?", etc.The report has a clear and concise title, and included in the footer or side are annotations that provide info most relevant and important to the report.
Supplemental DocumentationNot all the info a user needs to know can fit on the label, so a folded-up piece of paper is enclosed within the package to offer further explanation.Similarly, explanatory info can accompany each report via links to a reference sheet and reference guide specific to each report.
Help SystemUsers want an online help system to explore and discuss specific questions (50 million people use WebMD every year [11] ).An online help system can offer comprehensive lessons on using the system and on data analysis (specific to the data).
Package/DisplayHow the product is displayed and packaged helps communicate by clearly identifying the most important info, such as purpose and use.How data is organized and displayed, such as layout that encourages correct analyses for each particular report, helps to avoid confusion.
ContentThe ingredients of the product are vital; they have to be effective, user-appropriate, and not expired.The contents of each report and the report suite as a whole are effective, audience-appropriate and not expired.

Nonetheless, labeling and tools within data systems to assist analyses are uncommon, even though most educators analyze data alone. [12] Essentially, data systems and reports do not commonly present data in an “over-the-counter” format for educators, whose primary option for using data to treat students is thus compared to ingesting medicine from an unmarked or marginally marked container. Just as it would be negligent for over-the-counter medicine to contain no labeling, documentation, or other supports helping people to use its contents safely, it is negligent for data systems and reports to display data for educators without providing necessary supports to best ensure the data is used appropriately and thus has a desirable impact on students. [13]

The recommendations summarized by OTCD Standards (below) are based on research in education and edtech, as well as research in a variety of other fields (e.g., behavioral economics, design, business analytics, technology, and more). An OTCD approach is not meant to replace educators’ professional development or other interventions that improve data use, but it is an added solution that doesn’t cost educators more time, money, or stress. [13]

Significance

Educators have widely accepted the importance of using data to inform their treatment of students’ needs. [14] [15] This is a good thing, as research touts the benefits of effective data use.[ improper synthesis? ] [16] [17] [18] [19] Unfortunately, educators’ widespread data use is not always a good thing. A significant portion – and some research claims most – of educators analyzing and using data are doing so incorrectly.[ improper synthesis? ] [18] [20] [21] [22] [23] [24] For example in two U.S. Department of Education studies conducted in districts known for strong data use, teachers achieved only 48% accuracy when making data inferences involving basic statistical concepts. [12] [25] Thus educators are using data to inform decisions, but they do not always understand the data they are using. Since their data-misinformed decisions impact the students such decisions are meant to impact, this is a significant problem. Edtech products that present data to educators in an over-the-counter format – as opposed to simply “showing the data” and requiring educators to dig up resources to aid analyses – play an active role in improving educators’ data use.

Over-the-Counter Data Study

Infographic of OTCD study by Jenny Grant Rankin Infographic of OTCD study created by J. G. Rankin, 2013.jpg
Infographic of OTCD study by Jenny Grant Rankin

Though numerous studies over the years have produced evidence on which the OTCD standards are based, one quantitative study in 2013 focused specifically on OTCD’s direct impact on data analysis accuracy (as opposed to merely determining which edtech aspects educators prefer). 211 educators of varied backgrounds at nine schools in six different California school districts participated in the Over-the-Counter Data’s Impact on Educators’ Data Analysis Accuracy study. [13] The study’s premise was to determine the precise impact on analysis accuracy when data system reporting environments made data “over-the-counter,” giving educators embedded supports like the kind over-the-counter medication provides for users in the form of labeling and supplemental documentation. Key findings were significant and hold implications for educators, educational technology and/or data system vendors, and anyone else involved in communicating data to educators: [26]

Relating to primary research questions

Relating to Secondary Research Questions

Over-the-Counter Data (OTCD) Standards

OTCD Standards involve embedding data analysis supports directly within reporting environments and adhering to best practices concerning design. [27] OTCD Standards were designed to be used by anyone communicating data to educators and to be reflected in the tool(s) through which the data is communicated (e.g., data report, data system, or other edtech product with a data component). Their purpose is to foster optimal educator (“user”) understanding, analysis, and use of the data being provided.

Mentions of OTCD

Organizations’ and publications’ mentions of OTCD include:

Related Research Articles

Statistical bias, in the mathematical field of statistics, is a systematic tendency in which the methods used to gather data and generate statistics present an inaccurate, skewed or biased depiction of reality. Statistical bias exists in numerous stages of the data collection and analysis process, including: the source of the data, the methods used to collect the data, the estimator chosen, and the methods used to analyze the data. Data analysts can take various measures at each stage of the process to reduce the impact of statistical bias in their work. Understanding the source of statistical bias can help to assess whether the observed results are close to actuality. Issues of statistical bias has been argued to be closely linked to issues of statistical validity.

<span class="mw-page-title-main">Analytics</span> Discovery, interpretation, and communication of meaningful patterns in data

Analytics is the systematic computational analysis of data or statistics. It is used for the discovery, interpretation, and communication of meaningful patterns in data. It also entails applying data patterns toward effective decision-making. It can be valuable in areas rich with recorded information; analytics relies on the simultaneous application of statistics, computer programming, and operations research to quantify performance.

Educational technology is the combined use of computer hardware, software, and educational theory and practice to facilitate learning. When referred to with its abbreviation, "EdTech," it often refers to the industry of companies that create educational technology. In EdTech Inc.: Selling, Automating and Globalizing Higher Education in the Digital Age, Tanner Mirrlees and Shahid Alvi (2019) argue "EdTech is no exception to industry ownership and market rules" and "define the EdTech industries as all the privately owned companies currently involved in the financing, production and distribution of commercial hardware, software, cultural goods, services and platforms for the educational market with the goal of turning a profit. Many of these companies are US-based and rapidly expanding into educational markets across North America, and increasingly growing all over the world."

<span class="mw-page-title-main">Education Resources Information Center</span> US Department of Education online repository

The Education Resources Information Center (ERIC) is an online digital library of education research and information. ERIC is sponsored by the Institute of Education Sciences of the United States Department of Education.

<span class="mw-page-title-main">Data analysis</span> The process of analyzing data to discover useful information and support decision-making

Data analysis is the process of inspecting, cleansing, transforming, and modeling data with the goal of discovering useful information, informing conclusions, and supporting decision-making. Data analysis has multiple facets and approaches, encompassing diverse techniques under a variety of names, and is used in different business, science, and social science domains. In today's business world, data analysis plays a role in making decisions more scientific and helping businesses operate more effectively.

The Joint Committee on Standards for Educational Evaluation is an American/Canadian based Standards Developer Organization (SDO). The Joint Committee, created in 1975, represents a coalition of major professional associations formed in 1975 to develop evaluation standards and improve the quality of standardized evaluation. The Committee has thus far published three sets of standards for evaluations. The Personnel Evaluation Standards was published in 1988 and updated in 2008, The Program Evaluation Standards was published in 1994, and The Student Evaluation Standards was published in 2003.

The American Institute of Biological Sciences (AIBS) is a nonprofit scientific public charitable organization. The organization's mission is to promote the use of science to inform decision-making and advance biology for the benefit of science and society.

Audience response is a type of interaction associated with the use of audience response systems, to create interactivity between a presenter and its audience.

Data system is a term used to refer to an organized collection of symbols and processes that may be used to operate on such symbols. Any organised collection of symbols and symbol-manipulating operations can be considered a data system. Hence, human-speech analysed at the level of phonemes can be considered a data system as can the Incan artefact of the khipu and an image stored as pixels. A data system is defined in terms of some data model and bears a resemblance to the idea of a physical symbol system.

Peer assessment, or self-assessment, is a process whereby students or their peers grade assignments or tests based on a teacher's benchmarks. The practice is employed to save teachers time and improve students' understanding of course materials as well as improve their metacognitive skills. Rubrics are often used in conjunction with self- and peer-assessment.

<span class="mw-page-title-main">Evidence-based education</span> Paradigm of the education field

Evidence-based education (EBE) is the principle that education practices should be based on the best available scientific evidence, with randomised trials as the gold standard of evidence, rather than tradition, personal judgement, or other influences. Evidence-based education is related to evidence-based teaching, evidence-based learning, and school effectiveness research.

Pharmacy automation involves the mechanical processes of handling and distributing medications. Any pharmacy task may be involved, including counting small objects ; measuring and mixing powders and liquids for compounding; tracking and updating customer information in databases ; and inventory management. This article focuses on the changes that have taken place in the local, or community pharmacy since the 1960s.

Learning analytics is the measurement, collection, analysis and reporting of data about learners and their contexts, for purposes of understanding and optimizing learning and the environments in which it occurs. The growth of online learning since the 1990s, particularly in higher education, has contributed to the advancement of Learning Analytics as student data can be captured and made available for analysis. When learners use an LMS, social media, or similar online tools, their clicks, navigation patterns, time on task, social networks, information flow, and concept development through discussions can be tracked. The rapid development of massive open online courses (MOOCs) offers additional data for researchers to evaluate teaching and learning in online environments.

Educational data mining (EDM) is a research field concerned with the application of data mining, machine learning and statistics to information generated from educational settings. At a high level, the field seeks to develop and improve methods for exploring this data, which often has multiple levels of meaningful hierarchy, in order to discover new insights about how people learn in the context of such settings. In doing so, EDM has contributed to theories of learning investigated by researchers in educational psychology and the learning sciences. The field is closely tied to that of learning analytics, and the two have been compared and contrasted.

Rexer Analytics’s Annual Data Miner Survey is the largest survey of data mining, data science, and analytics professionals in the industry. It consists of approximately 50 multiple choice and open-ended questions that cover seven general areas of data mining science and practice: (1) Field and goals, (2) Algorithms, (3) Models, (4) Tools, (5) Technology, (6) Challenges, and (7) Future. It is conducted as a service to the data mining community, and the results are usually announced at the PAW conferences and shared via freely available summary reports. In the 2013 survey, 1259 data miners from 75 countries participated. After 2011, Rexer Analytics moved to a biannual schedule.

Barcode technology in healthcare is the use of optical machine-readable representation of data in a hospital or healthcare setting.

Data-informed decision-making (DIDM) gives reference to the collection and analysis of data to guide decisions that improve success. Another form of this process is referred to as data-driven decision-making, "which is defined similarly as making decisions based on hard data as opposed to intuition, observation, or guesswork." DIDM is used in education communities and is also used in other fields in which data is used to inform decisions. While "data based decision-making" is a more common term, "data-informed decision-making" is the preferred term, since decisions should not be based solely on quantitative data. Data-driven decision-making is commonly used in the context of business growth and entrepreneurship. Many educators have access to data system for analyzing student data. These data systems present data to educators in an over-the-counter data format to improve the success of educators' data-informed decision-making. In business, fostering and actively supporting data-driven decision-making in their firm and among their colleagues may be one of the central responsibilities of CIOs or CDOs.

<span class="mw-page-title-main">Merative</span> U.S. healthcare company

Merative L.P., formerly IBM Watson Health, is an American medical technology company that provides products and services that help clients facilitate medical research, clinical research, real world evidence, and healthcare services, through the use of artificial intelligence, data analytics, cloud computing, and other advanced information technology. Merative is owned by Francisco Partners, an American private equity firm headquartered in San Francisco, California. In 2022, IBM divested and spun-off their Watson Health division into Merative. As of 2023, it remains a standalone company headquartered in Ann Arbor with innovation centers in Hyderabad, Bengaluru, and Chennai.

<span class="mw-page-title-main">Learning engineering</span> Interdisciplinary academic field

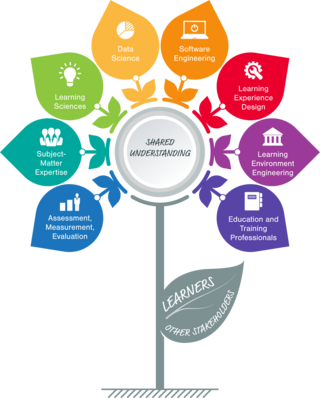
Learning Engineering is the systematic application of evidence-based principles and methods from educational technology and the learning sciences to create engaging and effective learning experiences, support the difficulties and challenges of learners as they learn, and come to better understand learners and learning. It emphasizes the use of a human-centered design approach in conjunction with analyses of rich data sets to iteratively develop and improve those designs to address specific learning needs, opportunities, and problems, often with the help of technology. Working with subject-matter and other experts, the Learning Engineer deftly combines knowledge, tools, and techniques from a variety of technical, pedagogical, empirical, and design-based disciplines to create effective and engaging learning experiences and environments and to evaluate the resulting outcomes. While doing so, the Learning Engineer strives to generate processes and theories that afford generalization of best practices, along with new tools and infrastructures that empower others to create their own learning designs based on those best practices.

Jenny Grant Rankin is an American educational researcher and author. She is known for her work in improving data presentation, parenting, and career development. She received an Honorary Doctor of Humane Letters from University of La Verne in 2019.

References

  1. Rankin, J. G. (2013, June 3). Featured article: What data reporting systems can learn from medicine labeling. EdSurge. Retrieved from https://www.edsurge.com/n/2013-06-03-opinion-what-data-reporting-systems-can-learn-from-medicine-labeling
  2. Rankin, J. (2013, October 24). Remedying educators’ data analysis errors with over-the-counter data. California Council on Teacher Education (CCTE) Conference. Poster presentation conducted from Kona Kai Resort, San Diego, CA.
  3. Rankin, J. G. (2013, May 2). Over-the-counter data is the next frontier for data in edtech. Edukwest. Retrieved from http://www.edukwest.com/over-the-counter-data-is-the-next-frontier-for-data-in-edtech/
  4. Rankin, J. (2011, December 1). Data analysis doesn’t have to be so hard. Ninetieth Annual California Educational Research Association (CERA) Conference Presentation conducted from Disney Convention Center, Anaheim, CA.
  5. Dewalt, Darren A. (2010). "Ensuring Safe and Effective Use of Medication and Health Care". JAMA. 304 (23): 2641–2642. doi:10.1001/jama.2010.1844. PMID   21119075.
  6. Brown‐Brumfield, Diana; Deleon, Agripina (2010). "Adherence to a Medication Safety Protocol: Current Practice for Labeling Medications and Solutions on the Sterile Field". AORN Journal. 91 (5): 610–617. doi:10.1016/j.aorn.2010.03.002. PMID   20451003.
  7. Hampton, Tracy (2007). "Groups Urge Warning Label for Medical Devices Containing Toxic Chemical". JAMA. 298 (11): 1263. doi:10.1001/jama.298.11.1267. PMID   17878415.
  8. Qin, Yu; Wu, Ming; Pan, Xiaoqun; Xiang, Quanyong; Huang, Jianping; Gu, Zenghui; Shi, Zumin; Zhou, Minghao (2011). "Reactions of Chinese adults to warning labels on cigarette packages: A survey in Jiangsu Province". BMC Public Health. 11: 133. doi: 10.1186/1471-2458-11-133 . PMC   3053246 . PMID   21349205.
  9. Rankin, J. G. (2013, October 25). Pushing edtech’s responsibility to communicate feedback effectively. Edtech Women. Retrieved from http://edtechwomen.com/blog/2013/10/25/pushing-edtechs-responsibility-to-communicate-feedback-effectively
  10. Rankin, J. (2013, May 7). Over-the-counter data: Improved analysis accuracy. Connect 2013: Canada’s Learning & Technology Conference. Presentation conducted from Scotiabank Convention Centre, Niagara Falls, Ontario, Canada.
  11. Kronstadt, Jessica; Moiduddin, Adil; Sellheim, Will (March 2009). "Consumer Use of Computerized Applications to Address Health and Health Care Needs" (PDF).[ page needed ]
  12. 1 2 Means, Barbara; Padilla, Christine; DeBarger, Angela; Bakia, Marianne (2009). Implementing Data-Informed Decision Making in Schools: Teacher Access, Supports and Use. US Department of Education. ERIC   ED504191.[ page needed ]
  13. 1 2 3 Rankin, Jenny Grant (2013). Over-the-Counter Data's Impact on Educators' Data Analysis Accuracy (Thesis). ProQuest   1459258514.[ page needed ]
  14. Van der Meij, H (2008). "Designing for user cognition and affect in a manual. Should there be special support for the latter?". Learning & Instruction. 18 (1): 18–29.
  15. Hattie, John (2009). "Visibly learning from reports: The validity of score reports" (PDF).
  16. Wohlstetter, Priscilla; Datnow, Amanda; Park, Vicki (2008). "Creating a system for data-driven decision-making: Applying the principal-agent framework". School Effectiveness and School Improvement. 19 (3): 239–259. doi:10.1080/09243450802246376. S2CID   41201175.
  17. Lewis, D; Madison-Harris, R; Muoneke, A; Times, C (2010). "Using data to guide instruction and improve student learning". SEDL Letter. 22 (2): 10–12.
  18. 1 2 "Best Practices in Information Management, Reporting and Analytics for Education" (PDF). SAS.
  19. Stansbury, M. (2013, July). Nine templates to help educators leverage school data: New industry collaborative says using data effectively can help close education gaps. eSchool News. Retrieved from http://www.eschoolnews.com/2013/01/07/nine-templates-to-help-educators-leverage-school-data/?ast=104&astc=9990
  20. Data Quality Campaign (2009). The next step: Using longitudinal data systems to improve student success. Retrieved from http://www.dataqualitycampaign.org/find-resources/the-next-step/
  21. Wayman, J. C., Cho, V., & Shaw, S. M. (2009, December). First-year results from an efficacy study of the Acuity data system. Paper presented at the Twenty-fourth Annual Texas Assessment Conference, Austin, TX.
  22. Underwood, Jody S.; Zapata-Rivera, Diego; Vanwinkle, Waverely (2010). "An Evidence-Centered Approach to Using Assessment Data for Policymakers". Ets Research Report Series. 2010: i-26. doi:10.1002/j.2333-8504.2010.tb02210.x.
  23. Wayman, Jeffrey C.; Snodgrass Rangel, Virginia W.; Jimerson, Jo Beth; Cho, Vincent (February 2010). "Improving Data Use in NISD: Becoming a Data-Informed District" (PDF).[ page needed ][ self-published source? ]
  24. VanWinkle, W., Vezzu, M., & Zapata-Rivera, D. (2011). Question-based reports for policymakers (ETS Research Memorandum No. RM-11-16). Princeton, NJ: ETS.
  25. Means, Barbara; Chen, Eva; DeBarger, Angela; Padilla, Christine (2011). Teachers' Ability to Use Data to Inform Instruction: Challenges and Supports. Office of Planning, Evaluation and Policy Development, US Department of Education. ERIC   ED516494.[ page needed ]
  26. Hansen, L., & Johnson, M. (2013, July 24) Data-Informed Decision Making: It Takes a City. Learning Forward (formerly National Staff Development Council) 2013 Summer Conference. Presentation conducted from Minneapolis Hilton, Minneapolis, MN
  27. Rankin, J. (2013, March 28). How data systems & reports can either fight or propagate the data analysis error epidemic. 2013 Technology Information Center for Administrative Leadership (TICAL) School Leadership Summit. Retrieved from http://admin20.org/forum/topics/how-data-systems-reports-can-either-fight-or-propagate-the-data