People counter

Last updated

A people counter is an electronic device that is used to measure the number of people traversing a certain passage or entrance. Examples include simple manual clickers, smart-flooring technologies, infrared beams, thermal imaging systems, WiFi trackers and video counters using advanced machine learning algorithms. They are commonly used by retail establishments to judge the effectiveness of marketing campaigns, building design and layout, and the popularity of particular brands.

Contents

Industries

Retail stores

A people counter
installed indoor at the entrance of Watsons in Turkey People counter retail store.jpg
A people counter installed indoor at the entrance of Watsons in Turkey

People counting systems in the retail environment are used to calculate the conversion rate, which is the percentage of total visitors versus the number that make purchases.

Shopping mall marketing professionals rely on visitor statistics to measure the effectiveness of the current marketing campaign. Often, shopping mall owners measure marketing effectiveness with the same conversion rate as retail stores. [1]

Retailers can use the different business metrics in order to determine their staffing allocation. Accurate visitor counting is also useful for optimizing staff shifts. Staff requirements are often directly related to the density of visitor traffic, and services such as cleaning and maintenance are typically undertaken when traffic is at its lowest. [2]

Shopping malls

Shopping centers use people counters to measure the number of visitors in a given area. People counters also assist in measuring the areas where people tend to congregate. The areas where people tend to gather are often charged higher rent. [3]

Shopping malls prefer to lease space to only the most popular brands. People counters help shopping malls discover popularity by determining footfall patterns and traffic. Shopping mall owners are able to determine the flow of traffic per customer, and which areas and the levels of use of the different mall entrances. [4]

Public transportation

Combining with GPS positioning, people counting system inside a bus or train can help to measure the occupancy of buses throughout their journey. This can help the bus operator to allocate funding and resources to routes. [5]

Business metrics

People counters are used to measure different business metrics. While there are many different types of people counters and each model varies in the metrics supported, most people counters will offer some or all of the following metrics.

Sample footfall report that reports visitor count in a particular day Sample Footfall Report.png
Sample footfall report that reports visitor count in a particular day

Footfall

Footfall measures the number of people who enter a shop or business in a particular period of time. [6] When analysing trends, the footfall is often averaged over periods such as days or weeks. [7] [8] [9]

Turn-in rate

The turn-in rate is the percentage of shoppers who enter a store compared to the number of people who walk by it. With WiFi counting, shops can estimate the number of people who walk past a store. However, a more accurate method is video counting. The number of people who walk past a store often reflects the potential of the store location, while the window conversion rate depends on factors such as the attractiveness of the shop window design and the effectiveness of marketing campaigns. [10]

Visit duration

Visit duration is the amount of time visitors stay in a venue. Through WiFi counting, owners can track the time a person carrying a smartphone entered and left the venue. [11]

Bubble map/heat map

This metric tracks the user engagement per districts, sections, and courts of a compound. The bubble map or heat map allows users to analyze the number of engagement in percentage across the entire compound at a period of time. Bubble maps and heat maps function similarly, the only difference being the methodology of display. A heat map shows the engagement level through the use of colors, with warmer colors showing more engagement, whereas a bubble map shows engagement in terms of percentile and circumference of the bubble drawn.

Zone counting/traffic flow

This metric, similar to the bubble map and heat map, allows the user to see the flow of traffic in the levels of engagement. With the traffic flow diagram, the mall owner is able to determine what is the most popular district of the mall, and may choose to lease their rental areas based on demand. [12]

Sample image of the bubble map used in people counters Sample Bubble Map.png
Sample image of the bubble map used in people counters

Outside traffic

Measuring outside traffic allows retailers to determine the number of people passing by the retail store on any given day and to estimate how many potential customers a location will be able to bring to the business. [13]

Returning customers

This metric looks at the number of people entering a store who had visited the store previously by tracking the unique WiFi signal ID transmitted by a smartphone. [14]

Current technology

Many different technologies are used in people counting devices, such as smart-flooring technologies, infrared beams, thermal imaging, computer vision, and WiFi counting. [15] The current fourth generation of people counter utilize stereoscopic imaging to overcome the limitations imposed by previous generations such as shadow issues, high traffic counting, and disruption of patterns on the floor.

Video counting

People counter seamlessly installed in a retail store People Counter Installed in a Retail Store.jpg
People counter seamlessly installed in a retail store

Computer vision works via an embedded device, reducing the network bandwidth usage, as only the number of people must be sent over the network. Adaptive algorithms have been developed to provide accurate counting for both outdoor and indoor locations. Multi-layer background subtraction, based on color and texture, is considered the most robust algorithm [16] available for varying shadows and lighting conditions. [17] With the advances in image processing, video counting can achieve 98% accuracy in some lighting environments. [18] The use of artificial intelligence and pattern recognition functions is expected to further enhance its accuracy. [19]

WiFi counting

WiFi counting uses a WiFi receiver to pick up unique WiFi management frames emitted from smartphones within range. [20] While not all people carry a smartphone, WiFi counting can produce statistically significant metrics with a large enough sample size. Modern mobile operating systems, such as Apple's iOS9 and Android 6.0 Marshmallow, use MAC rotation schemes which makes WiFi counting more challenging without using sophisticated algorithms. [21] [22]

Video is saved to review the accuracy of the system.

Video verification

The 4th generation of people counters includes an option for users to review the authenticity and integrity of the data provided by their people counter. The user will be able to verify the accuracy of the counter and make business decisions accordingly, factoring in all the disparity of data.

Seamless integration with store environment

People counters are designed to integrate with the store environment in order to minimize obstruction and disruption of the store environment. Furthermore, since people counters may be easily mistaken for surveillance cameras shoppers may feel uneasy and distracted if they are not properly designed and installed. If the people counter is not properly hidden or seamlessly integrated to the environment, the purchasing behavior of consumers will be affected if they are misled to believe that they are under surveillance. [23]

Additional Features

Fourth-generation people counters build on previous technology to include:

  1. Ability to be used in low/varying light conditions based on fusion of light receivers from multiple sources of varying intensities. [24]
  2. Features to comply with local laws that prohibit the use of CCTV in some malls while retaining the ability to obtain useful metrics from video counting. [25]
  3. Staff exclusion with the help of AI based counting
  4. mmWave / Radar based people counting system.

History

Predecessors to electronic people counters

Before the advent of electronic people counters manual people counters were used. These required a store employee to stand near the entrance of the store and click on a counting device each time a person entered the store. This was considered to be inaccurate due to the high level of human error, as well as being an inefficient usage of human resource. Pressure sensitive sensors that count walk-ins based on the number of footsteps on a pressure sensitive platform or mat were used as well.

1st generation: Infrared beam counters (2002-2004)

The simplest form of counter in which a single, horizontal infrared beam across an entrance counts when a person or object passes and breaks its beam First Generation Infrared Beam Counter.jpg
The simplest form of counter in which a single, horizontal infrared beam across an entrance counts when a person or object passes and breaks its beam

The first UK beam counters were installed by Business Blueprints in 1988 at Meadowhall centre, outside Sheffield, South Yorkshire, England. They covered all 14 entrances and recorded footfall of 20 million shoppers per annum. Daily manual checks were made to recalibrate each beam counter, leading to an error rate of +\-3%[ citation needed ], significantly more accurate than later video systems.

The simplest form of counter is a single, horizontal infrared beam across an entrance which is typically linked to a small LCD display unit at the side of the doorway. When the beam is broken a tick is 'recorded'. Since a person normally enters and leaves by the same door, dividing the 'ticks' by two gives a measure of visitor numbers. Beam counters usually require a receiver or a reflector mounted opposite the unit with a typical range from 2.5 metres (8 ft 2 in) to 6 metres (20 ft). Despite the limitations, infrared counters are still widely used due to their low cost and simplicity of installation. [26] The first generation of people counter had an expected accuracy level of 60% to 80%[ citation needed ].

2nd generation: Thermal counters (2005-2011)

Thermal imaging systems use array sensors which detect heat sources from human body. Second Generation Thermal Counter.png
Thermal imaging systems use array sensors which detect heat sources from human body.

Thermal imaging systems use array sensors that detect heat sources. These systems are typically implemented using embedded technology and are mounted overhead. It is difficult to verify the accuracy of thermal counters as the image feed relay on the devices are heat sources. They can be inaccurate as thermal counters have difficulty measuring the dwell time of targets beyond a few seconds. Due to this, the second generation of people counter have an average accuracy of 80% to 85%.

3rd generation: Video and WiFi counting (2012-2016)

There are two types of 3rd-generation people counters. Video counters use complex algorithms and camera imaging to count the number of people directly from a video tape. WiFi counting functionality collects WiFi probe request signals from shoppers' smartphones, including outside the store. This adds a number of important metrics for businesses, especially for the retail industry, such as the ability to determine how effective a window marketing campaign is. With video counting technology, the expected accuracy rate of the device is 80% to 95%.

See also

Related Research Articles

<span class="mw-page-title-main">Toronto Eaton Centre</span> Shopping mall and office complex in Toronto, Ontario, Canada

The Toronto Eaton Centre is a shopping mall and office complex in the downtown core of Toronto, Ontario, Canada. It is owned and managed by Cadillac Fairview (CF). It was named after the Eaton's department store chain that once anchored it before the chain went defunct in the late 1990s.

<span class="mw-page-title-main">Pedometer</span> Portable device that counts steps a person takes

A pedometer, or step-counter, is a device, usually portable and electronic or electromechanical, that counts each step a person takes by detecting the motion of the person's hands or hips. Because the distance of each person's step varies, an informal calibration, performed by the user, is required if presentation of the distance covered in a unit of length is desired, though there are now pedometers that use electronics and software to determine how a person's step varies automatically. Distance traveled can be measured directly by a GPS receiver.

<span class="mw-page-title-main">Fox River Mall</span> Large regional mall in Grand Chute, Wisconsin

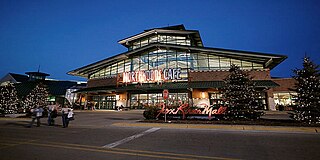
Fox River Mall is an enclosed super-regional shopping center located in Grand Chute, Wisconsin, United States, which serves the Appleton, Wisconsin metropolitan area. It is a major driver of the local economy and its construction helped spur the growth of the Grand Chute shopping district, which is today known as the "shopping capital of Wisconsin". At 1.21 million square feet, it is one of the largest malls in the state.

<span class="mw-page-title-main">Wi-Fi hotspot</span> Wi-Fi access point

A hotspot is a physical location where people can obtain Internet access, typically using Wi-Fi technology, via a wireless local-area network (WLAN) using a router connected to an Internet service provider.

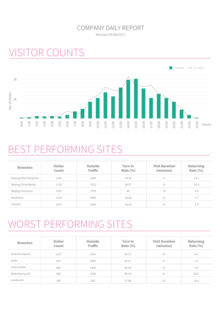
Web analytics is the measurement, collection, analysis, and reporting of web data to understand and optimize web usage. Web analytics is not just a process for measuring web traffic but can be used as a tool for business and market research and assess and improve website effectiveness. Web analytics applications can also help companies measure the results of traditional print or broadcast advertising campaigns. It can be used to estimate how traffic to a website changes after launching a new advertising campaign. Web analytics provides information about the number of visitors to a website and the number of page views, or create user behavior profiles. It helps gauge traffic and popularity trends, which is useful for market research.

<span class="mw-page-title-main">Digital signage</span> Sub-segment of electronic signage

Digital signage is a segment of electronic signage. Digital displays use technologies such as LCD, LED, projection and e-paper to display digital images, video, web pages, weather data, restaurant menus, or text. They can be found in public spaces, transportation systems, museums, stadiums, retail stores, hotels, restaurants and corporate buildings etc., to provide wayfinding, exhibitions, marketing and outdoor advertising. They are used as a network of electronic displays that are centrally managed and individually addressable for the display of text, animated or video messages for advertising, information, entertainment and merchandising to targeted audiences.

Website popularity is commonly determined using the number of unique users, and the metric is often quoted to potential advertisers or investors. A website's number of unique users is usually measured over a standard period of time, typically a month. "Unique" is a term of art in this context that means distinct and does not count repeat visits or uses by the same person.

Proximity marketing is the localized wireless distribution of advertising content associated with a particular place. Transmissions can be received by individuals in that location who wish to receive them and have the necessary equipment to do so.

Google Store is a hardware retail store operated by Google that sells Google Pixel devices, Google Nest products, Chromecast dongles, Fitbit devices, and accessories such as earbuds, phone cases, chargers, and keyboards. It also sold Nexus, Daydream, Stadia and Cardboard devices until their discontinuations. Google Store sells products made by Google or made in collaboration with that company. It was introduced on March 11, 2015, and replaced the Devices section of Google Play as Google's hardware retailer. It is overseen by Ana Corrales, who is also the COO of Google's Devices & Services division.

Bounce rate is an Internet marketing term used in web traffic analysis. It represents the percentage of visitors who enter the site and then leave ("bounce") rather than continuing to view other pages within the same site. Bounce rate is calculated by counting the number of single page visits and dividing that by the total visits. It is then represented as a percentage of total visits.

<span class="mw-page-title-main">Indoor positioning system</span> Network of devices used to wirelessly locate objects inside a building

An indoor positioning system (IPS) is a network of devices used to locate people or objects where GPS and other satellite technologies lack precision or fail entirely, such as inside multistory buildings, airports, alleys, parking garages, and underground locations.

Mobile web analytics studies the behaviour of mobile website users in a similar way to traditional web analytics. In a commercial context, mobile web analytics refers to the data collected from the users who access a website from a mobile phone. It helps to determine which aspects of the website work best for mobile traffic and which mobile marketing campaigns work best for the business, including mobile advertising, mobile search marketing, text campaigns, and desktop promotion of mobile sites and services.

<span class="mw-page-title-main">Traffic count</span> Determination of the number of vehicles

A traffic count is a count of vehicular or pedestrian traffic, which is conducted along a particular road, path, or intersection. A traffic count is commonly undertaken either automatically, or manually by observers who visually count and record traffic on a hand-held electronic device or tally sheet. Traffic counts can be used by local councils to identify which routes are used most, and to either improve that road or provide an alternative if there is an excessive amount of traffic. Also, some geography fieldwork involves a traffic count. Traffic counts provide the source data used to calculate the Annual Average Daily Traffic (AADT), which is the common indicator used to represent traffic volume. Traffic counts are useful for comparing two or more roads, and can also be used alongside other methods to find out where the central business district (CBD) of a settlement is located. Traffic counts that include speeds are used in speed limit enforcement efforts, highlighting peak speeding periods to optimise speed camera use and educational efforts.

<span class="mw-page-title-main">The Core (shopping centre)</span> Shopping mall in Calgary, Alberta, Canada

The Core, which consists of TD Square, the Holt Renfrew building, the Simons building, the Stephen Avenue Place shops, Scotia Centre, and the former Calgary Eaton Centre, is the dominant shopping complex located in the downtown core of Calgary, Alberta, Canada. It spans three city blocks and contains approximately 160 retailers on four levels. The property also contains six major office towers (TD Canada Trust Tower, Home Oil Tower, Dome Tower, and the historic Lancaster Building. It is the hub of downtown Calgary's +15 skywalk system, and as such is the busiest shopping centre in the city by pedestrian count, with around 250,000 visitors passing through each week. The centre's architectural focal point is a vast suspended glass skylight which spans the length of the complex. As of October 29, 2010, The Core offers free evening and weekend parking at its underground lots.

In marketing, abandonment rate is a term associated with the use of virtual shopping carts. Also known as "shopping cart abandonment". Although shoppers in brick and mortar stores rarely abandon their carts, abandonment of virtual shopping carts is quite common. Marketers can count how many of the shopping carts used in a specified period result in completed sales versus how many are abandoned. The abandonment rate is the ratio of the number of abandoned shopping carts to the number of initiated transactions or to the number of completed transactions.

Mobile location analytics (MLA) is a type of customer intelligence and refers to technology for retailers, including developing aggregate reports used to reduce waiting times at checkouts, improving store layouts, and understanding consumer shopping patterns. The reports are generated by recognizing the Wi-Fi or Bluetooth addresses of cell phones as they interact with store networks.

<span class="mw-page-title-main">Beaugrenelle shopping mall</span> Shopping mall in Paris

Beaugrenelle is a shopping mall located in the 15th arrondissement of Paris, close to the Seine and 10 minutes' walk from the Eiffel Tower. It is one of the biggest shopping malls in Paris' inner city. A mix between a department store and a shopping mall, Beaugrenelle is home to 120 shops and restaurants.

<span class="mw-page-title-main">Mall of Africa</span> Shopping mall in Midrand, South Africa

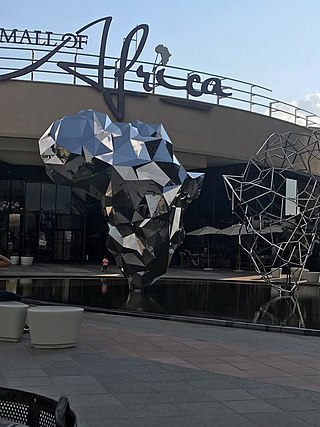
Mall of Africa is a shopping mall located in Waterfall City, Midrand, Gauteng. It is the third largest single-phase shopping mall to be built in Africa, but smaller than Gateway, Sandton City, Menlyn Park and Fourways Mall. The total retail area is 130 000 square metres. The shopping mall has two main levels of shopping as well as an outdoor restaurant plaza which connects directly to the Waterfall City Park.

Aislelabs Inc. is a Toronto-based technology company offering WiFi analytics and marketing platforms.

<span class="mw-page-title-main">GrayMatter Software</span>

GrayMatter Software is a data science, artificial intelligence, and analytics firm, headquartered in Bangalore, Karnataka. It was founded in 2006 by Vikas Gupta as a business intelligence consulting firm. Over the years, the company has partnered with SAP, Hitachi Vantara and Qlik for products and services within the airport Industry.

References

  1. "Metrics for measuring ad campaign effectiveness". www.allbusiness.com. July 2010. Retrieved 17 August 2017.
  2. "Using marketing insights to optimize staffing". MyCustomer. 9 June 2017. Retrieved 18 August 2017.
  3. Fathi, Nader. "How Shopper Analytics ensure mall thrives?". Chain Store Age. Archived from the original on 17 August 2017. Retrieved 17 August 2017.
  4. D'Mello, Sandhya. "Malls in Dubai use sensors to count crowds". www.khaleejtimes.com. Retrieved 2017-08-18.
  5. "Automatic passenger counting systems for public transport".
  6. Dictionary, Oxford. "footfall". Oxford Dictionary. Archived from the original on September 27, 2016. Retrieved 17 August 2017.
  7. Hounslea, Tara (6 March 2017). "Primark boosts Colchester shopping centre footfall by 30%". Drapers. Retrieved 2018-11-23.
  8. "Average Daily Footfall In Aviation House By Week - data.gov.uk". data.gov.uk. 21 February 2018. Retrieved 2018-11-23.
  9. "Marks & Spencer average footfall 2009-2018 | Statistic". Statista. Retrieved 2018-11-23.
  10. Dillon, Chris (30 July 2015). "Sunder Sandhe's tech game changer". Archived from the original on 30 July 2015. Retrieved 27 August 2015.{{cite journal}}: Cite journal requires |journal= (help)
  11. "Wi-Fi Location Analytics" (PDF). Information Commissioners Office. Retrieved 18 August 2017.
  12. Lowry, James. "How to Use a Traffic Study to Select a Retail Site" (PDF). Women's Enterprise Centre. Retrieved 21 August 2017.
  13. Marsan, Jeremy. "How To Determine Foot Traffic & Use Data To Pick A Business Location". Fit Small Business. Retrieved 18 August 2017.
  14. Clifford, Stephanie; Hardy, Quentin (15 July 2013). "Attention, Shoppers: Store Is Tracking Your Cell". The New York Times. Retrieved 18 August 2017.
  15. Paul C. Box, Joseph C. Oppenlander (1976), Manual of traffic engineering studies, Institute of Transportation Engineers, p. 17, retrieved December 21, 2010
  16. Yao, Jian; Odobez, Jean-Marc (2007). "Multi-Layer Background Subtraction Based on Color and Texture". 2007 IEEE Conference on Computer Vision and Pattern Recognition (PDF). pp. 1–8. doi:10.1109/CVPR.2007.383497. ISBN   978-1-4244-1179-5. S2CID   1548628. Archived from the original (PDF) on 21 August 2017. Retrieved 21 August 2017.
  17. Jian Yao; Jean-Marc Odobez (2007). Multi-Layer Background Subtraction Based on Color and Texture (PDF). The CVPR Visual Surveillance Workshop (CVPR-VS). Minneapolis, MN, US: IEEE. doi:10.1109/CVPR.2007.383497.
  18. "How a CCTV People Counting System Works". Retail Sensing. Retrieved 15 April 2016.
  19. Hsu, Jeremy (19 October 2015). "Computer Count of huge crowd now possible". IEEE Spectrum. Retrieved 18 August 2017.
  20. Wenz, John (9 June 2015). "How Wi-Fi Can Count the People in a Room Without Tracking Their Phones". Popular Mechanics. Retrieved 17 August 2017.
  21. "Security and Privacy Changes in iOS 9". 2015.
  22. Amadeo, Ron (5 October 2015). "Android 6.0 Marshmallow, thoroughly reviewed". arstechnica.com.
  23. popa, m.c; rothkrantz, ljm. "Analysis of Shopping Behavior based on Surveillance System" (PDF). Video and Image Processing, Philips Research: 2512–2519.
  24. Ruser, Heinrich; Pavlov, Vladislav. "People counter based on fusion of reflected light intensities from an infrared sensor array" (PDF). Institut für Mess- und Automatisierungstechnik (IMA).
  25. Sarre, Rick. "CCTV: who can watch whom under the law?". The Conversation. Retrieved 2018-01-19.
  26. Kajala, L.; Almik, A.; Dahl, R.; Diksaito, L.; Erkkonen, J.; Fredman, P.; Jensen, F.; Sondergaard, K; Sievaner, T. (2007). Visitor Monitoring in Nature Area - a manual based on experiences from the Nordic and Baltic Countries. Sweden: TemaNord. p. 46. ISBN   9789162012588 . Retrieved 21 August 2017.