In statistics, an estimator is a rule for calculating an estimate of a given quantity based on observed data: thus the rule, the quantity of interest and its result are distinguished. For example, the sample mean is a commonly used estimator of the population mean.
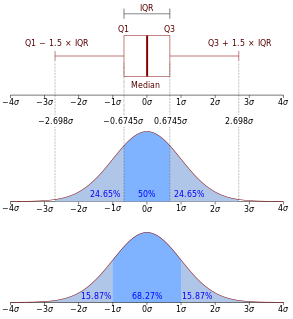
In descriptive statistics, the interquartile range (IQR) is a measure of statistical dispersion, which is the spread of the data. The IQR may also be called the midspread, middle 50%, fourth spread, or H‑spread. It is defined as the difference between the 75th and 25th percentiles of the data. To calculate the IQR, the data set is divided into quartiles, or four rank-ordered even parts via linear interpolation. These quartiles are denoted by Q1 (also called the lower quartile), Q2 (the median), and Q3 (also called the upper quartile). The lower quartile corresponds with the 25th percentile and the upper quartile corresponds with the 75th percentile, so IQR = Q3 − Q1.

In statistics and probability theory, the median is the value separating the higher half from the lower half of a data sample, a population, or a probability distribution. For a data set, it may be thought of as "the middle" value. The basic feature of the median in describing data compared to the mean is that it is not skewed by a small proportion of extremely large or small values, and therefore provides a better representation of a "typical" value. Median income, for example, may be a better way to suggest what a "typical" income is, because income distribution can be very skewed. The median is of central importance in robust statistics, as it is the most resistant statistic, having a breakdown point of 50%: so long as no more than half the data are contaminated, the median is not an arbitrarily large or small result.
In statistics, point estimation involves the use of sample data to calculate a single value which is to serve as a "best guess" or "best estimate" of an unknown population parameter. More formally, it is the application of a point estimator to the data to obtain a point estimate.
In statistics, the kth order statistic of a statistical sample is equal to its kth-smallest value. Together with rank statistics, order statistics are among the most fundamental tools in non-parametric statistics and inference.
Estimation theory is a branch of statistics that deals with estimating the values of parameters based on measured empirical data that has a random component. The parameters describe an underlying physical setting in such a way that their value affects the distribution of the measured data. An estimator attempts to approximate the unknown parameters using the measurements. In estimation theory, two approaches are generally considered:
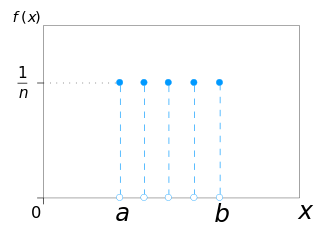
In probability theory and statistics, the discrete uniform distribution is a symmetric probability distribution wherein a finite number of values are equally likely to be observed; every one of n values has equal probability 1/n. Another way of saying "discrete uniform distribution" would be "a known, finite number of outcomes equally likely to happen".

In probability theory and statistics, the continuous uniform distribution or rectangular distribution is a family of symmetric probability distributions. The distribution describes an experiment where there is an arbitrary outcome that lies between certain bounds. The bounds are defined by the parameters, a and b, which are the minimum and maximum values. The interval can either be closed or open. Therefore, the distribution is often abbreviated U, where U stands for uniform distribution. The difference between the bounds defines the interval length; all intervals of the same length on the distribution's support are equally probable. It is the maximum entropy probability distribution for a random variable X under no constraint other than that it is contained in the distribution's support.
The Wilcoxon signed-rank test is a non-parametric statistical hypothesis test used either to test the location of a population based on a sample of data, or to compare the locations of two populations using two matched samples. The one-sample version serves a purpose similar to that of the one-sample Student's t-test. For two matched samples, it is a paired difference test like the paired Student's t-test. The Wilcoxon test can be a good alternative to the t-test when population means are not of interest; for example, when one wishes to test whether a population's median is nonzero, or whether there is a better than 50% chance that a sample from one population is greater than a sample from another population.
This glossary of statistics and probability is a list of definitions of terms and concepts used in the mathematical sciences of statistics and probability, their sub-disciplines, and related fields. For additional related terms, see Glossary of mathematics and Glossary of experimental design.
In statistics, the mid-range or mid-extreme is a measure of central tendency of a sample (statistics) defined as the arithmetic mean of the maximum and minimum values of the data set:
Robust statistics is statistics with good performance for data drawn from a wide range of probability distributions, especially for distributions that are not normal. Robust statistical methods have been developed for many common problems, such as estimating location, scale, and regression parameters. One motivation is to produce statistical methods that are not unduly affected by outliers. Another motivation is to provide methods with good performance when there are small departures from a parametric distribution. For example, robust methods work well for mixtures of two normal distributions with different standard-deviations; under this model, non-robust methods like a t-test work poorly.
In statistics, M-estimators are a broad class of extremum estimators for which the objective function is a sample average. Both non-linear least squares and maximum likelihood estimation are special cases of M-estimators. The definition of M-estimators was motivated by robust statistics, which contributed new types of M-estimators. The statistical procedure of evaluating an M-estimator on a data set is called M-estimation. 48 samples of robust M-estimators can be found in a recent review study.
Bootstrapping is any test or metric that uses random sampling with replacement, and falls under the broader class of resampling methods. Bootstrapping assigns measures of accuracy to sample estimates. This technique allows estimation of the sampling distribution of almost any statistic using random sampling methods.
In statistics, the Hodges–Lehmann estimator is a robust and nonparametric estimator of a population's location parameter. For populations that are symmetric about one median, such as the (Gaussian) normal distribution or the Student t-distribution, the Hodges–Lehmann estimator is a consistent and median-unbiased estimate of the population median. For non-symmetric populations, the Hodges–Lehmann estimator estimates the "pseudo–median", which is closely related to the population median.
In statistical theory, a U-statistic is a class of statistics that is especially important in estimation theory; the letter "U" stands for unbiased. In elementary statistics, U-statistics arise naturally in producing minimum-variance unbiased estimators.

In statistics, an L-estimator is an estimator which is a linear combination of order statistics of the measurements. This can be as little as a single point, as in the median, or as many as all points, as in the mean.
In statistics, the sample maximum and sample minimum, also called the largest observation and smallest observation, are the values of the greatest and least elements of a sample. They are basic summary statistics, used in descriptive statistics such as the five-number summary and Bowley's seven-figure summary and the associated box plot.
In the comparison of various statistical procedures, efficiency is a measure of quality of an estimator, of an experimental design, or of a hypothesis testing procedure. Essentially, a more efficient estimator, experiment, or test needs fewer observations than a less efficient one to achieve a given error performance. An efficient estimator is characterized by a small variance or mean square error, indicating that there is a small deviance between the estimated value and the "true" value.


