
Numerical climate models use quantitative methods to simulate the interactions of the important drivers of climate, including atmosphere, oceans, land surface and ice. They are used for a variety of purposes from study of the dynamics of the climate system to projections of future climate. Climate models may also be qualitative models and also narratives, largely descriptive, of possible futures.

In astronomy, a light curve is a graph of the light intensity of a celestial object or region as a function of time, typically with the magnitude of light received on the y-axis and with time on the x-axis. The light is usually in a particular frequency interval or band.
An inverse problem in science is the process of calculating from a set of observations the causal factors that produced them: for example, calculating an image in X-ray computed tomography, source reconstruction in acoustics, or calculating the density of the Earth from measurements of its gravity field. It is called an inverse problem because it starts with the effects and then calculates the causes. It is the inverse of a forward problem, which starts with the causes and then calculates the effects.

A microwave radiometer (MWR) is a radiometer that measures energy emitted at one millimeter-to-metre wavelengths (frequencies of 0.3–300 GHz) known as microwaves. Microwave radiometers are very sensitive receivers designed to measure thermally-emitted electromagnetic radiation. They are usually equipped with multiple receiving channels to derive the characteristic emission spectrum of planetary atmospheres, surfaces or extraterrestrial objects. Microwave radiometers are utilized in a variety of environmental and engineering applications, including remote sensing, weather forecasting, climate monitoring, radio astronomy and radio propagation studies.

Remote sensing is the acquisition of information about an object or phenomenon without making physical contact with the object, in contrast to in situ or on-site observation. The term is applied especially to acquiring information about Earth and other planets. Remote sensing is used in numerous fields, including geophysics, geography, land surveying and most Earth science disciplines ; it also has military, intelligence, commercial, economic, planning, and humanitarian applications, among others.
Ground truth is information that is known to be real or true, provided by direct observation and measurement as opposed to information provided by inference.

Spatial analysis is any of the formal techniques which studies entities using their topological, geometric, or geographic properties. Spatial analysis includes a variety of techniques using different analytic approaches, especially spatial statistics. It may be applied in fields as diverse as astronomy, with its studies of the placement of galaxies in the cosmos, or to chip fabrication engineering, with its use of "place and route" algorithms to build complex wiring structures. In a more restricted sense, spatial analysis is geospatial analysis, the technique applied to structures at the human scale, most notably in the analysis of geographic data. It may also be applied to genomics, as in transcriptomics data.

The normalized difference vegetation index (NDVI) is a widely-used metric for quantifying the health and density of vegetation using sensor data. It is calculated from spectrometric data at two specific bands: red and near-infrared. The spectrometric data is usually sourced from remote sensors, such as satellites.
Atmospheric sounding or atmospheric profiling is a measurement of vertical distribution of physical properties of the atmospheric column such as pressure, temperature, wind speed and wind direction, liquid water content, ozone concentration, pollution, and other properties. Such measurements are performed in a variety of ways including remote sensing and in situ observations.
An atmospheric radiative transfer model, code, or simulator calculates radiative transfer of electromagnetic radiation through a planetary atmosphere.
Atmospheric correction is the process of removing the scattering and absorption effects of the atmosphere on the reflectance values of images taken by satellite or airborne sensors. Atmospheric effects in optical remote sensing are significant and complex, dramatically altering the spectral nature of the radiation reaching the remote sensor. The atmosphere both absorbs and scatters various wavelengths of the visible spectrum which must pass through the atmosphere twice, once from the sun to the object and then again as it travels back up the image sensor. These distortions are corrected using various approaches and techniques, as described below.

Geography is the study of the lands, features, inhabitants, and phenomena of Earth. Geography is an all-encompassing discipline that seeks an understanding of Earth and its human and natural complexities—not merely where objects are, but also how they have changed and come to be. While geography is specific to Earth, many concepts can be applied more broadly to other celestial bodies in the field of planetary science. Geography has been called "a bridge between natural science and social science disciplines."
Geomathematics is the application of mathematical methods to solve problems in geosciences, including geology and geophysics, and particularly geodynamics and seismology.
DPHM-RS is a semi-distributed hydrologic model developed at University of Alberta, Canada.
DART is a 3D radiative transfer model, designed for scientific research, in particular remote sensing. Developed at CESBIO since 1992, DART model was patented in 2003. It is freeware for scientific activities.
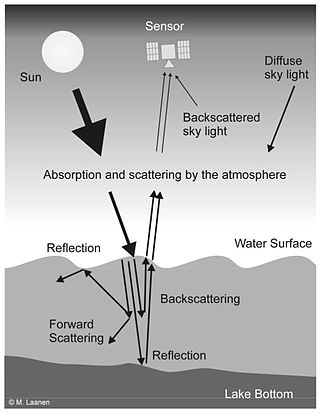
Water Remote Sensing is the observation of water bodies such as lakes, oceans, and rivers from a distance in order to describe their color, state of ecosystem health, and productivity. Water remote sensing studies the color of water through the observation of the spectrum of water leaving radiance. From the spectrum of color coming from the water, the concentration of optically active components of the upper layer of the water body can be estimated via specific algorithms. Water quality monitoring by remote sensing and close-range instruments has obtained considerable attention since the founding of EU Water Framework Directive.
Atmospheric lidar is a class of instruments that uses laser light to study atmospheric properties from the ground up to the top of the atmosphere. Such instruments have been used to study, among other, atmospheric gases, aerosols, clouds, and temperature.
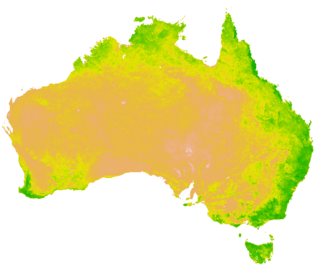
A vegetation index (VI) is a spectral imaging transformation of two or more image bands designed to enhance the contribution of vegetation properties and allow reliable spatial and temporal inter-comparisons of terrestrial photosynthetic activity and canopy structural variations.

Remote sensing is used in the geological sciences as a data acquisition method complementary to field observation, because it allows mapping of geological characteristics of regions without physical contact with the areas being explored. About one-fourth of the Earth's total surface area is exposed land where information is ready to be extracted from detailed earth observation via remote sensing. Remote sensing is conducted via detection of electromagnetic radiation by sensors. The radiation can be naturally sourced, or produced by machines and reflected off of the Earth surface. The electromagnetic radiation acts as an information carrier for two main variables. First, the intensities of reflectance at different wavelengths are detected, and plotted on a spectral reflectance curve. This spectral fingerprint is governed by the physio-chemical properties of the surface of the target object and therefore helps mineral identification and hence geological mapping, for example by hyperspectral imaging. Second, the two-way travel time of radiation from and back to the sensor can calculate the distance in active remote sensing systems, for example, Interferometric synthetic-aperture radar. This helps geomorphological studies of ground motion, and thus can illuminate deformations associated with landslides, earthquakes, etc.
Remote sensing in oceanography is a widely used observational technique which enables researchers to acquire data of a location without physically measuring at that location. Remote sensing in oceanography mostly refers to measuring properties of the ocean surface with sensors on satellites or planes, which compose an image of captured electromagnetic radiation. A remote sensing instrument can either receive radiation from the earth’s surface (passive), whether reflected from the sun or emitted, or send out radiation to the surface and catch the reflection (active). All remote sensing instruments carry a sensor to capture the intensity of the radiation at specific wavelength windows, to retrieve a spectral signature for every location. The physical and chemical state of the surface determines the emissivity and reflectance for all bands in the electromagnetic spectrum, linking the measurements to physical properties of the surface. Unlike passive instruments, active remote sensing instruments also measure the two-way travel time of the signal; which is used to calculate the distance between the sensor and the imaged surface. Remote sensing satellites often carry other instruments which keep track of their location and measure atmospheric conditions.
