Real wages

Last updated
Wages annualized rate
(before taxes)
.mw-parser-output .legend{page-break-inside:avoid;break-inside:avoid-column}.mw-parser-output .legend-color{display:inline-block;min-width:1.25em;height:1.25em;line-height:1.25;margin:1px 0;text-align:center;border:1px solid black;background-color:transparent;color:black}.mw-parser-output .legend-text{}
Nominal wages
Adjusted for inflation wages Wages in the United States.webp
Wages annualized rate
(before taxes)
   Nominal wages
Wages Month to Month rate (before taxes)
Nominal wages
Adjusted for inflation wages Wages month to month.webp
Wages Month to Month rate (before taxes)
   Nominal wages
US net productivity compared to real wages. Wage productivity.jpg
US net productivity compared to real wages.

Real wages are wages adjusted for inflation, or, equivalently, wages in terms of the amount of goods and services that can be bought. This term is used in contrast to nominal wages or unadjusted wages.

Contents

Because it has been adjusted to account for changes in the prices of goods and services, real wages provide a clearer representation of an individual's wages in terms of what they can afford to buy with those wages – specifically, in terms of the amount of goods and services that can be bought. However, real wages suffer the disadvantage of not being well defined, since the amount of inflation (which can be calculated based on different combinations of goods and services) is itself not well defined. Hence real wage defined as the total amount of goods and services that can be bought with a wage, is also not defined. This is because of changes in the relative prices.

Despite difficulty in defining one value for the real wage, in some cases a real wage can be said to have unequivocally increased. This is true if: After the change, the worker can now afford any bundle of goods and services that they could just barely afford before the change, and still have money left over. In such a situation, real wage increases no matter how inflation is calculated. Specifically, inflation could be calculated based on any good or service or combination thereof, and real wage has still increased. This of course leaves many scenarios where real wage increasing, decreasing or staying the same depends upon how inflation is calculated. These are the scenarios where the worker can buy some of the bundles that they could just barely afford before and still have money left, but at the same time they simply cannot afford some of the bundles that they could before. This happens because some prices change more than others, which means relative prices have changed.

The use of adjusted figures is used in undertaking some forms of economic analysis. For example, to report on the relative economic successes of two nations, real wage figures are more useful than nominal figures. The importance of considering real wages also appears when looking at the history of a single country. If only nominal wages are considered, the conclusion has to be that people used to be significantly poorer than today. However, the cost of living was also much lower. To have an accurate view of a nation's wealth in any given year, inflation has to be taken into account and real wages must be used as one measuring stick. There are further limitations in the traditional measures of wages, such as failure to incorporate additional employment benefits, or not adjusting for a changing composition of the overall workforce. [1]

An alternative is to look at how much time it took to earn enough money to buy various items in the past, which is one version of the definition of real wages as the amount of goods or services that can be bought. Such an analysis shows that for most items, it takes much less work time to earn them now than it did decades ago, at least in the United States. [2]

Example

Higher wage growth in workers' paychecks, if accompanied by higher inflation, can result in lower purchasing power for workers than during a period with lower nominal wage growth combined with lower inflation. Data: https://fred.stlouisfed.org/graph/?g=mwFz Illustration of How Workers Can Get Ahead .png
Higher wage growth in workers' paychecks, if accompanied by higher inflation, can result in lower purchasing power for workers than during a period with lower nominal wage growth combined with lower inflation. Data: https://fred.stlouisfed.org/graph/?g=mwFz

Consider an example economy with the following wages over three years. Also assume that the inflation in this economy is 2% per year:

Real wage = W/i (W = wage, i = inflation, can also be subjugated as interest).

If the figures shown are real wages, then wages have increased by 2% after inflation has been taken into account. In effect, an individual making this wage actually has more ability to buy goods and services than the previous year. However, if the figures shown are nominal wages then real wages are not increasing at all. In absolute dollar amounts, an individual is bringing home more money each year, but the increases in inflation actually zeroes out the increases in their salary. Given that inflation is increasing at the same pace as wages, an individual cannot actually afford to increase their consumption in such a scenario.

The nominal wage increases a worker sees in his paycheck may give a misleading impression of whether he is "getting ahead" or "falling behind" over time. For example, the average worker’s paycheck increased 2.7% in 2005, while it increased 2.1% in 2015, creating an impression for some workers that they were "falling behind". [3] However, inflation was 3.4% in 2005, while it was only 0.1% in 2015, so workers were actually "getting ahead" with lower nominal paycheck increases in 2015 compared to 2005. [4]

Historically, the trends of real wages are typically divided into two phases. The first phase, known as the Malthusian phase of history, consists of the period of time before the mass modern economic growth that began around 1800. During this phase, real wages grew very slowly, if at all, since increases in productivity would typically result in equivalent population growth that offset this increased production and left the income per person relatively constant in the long run. The second phase, known as the Solow phase, occurred after 1800 and corresponded with the massive technological and societal improvements brought about by the industrial revolution. In this phase, population growth has been more restrained, and as such real wages have risen much more dramatically with rapid increases in technology and productivity over time. [5]

Following the recession of 2008 real wages globally have stagnated [6] with a world average real wage growth rate of 2% in 2013. Africa, Eastern Europe, Central Asia, and Latin America have all experienced real wage growth of under 0.9% in 2013, whilst the developed countries of the OECD have experienced real wage growth of 0.2% in the same period. (Conversely, Asia has consistently experienced strong real wage growth of over 6% from 2006 to 2013.) [7] The International Labour Organisation has stated that wage stagnation has resulted in "a declining share of GDP going to labour while an increasing share goes to capital, especially in developed economies." [6]

United States

The Economic Policy Institute stated wages have failed to keep up with productivity in the United States since the mid 1970s, and that wages have therefore stagnated. According to them, between 1973 and 2013, productivity grew 74.4% and hourly compensation grew 9.2%, [8] contradicting the neoclassical economic theory that those two should rise equally together. [9] However, the Heritage Foundation says these claims rest on misinterpreted economic statistics. According to them, productivity grew 100% between 1973 and 2012 while employee compensation, which accounts for worker benefits as well as wages, grew 77%. [10] The Economic Policy Institute and the Heritage Foundation used different inflation adjusting methods in their studies.

A heat map of the United States by living wage for a single, childless individual according to the MIT living wage calculator as of 2023
$15-15.99
$16.00-16.99
$17.00-17.99
$18.00-18.99
$19.00-19.99
$20+ Living wage by state.png
A heat map of the United States by living wage for a single, childless individual according to the MIT living wage calculator as of 2023
  $15-15.99
  $16.00-16.99
  $17.00-17.99
  $18.00-18.99
  $19.00-19.99
  $20+

Besides rising benefit costs, proposed causes of wage stagnation include the decline of labor unions, loss of job mobility (including through non-competes), and declining employment by the manufacturing sector. [12]

Between June 2016 and June 2017, wages in the United States grew by 2.5%. Factor in inflation, and that level is close to 1% growth for the period. [13]

Europe

The countries of Belgium, France, Germany, Italy and the United Kingdom have experienced strong real wage growth following European integration in the early 1980s. [6] However, according to OECD between 2007 and 2015 the United Kingdom saw a real wage decline of 10.4%, equal only to Greece. [14] [15]

A 2014 study argued that wages now respond more strongly to changes in unemployment rates. It documented how the UK's 1979 - 2010 real wage growth across deciles has stagnated since 2003. Its models found that pre-2003, a doubling of the unemployment rate saw median wages fall 7%, but now the same doubling sees a fall of 12%. [16]

A 2018 paper contended that a major source of wage stagnation is underemployment. [lower-alpha 1] It studied the OECD with a focus on the UK, finding that unemployment rates often returned to 2007's pre-great recession levels. However, 2017 underemployment rates in many countries were still worse than 2007. So it argues that the low unemployment rates hide continued "labour market slack": its models found underemployment was negatively related to wages both in the UK and other countries. [17]

See also

Related Research Articles

<span class="mw-page-title-main">Macroeconomics</span> Study of an economy as a whole

Macroeconomics is a branch of economics that deals with the performance, structure, behavior, and decision-making of an economy as a whole. This includes regional, national, and global economies. Macroeconomists study topics such as output/GDP and national income, unemployment, price indices and inflation, consumption, saving, investment, energy, international trade, and international finance.

In economics, stagflation or recession-inflation is a situation in which the inflation rate is high or increasing, the economic growth rate slows, and unemployment remains steadily high. It presents a dilemma for economic policy, since actions intended to lower inflation may exacerbate unemployment.

<span class="mw-page-title-main">Unemployment</span> People without work and actively seeking work

Unemployment, according to the OECD, is people above a specified age not being in paid employment or self-employment but currently available for work during the reference period.

<span class="mw-page-title-main">Economy of the United States</span>

The United States is a highly developed/advanced mixed economy. It is the world's largest economy by nominal GDP, and the second-largest by purchasing power parity (PPP) behind China. It has the world's seventh-highest per capita GDP (nominal) and the eighth-highest per capita GDP (PPP) as of 2022. The U.S. accounted for 25.4% of the global economy in 2022 in nominal terms, and around 15.6% in PPP terms. The U.S. dollar is the currency of record most used in international transactions and is the world's reserve currency, backed by a large U.S. treasuries market, its role as the reference standard for the petrodollar system, and its linked eurodollar. Several countries use it as their official currency and in others it is the de facto currency.

<span class="mw-page-title-main">Inflation</span> Devaluation of currency over a period of time

In economics, inflation is a general increase in the prices of goods and services in an economy. This is usually measured using the consumer price index (CPI). When the general price level rises, each unit of currency buys fewer goods and services; consequently, inflation corresponds to a reduction in the purchasing power of money. The opposite of CPI inflation is deflation, a decrease in the general price level of goods and services. The common measure of inflation is the inflation rate, the annualized percentage change in a general price index. As prices faced by households do not all increase at the same rate, the consumer price index (CPI) is often used for this purpose.

Full employment is a situation in which there is no cyclical or deficient-demand unemployment. Full employment does not entail the disappearance of all unemployment, as other kinds of unemployment, namely structural and frictional, may remain. For instance, workers who are "between jobs" for short periods of time as they search for better employment are not counted against full employment, as such unemployment is frictional rather than cyclical. An economy with full employment might also have unemployment or underemployment where part-time workers cannot find jobs appropriate to their skill level, as such unemployment is considered structural rather than cyclical. Full employment marks the point past which expansionary fiscal and/or monetary policy cannot reduce unemployment any further without causing inflation.

New Keynesian economics is a school of macroeconomics that strives to provide microeconomic foundations for Keynesian economics. It developed partly as a response to criticisms of Keynesian macroeconomics by adherents of new classical macroeconomics.

The Phillips curve is an economic model, named after Bill Phillips, that correlates reduced unemployment with increasing wages in an economy. While Phillips did not directly link employment and inflation, this was a trivial deduction from his statistical findings. Paul Samuelson and Robert Solow made the connection explicit and subsequently Milton Friedman and Edmund Phelps put the theoretical structure in place.

<span class="mw-page-title-main">Underemployment</span> Underutilization of workers talents or skills in employment

Underemployment is the underuse of a worker because their job does not use their skills, offers them too few hours, or leaves the worker idle. It contrasts from unemployment, where a person lacks a job at all despite wanting one.

The economies of Canada and the United States are similar because both are developed countries. While both countries feature in the top ten economies in the world in 2022, the U.S. is the largest economy in the world, with US$24.8 trillion, with Canada ranking ninth at US$2.2 trillion.

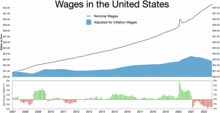
In economics, nominal value refers to value measured in terms of absolute money amounts, whereas real value is considered and measured against the actual goods or services for which it can be exchanged at a given time. For example, if one is offered a salary of $40,000, in that year, the real and nominal values are both $40,000. The following year, any inflation means that although the nominal value remains $40,000, because prices have risen, the salary will buy fewer goods and services, and thus its real value has decreased in accordance with inflation. On the other hand, an asset that holds its value, such as a diamond, may increase in nominal price from year to year, but its real value, i.e. its value in relation to other goods and services for which it can be exchanged, or its purchasing power, is consistent over time, because inflation has affected both its nominal value and other goods' nominal values. In spite of changes in the price, it can be sold and an equivalent amount of other gemstones such as emeralds can be purchased, because the emeralds' prices will have increased with inflation as well.

In economics, the Baumol effect, also known as Baumol's cost disease, is the rise of wages in jobs that have experienced little or no increase in labor productivity in response to rising wages in other jobs that have experienced higher productivity growth. The phenomenon was described by William J. Baumol and William G. Bowen in the 1960s and is an example of cross elasticity of demand.

Economic stagnation is a prolonged period of slow economic growth, usually accompanied by high unemployment. Under some definitions, slow means significantly slower than potential growth as estimated by macroeconomists, even though the growth rate may be nominally higher than in other countries not experiencing economic stagnation.

The neoclassical synthesis (NCS), neoclassical–Keynesian synthesis, or just neo-Keynesianism was a neoclassical economics academic movement and paradigm in economics that worked towards reconciling the macroeconomic thought of John Maynard Keynes in his book The General Theory of Employment, Interest and Money (1936). It was formulated most notably by John Hicks (1937), Franco Modigliani (1944), and Paul Samuelson (1948), who dominated economics in the post-war period and formed the mainstream of macroeconomic thought in the 1950s, 60s, and 70s.

<span class="mw-page-title-main">Middle-class squeeze</span> Decline in middle-class real wages and increase in economic inequality

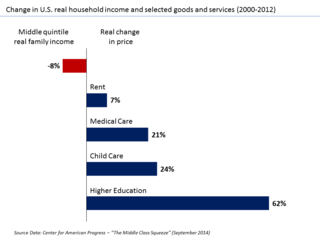
The middle-class squeeze refers to negative trends in the standard of living and other conditions of the middle class of the population. Increases in wages fail to keep up with inflation for middle-income earners, leading to a relative decline in real wages, while at the same time, the phenomenon fails to have a similar effect on the top wage earners. People belonging to the middle class find that inflation in consumer goods and the housing market prevent them from maintaining a middle-class lifestyle, undermining aspirations of upward mobility.

Non-accelerating inflation rate of unemployment (NAIRU) is a theoretical level of unemployment below which inflation would be expected to rise. It was first introduced as NIRU by Franco Modigliani and Lucas Papademos in 1975, as an improvement over the "natural rate of unemployment" concept, which was proposed earlier by Milton Friedman.

<span class="mw-page-title-main">History of macroeconomic thought</span>

Macroeconomic theory has its origins in the study of business cycles and monetary theory. In general, early theorists believed monetary factors could not affect real factors such as real output. John Maynard Keynes attacked some of these "classical" theories and produced a general theory that described the whole economy in terms of aggregates rather than individual, microeconomic parts. Attempting to explain unemployment and recessions, he noticed the tendency for people and businesses to hoard cash and avoid investment during a recession. He argued that this invalidated the assumptions of classical economists who thought that markets always clear, leaving no surplus of goods and no willing labor left idle.

The Fei–Ranis model of economic growth is a dualism model in developmental economics or welfare economics that has been developed by John C. H. Fei and Gustav Ranis and can be understood as an extension of the Lewis model. It is also known as the Surplus Labor model. It recognizes the presence of a dual economy comprising both the modern and the primitive sector and takes the economic situation of unemployment and underemployment of resources into account, unlike many other growth models that consider underdeveloped countries to be homogenous in nature. According to this theory, the primitive sector consists of the existing agricultural sector in the economy, and the modern sector is the rapidly emerging but small industrial sector. Both the sectors co-exist in the economy, wherein lies the crux of the development problem. Development can be brought about only by a complete shift in the focal point of progress from the agricultural to the industrial economy, such that there is augmentation of industrial output. This is done by transfer of labor from the agricultural sector to the industrial one, showing that underdeveloped countries do not suffer from constraints of labor supply. At the same time, growth in the agricultural sector must not be negligible and its output should be sufficient to support the whole economy with food and raw materials. Like in the Harrod–Domar model, saving and investment become the driving forces when it comes to economic development of underdeveloped countries.

Wage growth is a rise of wage adjusted for inflations, often expressed in percentage. In macroeconomics, wage growth is one of the main indications to measure economic growth for a long-term since it reflects the consumer's purchasing power in the economy as well as the level of living standards. An increase in wage growth implies price inflation in the economy while a low wage growth indicates deflation that needs artificial interferences such as through fiscal policies by federal/state government. Minimum wage law is often introduced to increase wage growth by stimulating price inflations from corresponding purchasing powers in the economy. Wage growth can also be maximised through the development of industry factors by investing skilled workers in which decision made by businesses. More financial compensation for skilled workers not only lifts wage growth but stimulates higher market prices in the economy.

The decoupling of wages from productivity, sometimes known as the great decoupling, is the gap between the growth rate of median wages and the growth rate of GDP. Economists began to acknowledge this problem toward the end of the twentieth century and the beginning of the twenty-first century. This problem furthermore leads to wage stagnation despite continued economic growth.

References

  1. The Council of Economic Advisers (September 2018). "How Much Are Workers Getting Paid? A Primer on Wage Measurement" (PDF). whitehouse.gov via National Archives.
  2. "Time Well Spent: The Declining Real Cost of Living in America" by W. Michael Cox and Richard Alm, pp. 2–24 of the 1997 Annual Report of the Federal Reserve Bank of Dallas.
  3. "Average Hourly Earnings of Production and Nonsupervisory Employees: Total Private". January 1964.
  4. "Consumer Price Index for All Urban Consumers: All Items". January 1947.
  5. Allen, Robert C. (2008). "Real Wage Rates (Historical Trends)". The New Palgrave Dictionary of Economics. Palgrave Macmillan, London. pp. 1–7. doi:10.1057/978-1-349-95121-5_2168-1. ISBN   978-1-349-95121-5.
  6. 1 2 "Global wage growth stagnates, lags behind pre-crisis rates". International Labour Organisation. 5 December 2014. Retrieved 11 June 2016.
  7. "Comparing how wages have changed in different regions of the world". 2014-12-05. Retrieved 2016-07-10.
  8. "Wage Stagnation in Nine Charts".
  9. "Greg Mankiw's Blog: How are wages and productivity related?".
  10. "Productivity and Compensation: Growing Together".
  11. "Living Wage Calculator". livingwage.mit.edu. Retrieved 2023-10-02.
  12. "For most Americans, real wages have barely budged for decades". Pew Research Center. 2018. Retrieved 5 April 2020.
  13. Rushe, Dominic (2017-07-07). "US jobs report shows sharp recovery in June but wage growth remains slow". The Guardian . Retrieved 2017-07-10.
  14. Allen, Katie; Elliott, Larry (2016-07-26). "UK joins Greece at bottom of wage growth league". The Guardian.
  15. "OECD Employment Outlook 2016 | READ online".
  16. Gregg, Paul; Machin, Stephen; Fernández‐Salgado, Mariña (1 May 2014). "Real Wages and Unemployment in the Big Squeeze". The Economic Journal. 124 (576): 408–432.
  17. Bell, David; Blanchflower, David (August 2018). "The Lack of Wage Growth and the Falling NAIRU". National Institute Economic Review. 245 (1): 40–55.
  1. Whilst an *un*employed worker wants to work but has no job, an *under*employed worker does have a job, but wants to work more. Ways to measure this include part-time workers who want to be full time, or the number extra hours workers wish to work.