
Edmonton Strathcona is a federal electoral district in Alberta, Canada, that has been represented in the House of Commons of Canada since 1953. It spans the south-central part of the city of Edmonton. In the periods 2008–2015 and 2019–2021, during the 40th, 41st, and 43rd Canadian Parliaments, Edmonton Strathcona was the only federal riding in Alberta not represented by the Conservative Party.
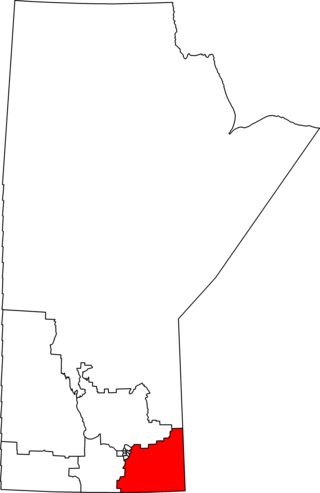
Provencher is a federal electoral district in Manitoba, Canada, that has been represented in the House of Commons of Canada since 1871. It is a largely rural constituency in the province's southeast corner. Its largest community is the city of Steinbach, which makes up 15% of the riding's total population.

Winnipeg South Centre is a federal electoral district in Manitoba, Canada, that has been represented in the House of Commons of Canada from 1925 to 1979 and since 1988.

Yorkton—Melville is a federal electoral district in Saskatchewan, Canada, that has been represented in the House of Commons of Canada since 1968.

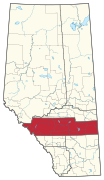
Yellowhead is a federal electoral district in Alberta, Canada, that has been represented in the House of Commons of Canada since 1979. The district is in west-central Alberta and represents: parts of the Municipal District of Greenview No. 16 including Grande Cache, Improvement District No. 25 (Willmore), the Improvement District No. 12 (Jasper), the Municipality of Jasper, Yellowhead County including Hinton and Edson, Brazeau County including Drayton Valley, Lac Ste. Anne County including Alexis 133, Parkland County, Leduc County, Clearwater County including Big Horn 144A, Sunchild 202, and O'Chiese 203, and Rocky Mountain House.

Medicine Hat—Cardston—Warner is a federal electoral district in southern Alberta, Canada, that has been represented in the House of Commons of Canada since 1908.
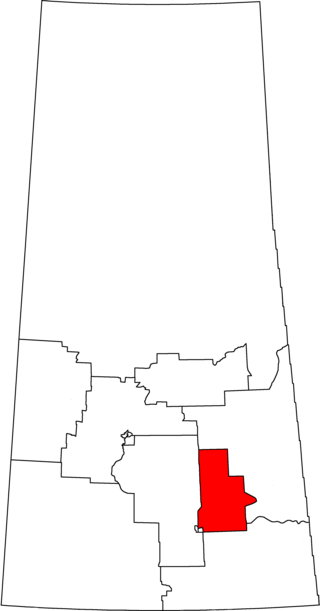
Regina–Qu'Appelle is a federal electoral district in Saskatchewan, Canada, that has been represented in the House of Commons of Canada from 1904 to 1968 and since 1988.
Calgary Nose Hill is a federal electoral district in Alberta, Canada, that has been represented in the House of Commons of Canada since 1997.

Churchill—Keewatinook Aski is a federal electoral district in Manitoba, Canada, that has been represented in the House of Commons of Canada since 1935. It covers the northern four-fifths of Manitoba, a vast wilderness area dotted with small municipalities and First Nations reserves. It was named after the town of Churchill, Manitoba, which resides on Churchill River. It is the fifth-largest riding in all of Canada.
Calgary East was a federal electoral district in Alberta, Canada, that was represented in the House of Commons of Canada from 1917 to 1953, 1979 to 1988, from 1997 to 2015. It was a lower income urban riding in Calgary, with a sizable visible minority population.

Charleswood—St. James—Assiniboia—Headingley is a federal electoral district in Manitoba, Canada, that has been represented in the House of Commons of Canada since 1997.

Prince Albert is a federal electoral district in Saskatchewan, Canada, that has been represented in the House of Commons of Canada from 1908 to 1988, and since 1997.

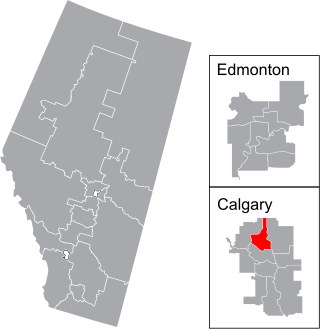
Calgary Centre is a federal electoral district in Alberta, Canada, that has been represented in the House of Commons of Canada since 1968. The riding consists of many young adults who have a relatively high average household income and education level. As the riding encompasses the downtown core and large swaths of apartment blocks in the communities west and south of downtown, Calgary Centre has a low home ownership rate compared to the rest of Canada.
Lethbridge is a federal electoral district in Alberta, Canada, that has been represented in the House of Commons of Canada since 1917. It incorporates the City of Lethbridge and Lethbridge County.
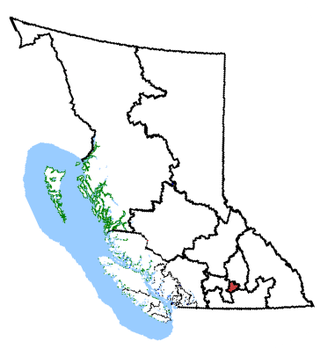
Kelowna—Lake Country is a federal electoral district in the province of British Columbia, Canada, that has been represented in the House of Commons of Canada since 1997.

Bow River is a federal electoral district in southern Alberta, Canada, that has been represented in the House of Commons of Canada from 1917 to 1968, from 1979 to 1988 and since 2015.

Winnipeg Centre is a federal electoral district in Manitoba, Canada, that has been represented in the House of Commons of Canada from 1917 to 1925 and since 1997.

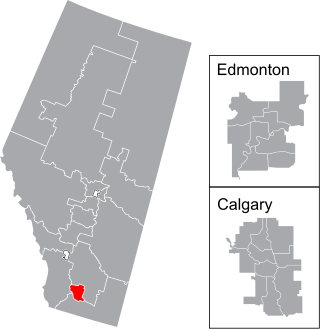
Edmonton—Wetaskiwin is a federal electoral district in Alberta, Canada, that has been represented in the House of Commons of Canada since 2015.
Leduc—Wetaskiwin is a future federal electoral district in Alberta, Canada.
Ponoka—Didsbury is a future federal electoral district in Alberta, Canada.
 1905 representation order
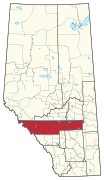 1914 representation order
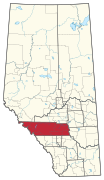 1924 representation order
 1933 representation order
 1952 representation order
 1966 representation order
 1976 representation order
 1987 representation order
 1996 representation order
 2003 representation order


