Related Research Articles
Econometrics is an application of statistical methods to economic data in order to give empirical content to economic relationships. More precisely, it is "the quantitative analysis of actual economic phenomena based on the concurrent development of theory and observation, related by appropriate methods of inference". An introductory economics textbook describes econometrics as allowing economists "to sift through mountains of data to extract simple relationships". Jan Tinbergen is one of the two founding fathers of econometrics. The other, Ragnar Frisch, also coined the term in the sense in which it is used today.
Multivariate statistics is a subdivision of statistics encompassing the simultaneous observation and analysis of more than one outcome variable, i.e., multivariate random variables. Multivariate statistics concerns understanding the different aims and background of each of the different forms of multivariate analysis, and how they relate to each other. The practical application of multivariate statistics to a particular problem may involve several types of univariate and multivariate analyses in order to understand the relationships between variables and their relevance to the problem being studied.
Observational error is the difference between a measured value of a quantity and its true value. In statistics, an error is not necessarily a "mistake". Variability is an inherent part of the results of measurements and of the measurement process.
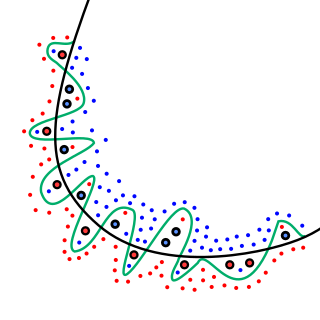
In mathematical modeling, overfitting is "the production of an analysis that corresponds too closely or exactly to a particular set of data, and may therefore fail to fit to additional data or predict future observations reliably". An overfitted model is a mathematical model that contains more parameters than can be justified by the data. The essence of overfitting is to have unknowingly extracted some of the residual variation as if that variation represented underlying model structure.
In statistics, regression toward the mean is the phenomenon where if one sample of a random variable is extreme, the next sampling of the same random variable is likely to be closer to its mean. Furthermore, when many random variables are sampled and the most extreme results are intentionally picked out, it refers to the fact that a second sampling of these picked-out variables will result in "less extreme" results, closer to the initial mean of all of the variables.

In statistics, the logistic model is a statistical model that models the probability of an event taking place by having the log-odds for the event be a linear combination of one or more independent variables. In regression analysis, logistic regression is estimating the parameters of a logistic model. Formally, in binary logistic regression there is a single binary dependent variable, coded by an indicator variable, where the two values are labeled "0" and "1", while the independent variables can each be a binary variable or a continuous variable. The corresponding probability of the value labeled "1" can vary between 0 and 1, hence the labeling; the function that converts log-odds to probability is the logistic function, hence the name. The unit of measurement for the log-odds scale is called a logit, from logistic unit, hence the alternative names. See § Background and § Definition for formal mathematics, and § Example for a worked example.

A nomogram, also called a nomograph, alignment chart, or abac, is a graphical calculating device, a two-dimensional diagram designed to allow the approximate graphical computation of a mathematical function. The field of nomography was invented in 1884 by the French engineer Philbert Maurice d'Ocagne (1862–1938) and used extensively for many years to provide engineers with fast graphical calculations of complicated formulas to a practical precision. Nomograms use a parallel coordinate system invented by d'Ocagne rather than standard Cartesian coordinates.

A scatter plot is a type of plot or mathematical diagram using Cartesian coordinates to display values for typically two variables for a set of data. If the points are coded (color/shape/size), one additional variable can be displayed. The data are displayed as a collection of points, each having the value of one variable determining the position on the horizontal axis and the value of the other variable determining the position on the vertical axis.

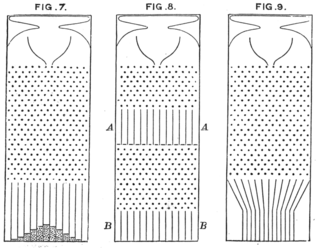
Control charts is a graph used in production control to determine whether quality and manufacturing processes are being controlled under stable conditions. The hourly status is arranged on the graph, and the occurrence of abnormalities is judged based on the presence of data that differs from the conventional trend or deviates from the control limit line. Control charts are classified into Shewhart individuals control chart and CUSUM(CUsUM)(or cumulative sum control chart)(ISO 7870-4).

In statistics, an interaction may arise when considering the relationship among three or more variables, and describes a situation in which the effect of one causal variable on an outcome depends on the state of a second causal variable. Although commonly thought of in terms of causal relationships, the concept of an interaction can also describe non-causal associations. Interactions are often considered in the context of regression analyses or factorial experiments.
The regressionfallacy is an informal fallacy. It assumes that something has returned to normal because of corrective actions taken while it was abnormal. This fails to account for natural fluctuations. It is frequently a special kind of the post hoc fallacy.

In statistics, a spurious relationship or spurious correlation is a mathematical relationship in which two or more events or variables are associated but not causally related, due to either coincidence or the presence of a certain third, unseen factor.
In statistics, a generalized linear model (GLM) is a flexible generalization of ordinary linear regression. The GLM generalizes linear regression by allowing the linear model to be related to the response variable via a link function and by allowing the magnitude of the variance of each measurement to be a function of its predicted value.
In statistics, a categorical variable is a variable that can take on one of a limited, and usually fixed, number of possible values, assigning each individual or other unit of observation to a particular group or nominal category on the basis of some qualitative property. In computer science and some branches of mathematics, categorical variables are referred to as enumerations or enumerated types. Commonly, each of the possible values of a categorical variable is referred to as a level. The probability distribution associated with a random categorical variable is called a categorical distribution.

In statistical modeling, regression analysis is a set of statistical processes for estimating the relationships between a dependent variable and one or more independent variables. The most common form of regression analysis is linear regression, in which one finds the line that most closely fits the data according to a specific mathematical criterion. For example, the method of ordinary least squares computes the unique line that minimizes the sum of squared differences between the true data and that line. For specific mathematical reasons, this allows the researcher to estimate the conditional expectation of the dependent variable when the independent variables take on a given set of values. Less common forms of regression use slightly different procedures to estimate alternative location parameters or estimate the conditional expectation across a broader collection of non-linear models.
In economics, hedonic regression, also sometimes called hedonic demand theory, is a revealed preference method for estimating demand or value. It decomposes the item being researched into its constituent characteristics, and obtains estimates of the contributory value for each. This requires that the composite good can be reduced to its constituent parts and that those resulting parts are in some way valued by the market. Hedonic models are most commonly estimated using regression analysis, although some more generalized models such as sales adjustment grids are special cases which do not.

In statistics, the coefficient of determination, denoted R2 or r2 and pronounced "R squared", is the proportion of the variation in the dependent variable that is predictable from the independent variable(s).
In causal models, controlling for a variable means binning data according to measured values of the variable. This is typically done so that the variable can no longer act as a confounder in, for example, an observational study or experiment.

A plot is a graphical technique for representing a data set, usually as a graph showing the relationship between two or more variables. The plot can be drawn by hand or by a computer. In the past, sometimes mechanical or electronic plotters were used. Graphs are a visual representation of the relationship between variables, which are very useful for humans who can then quickly derive an understanding which may not have come from lists of values. Given a scale or ruler, graphs can also be used to read off the value of an unknown variable plotted as a function of a known one, but this can also be done with data presented in tabular form. Graphs of functions are used in mathematics, sciences, engineering, technology, finance, and other areas.
In statistics, linear regression is a linear approach for modelling the relationship between a scalar response and one or more explanatory variables. The case of one explanatory variable is called simple linear regression; for more than one, the process is called multiple linear regression. This term is distinct from multivariate linear regression, where multiple correlated dependent variables are predicted, rather than a single scalar variable.
References
- 1 2 Mandel, B.J (1969) "The Regression Control Chart", Journal of Quality Technology, 1 (1), 1–9