Safety in numbers

Last updated
Critical Mass, San Francisco, April 29, 2005 and Muni Metro tram on J Church line Critical Mass, San Francisco, April 29, 2005.jpg
Critical Mass, San Francisco, April 29, 2005 and Muni Metro tram on J Church line

Safety in numbers is the hypothesis that, by being part of a large physical group or mass, an individual is less likely to be the victim of a mishap, accident, attack, or other bad event. Some related theories also argue (and can show statistically)[ citation needed ] that mass behaviour (by becoming more predictable and "known" to other people) can reduce accident risks, such as in traffic safety – in this case, the safety effect creates an actual reduction of danger, rather than just a redistribution over a larger group.

Contents

In biology

The mathematical biologist W.D. Hamilton proposed his selfish herd theory in 1971 to explain why animals seek central positions in a group. Each individual can reduce its own domain of danger by situating itself with neighbours all around, so it moves towards the centre of the group. [1] The effect was tested in brown fur seal predation by great white sharks. Using decoy seals, the distance between decoys was varied to produce different domains of danger. The seals with a greater domain of danger had as predicted an increased risk of shark attack. [2] Antipredator adaptations include behaviour such as the flocking of birds, herding of sheep [3] and schooling of fish. [4] Similarly, Adelie penguins wait to jump into the water until a large enough group has assembled, reducing each individual's risk of seal predation. [5] This behavior is also seen in masting and predator satiation where the predators are overwhelmed with an abundance of prey during a period of time resulting in more of the prey surviving.

In road traffic safety

Amsterdam, 1982 Fietsdemonstratie in Amsterdam tegen de autoterreur, ongeveer 15.000 deelnemer, Bestanddeelnr 932-1612.jpg
Amsterdam, 1982

In 1949 R. J. Smeed reported that per capita road fatality rates tended to be lower in countries with higher rates of motor vehicle ownership. [6] This observation led to Smeed's Law.

In 2003 P. L. Jacobsen [7] compared rates of walking and cycling, in a range of countries, with rates of collisions between motorists and cyclists or walkers. He found an inverse relationship that was hypothesised to be explained by a concept described as 'behavioural adaptation', whereby drivers who are exposed to greater numbers of cyclists on the road begin to drive more safely around them. Though an attractive concept for cycling advocates, it has not been empirically validated. Other combined modelling [8] [9] and empirical evidence suggests that while changes in driver behaviour might still be one way that collision risk per cyclist declines with greater numbers, [10] the effect can be easily produced through simple spatial processes akin to the biological herding processes described above. [11]

Without considering hypotheses 1 or 3, Jacobsen concluded that "A motorist is less likely to collide with a person walking and bicycling if more people walk or bicycle." He described this theory as "safety in numbers." [7]

Safety in numbers is also used to describe the evidence that the number of pedestrians or cyclists correlates inversely with the risk of a motorist colliding with a pedestrian or cyclist. This non-linear relationship was first shown at intersections. [12] [13] It has been confirmed by ecologic data from cities in California and Denmark, and European countries, and time-series data for the United Kingdom and the Netherlands. [7] The number of pedestrians or bicyclists injured increases at a slower rate than would be expected based on their numbers. That is, more people walk or cycle where the risk to the individual pedestrian or bicyclist is lower. [14] [15] A 2002 study into whether pedestrian risk decreased with pedestrian flow, using 1983-86 data from signalized intersections in a town in Canada, found that in some circumstances pedestrian flow increased where the risk per pedestrian decreased. [16]

After cycling was promoted in Finland, there was a 75% drop in cyclists deaths and the number of trips increased by 72%. [17]

In England, between 2000 and 2008, serious bicycle injuries declined by 12%. Over the same period, the number of bicycle trips made in London doubled. [18] [19] [20] Motor vehicle traffic decreased by 16%, bicycle use increased by 28% and cyclist injuries had decreased by 20% in the first year of operation of the London Congestion Charge. [21] In January 2008, the number of cyclists in London being treated in hospitals for serious injuries had increased by 100% in six years. Over the same time, they report, the number of cyclists had increased by 84%. [22] In York, comparing the periods 1991-93 and 1996–98, the number of bicyclists killed and seriously injured fell by 59%. The share of trips made by bicycle rose from 15% to 18%. [23]

In Germany, between 1975 and 2001, the total number of bicycle trips made in Berlin almost quadrupled. Between 1990 and 2007, the share of trips made by bicycle increased from 5% to 10%. Between 1992 and 2006, the number of serious bicycle injuries declined by 38%. [24] [25] In Germany as a whole, between 1975 and 1998, cyclist fatalities fell by 66% and the percent of trips made by bicycle rose from 8% to 12%. [26]

In America, during the period 1999-2007, the absolute number of cyclists killed or seriously injured decreased by 29% and the amount of cycling in New York city increased by 98%. [27] [28] [29] In Portland, Oregon, between 1990 and 2000, the percentage of workers who commuted to work by bicycle rose from 1.1% to 1.8%. By 2008, the proportion has risen to 6.0%; while the number of workers increased by only 36% between 1990 and 2008, the number of workers commuting by bicycle increased 608%. Between 1992 and 2008, the number of bicyclists crossing four bridges into downtown was measured to have increased 369% between 1992 and 2008. During that same period, the number of reported crashes increased by only 14%. [30] [31] [32]

In Copenhagen, Denmark, between 1995 and 2006, the number of cyclists killed or seriously injured fell by 60%. During the same period, cycling increased by 44% and the percent of people cycling to work increased from 31% to 36%. [33]

In the Netherlands, between 1980 and 2005, and cyclist fatalities decreased by 58% and cycling increased by 45%. [34]

During 7 years of the 1980s, admissions to hospital of cyclists declined by 5% and cycling in Western Australia increased by 82%. [35]

See also

Related Research Articles

<span class="mw-page-title-main">Cycling</span> Riding a bicycle

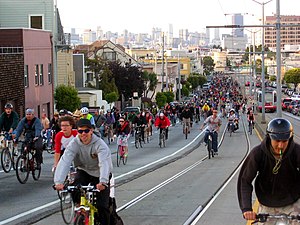
Cycling, also known as bicycling or biking, is the activity of riding a bicycle or other type of cycle. It encompasses the use of human-powered vehicles such as balance bikes, unicycles, tricycles, and quadricycles. Cycling is practised around the world for purposes including transport, recreation, exercise, and competitive sport.

<span class="mw-page-title-main">High-visibility clothing</span> Safety clothing

High-visibility clothing, sometimes shortened to hi vis or hi viz, is any clothing worn that is highly luminescent in its natural matt property or a color that is easily discernible from any background. It is most commonly worn on the torso and arm area of the body. Health and safety regulations often require the use of high visibility clothing as it is a form of personal protective equipment. Many colors of high visibility vests are available, with yellow and orange being the most common examples. Colors other than yellow or orange may not provide adequate luminescence for conformity to standards such as ISO 20471.

<span class="mw-page-title-main">Road traffic safety</span> Methods and measures for reducing the risk of death and injury on roads

Road traffic safety refers to the methods and measures used to prevent road users from being killed or seriously injured. Typical road users include pedestrians, cyclists, motorists, vehicle passengers, and passengers of on-road public transport.

<span class="mw-page-title-main">Utility cycling</span> Bicycling as transportation

Utility cycling encompasses any cycling done simply as a means of transport rather than as a sport or leisure activity. It is the original and most common type of cycling in the world. Cycling mobility is one of the various types of private transport and a major part of individual mobility.

<span class="mw-page-title-main">Bicycle helmet</span> Type of helmet

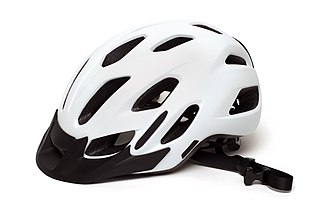
A bicycle helmet is a type of helmet designed to attenuate impacts to the head of a cyclist in collisions while minimizing side effects such as interference with peripheral vision.

<span class="mw-page-title-main">Risk compensation</span> Behavioral theory

Risk compensation is a theory which suggests that people typically adjust their behavior in response to perceived levels of risk, becoming more careful where they sense greater risk and less careful if they feel more protected. Although usually small in comparison to the fundamental benefits of safety interventions, it may result in a lower net benefit than expected or even higher risks.

<span class="mw-page-title-main">Rumble strip</span> Road safety feature

Rumble strips are a road safety feature to alert inattentive drivers of potential danger, by causing a tactile vibration and audible rumbling transmitted through the wheels into the vehicle interior. A rumble strip is applied along the direction of travel following an edgeline or centerline, to alert drivers when they drift from their lane. Rumble strips may also be installed in a series across the direction of travel, to warn drivers of a stop or slowdown ahead, or of an approaching danger spot.

Closed-head injury is a type of traumatic brain injury in which the skull and dura mater remain intact. Closed-head injuries are the leading cause of death in children under 4 years old and the most common cause of physical disability and cognitive impairment in young people. Overall, closed-head injuries and other forms of mild traumatic brain injury account for about 75% of the estimated 1.7 million brain injuries that occur annually in the United States. Brain injuries such as closed-head injuries may result in lifelong physical, cognitive, or psychological impairment and, thus, are of utmost concern with regards to public health.

<span class="mw-page-title-main">Vehicular cycling</span> Practice of riding bicycles on roads while obeying roadway rules

Vehicular cycling is the practice of riding bicycles on roads in a manner that is in accordance with the principles for driving in traffic, and in a way that places responsibility for safety on the individual.

<span class="mw-page-title-main">Dooring</span> Type of cycling accident

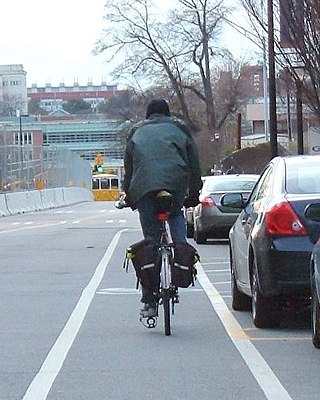
Dooring is the act of opening a motor vehicle door into the path of another road user. Dooring can happen when a driver has parked or stopped to exit their vehicle, or when passengers egress from cars, taxis and rideshares into the path of a cyclist in an adjacent travel lane. The width of the door zone in which this can happen varies, depending upon the model of car one is passing. The zone can be almost zero for a vehicle with sliding or gull-wing doors or much larger for a truck. In many cities across the globe, doorings are among the most common and injurious bike-vehicle incidents. Any passing vehicle may also strike and damage a negligently opened or left open door, or injure or kill the exiting motorist or passenger.

<span class="mw-page-title-main">Bicycle safety</span> Safety practices to reduce risk associated with cycling

Bicycle safety is the use of road traffic safety practices to reduce risk associated with cycling. Risk can be defined as the number of incidents occurring for a given amount of cycling. Some of this subject matter is hotly debated: for example, which types of cycling environment or cycling infrastructure is safest for cyclists. The merits of obeying the traffic laws and using bicycle lighting at night are less controversial. Wearing a bicycle helmet may reduce the chance of head injury in the event of a crash.

<span class="mw-page-title-main">Walking bus</span> Chaperoned student group on foot

A walking bus is a form of student transport for young schoolchildren who, chaperoned typically by two adults, walk. The crocodile may walk to school along a set route, with some similarities to a school bus route, with designated "bus stops" and "pick up times" at which they pick up and "drop off" children. In Britain a group of schoolchildren walking together in a long line of pairs on an activity without stops or pickups, escorted by teachers, has been referred to as a crocodile since at least 1870.

<span class="mw-page-title-main">Cycle track</span> Cycleway between a road and sidewalk, protected by barriers

A cycle track or cycleway (British) or bikeway, sometimes historically referred to as a sidepath, is a separate route for cycles and not motor vehicles. In some cases cycle tracks are also used by other users such as pedestrians and horse riders. A cycle track can be next to a normal road, and can either be a shared route with pedestrians or be made distinct from both the pavement and general roadway by vertical barriers or elevation differences.

Bicycle helmets have been mandatory in New Zealand since January 1994. The statute, delineated in Part 11 of the Land Transport Rule 2004, states that "A person must not ride, or be carried on, a bicycle on a road unless the person is wearing a safety helmet of an approved standard that is securely fastened." The law describes six different acceptable helmet standards.

<span class="mw-page-title-main">Active mobility</span> Unmotorised transport powered by activity

Active mobility, soft mobility, active travel, active transport or active transportation is the transport of people or goods, through non-motorized means, based around human physical activity. The best-known forms of active mobility are walking and cycling, though other modes include running, rowing, skateboarding, kick scooters and roller skates. Due to its prevalence, cycling is sometimes considered separately from the other forms of active mobility.

<span class="mw-page-title-main">Bicycle helmet laws</span>

Some countries and lower jurisdictions have enacted laws or regulations which require cyclists to wear a helmet in certain circumstances, typically when riding on the road or a road-related area. In some places this requirement applies only to children under a certain age, while in others it applies to cyclists of all ages.

<span class="mw-page-title-main">Cycling infrastructure</span> Facilities for use by cyclists

Cycling infrastructure is all infrastructure cyclists are allowed to use. Bikeways include bike paths, bike lanes, cycle tracks, rail trails and, where permitted, sidewalks. Roads used by motorists are also cycling infrastructure, except where cyclists are barred such as many freeways/motorways. It includes amenities such as bike racks for parking, shelters, service centers and specialized traffic signs and signals. The more cycling infrastructure, the more people get about by bicycle.

The history of cycling infrastructure starts from shortly after the bike boom of the 1880s when the first short stretches of dedicated bicycle infrastructure were built, through to the rise of the automobile from the mid-20th century onwards and the concomitant decline of cycling as a means of transport, to cycling's comeback from the 1970s onwards.

<span class="mw-page-title-main">Protected intersection</span> At-grade road junction in which cyclists and pedestrians are separated from cars

A protected intersection or protected junction, also known as a Dutch-style junction, is a type of at-grade road junction in which cyclists and pedestrians are separated from cars. The primary aim of junction protection is to help pedestrians and cyclists be and feel safer at road junctions.

<span class="mw-page-title-main">Safety of cycling infrastructure</span> Overview of bicycle safety concerns

There is debate over the safety implications of cycling infrastructure. Recent studies generally affirm that segregated cycle tracks have a better safety record between intersections than cycling on major roads in traffic. Furthermore, cycling infrastructure tends to lead to more people cycling. A higher modal share of people cycling is correlated with lower incidences of cyclist fatalities, leading to a "safety in numbers" effect though some contributors caution against this hypothesis. On the contrary, older studies tended to come to negative conclusions about mid-block cycle track safety.

References

  1. Hamilton, W. (1971). "Geometry for the selfish herd". Journal of Theoretical Biology. 31 (2): 295–311. Bibcode:1971JThBi..31..295H. doi:10.1016/0022-5193(71)90189-5. PMID   5104951.
  2. De Vos, Alta; O'Riain, M. Justin (2010). "Sharks shape the geometry of a selfish seal herd: experimental evidence from seal decoys". Biology Letters. 6 (1): 48–50. doi:10.1098/rsbl.2009.0628. PMC   2817263 . PMID   19793737.
  3. King, Andrew J.; Wilson, Alan M.; Wilshin, Simon D.; Lowe, John; Haddadi, Hamed; Hailes, Stephen; Morton, A. Jennifer (2012). "Selfish-herd behaviour of sheep under threat" (PDF). Current Biology. 22 (14): R561–R562. doi: 10.1016/j.cub.2012.05.008 . PMID   22835787. S2CID   208514093.
  4. Orpwood, James E.; Magurran, Anne E.; Armstrong, John D.; Griffiths, Siân W. (2008). "Minnows and the selfish herd: effects of predation risk on shoaling behaviour are dependent on habitat complexity". Animal Behaviour. 76 (1): 143–152. doi:10.1016/j.anbehav.2008.01.016. S2CID   53177480.
  5. Alcock, John (2001). Animal Behavior: An Evolutionary Approach. Sunderland, MA: Sinauer Associates.
  6. Smeed, R. J. (1949-01-01). "Some Statistical Aspects of Road Safety Research". Journal of the Royal Statistical Society. Series A (General). 112 (1): 1–34. doi:10.2307/2984177. JSTOR   2984177.
  7. 1 2 3 Jacobsen, P. L. (2003). "Safety in numbers: more walkers and bicyclists, safer walking and bicycling". Injury Prevention. 9 (3): 205–209. doi:10.1136/ip.9.3.205. PMC   1731007 . PMID   12966006. A motorist is less likely to collide with a person walking and bicycling if more people walk or bicycle.
  8. Thompson, Jason; Savino, Giovanni; Stevenson, Mark (2015-02-17). "Reconsidering the Safety in Numbers Effect for Vulnerable Road Users: An Application of Agent-Based Modeling". Traffic Injury Prevention. 16 (2): 147–153. doi:10.1080/15389588.2014.914626. ISSN   1538-9588. PMID   24761795. S2CID   25074848.
  9. Thompson, Jason; Wijnands, Jasper S.; Savino, Giovanni; Lawrence, Brendan; Stevenson, Mark (2017-08-01). "Estimating the safety benefit of separated cycling infrastructure adjusted for behavioral adaptation among drivers; an application of agent-based modelling". Transportation Research Part F: Traffic Psychology and Behaviour. 49: 18–28. doi:10.1016/j.trf.2017.05.006. ISSN   1369-8478.
  10. Thompson, Jason; Savino, Giovanni; Stevenson, Mark (2016-03-01). "A model of behavioural adaptation as a contributor to the safety-in-numbers effect for cyclists". Transportation Research Part A: Policy and Practice. 85: 65–75. doi:10.1016/j.tra.2015.12.004. ISSN   0965-8564.
  11. Thompson, Jason Hugh; Wijnands, Jasper S.; Mavoa, Suzanne; Scully, Katherine; Stevenson, Mark R. (2019-10-01). "Evidence for the 'safety in density' effect for cyclists: validation of agent-based modelling results". Injury Prevention. 25 (5): 379–385. doi:10.1136/injuryprev-2018-042763. hdl: 11343/224043 . ISSN   1353-8047. PMID   30315090. S2CID   52977216.
  12. Brüde, U., Larsson, J. (1993). "Models for predicting accidents at junctions where pedestrians and cyclists are involved. How well do they fit?". Accident Analysis and Prevention. 25 (5): 499–509. doi:10.1016/0001-4575(93)90001-D. PMID   8397652. According to results obtained, the risk - the number of accidents involving unprotected road users per unprotected road user - increases with increasing numbers of motor vehicles but decreases with increasing numbers of pedestrians and cyclists.{{cite journal}}: CS1 maint: multiple names: authors list (link)
  13. Leden, L., Gårder, P., Pulkkinen, U. (2000). "An expert judgment model applied to estimating the safety effect of a bicycle facility". Accident Analysis and Prevention. 32 (4): 589–599. doi:10.1016/S0001-4575(99)00090-1. PMID   10868762. An analysis of the relationship between bicycle flow and the number of reported accidents in the experimental area shows that the relative risk — when risk is defined as the number of expected (reportable) accidents per passing bicyclist — decreases with increasing bicycle flow{{cite journal}}: CS1 maint: multiple names: authors list (link)
  14. Elvik, R. (2009). "The non-linearity of risk and the promotion of environmentally sustainable transport". Accident Analysis and Prevention. 41 (4): 849–855. doi:10.1016/j.aap.2009.04.009. PMID   19540975. Several studies show that the risks of injury to pedestrians and cyclists are highly non-linear. This means that the more pedestrians or cyclists there are, the lower is the risk faced by each pedestrian or cyclist.
    • Geyer, J. Raford, N., Pham, T., Ragland, D. (2006). "Safety in Numbers: Data from Oakland, California". Transportation Research Record. 1982: 150–154. doi:10.3141/1982-20. Estimates of the model parameters show that the number of pedestrian collisions increases more slowly than the number of pedestrians; that is, the collision rate decreases as the number of pedestrians increases, consistent with previous studies by Leden and Jacobsen. Specifically, a doubling of the number of pedestrians (increase of 100%) is associated with only a 52% increase in the number of vehicle-pedestrian collisions, with the corresponding rate decreasing by about 24%.{{cite journal}}: CS1 maint: multiple names: authors list (link)
    • Miranda-Moreno, L., Strauss, J., Morency, P. (2011). "Disaggregate Exposure Measures and Injury Frequency Models of Cyclist Safety at Signalized Intersections". Transportation Research Record. 2236 (2236): 74–82. doi:10.3141/2236-09. S2CID   109595322. A 10% increase in bicycle flow was associated with a 4.4% increase in the frequency of cyclist injuries.{{cite journal}}: CS1 maint: multiple names: authors list (link)
    • Raford, N., Ragland, D. (2004). "Space Syntax: Innovative Pedestrian Volume Modeling Tool for Pedestrian Safety". Transportation Research Record. 1978: 66–74. doi:10.3141/1878-09. S2CID   109182801. Downtown intersections experience slightly more pedestrian–vehicle collisions per year than the intersections in East Oakland but carry approximately three times as many pedestrians annually, indicating lower annual accident rate per pedestrian than that in East Oakland.{{cite journal}}: CS1 maint: multiple names: authors list (link)
    • Schneider, R., Chagas Diogenes, M., Arnold, L., Attaset, V., Griswold, J., Ragland, D. (2010). "Association Between Roadway Intersection Characteristics and Pedestrian Crash Risk in Alameda County, California" (PDF). Transportation Research Record. 2198: 41–51. doi: 10.3141/2198-06 . S2CID   110856635. [a]s the pedestrian volume increases, the expected number of pedestrian crashes increases at a decreasing rate (Figure 1a). As the pedestrian volume increases, the expected risk of a crash for each individual crossing decreases (Figure 1b).{{cite journal}}: CS1 maint: multiple names: authors list (link)
    • Harwood, D.W., Torbic, D.J., Gilmore, D.K., Bokenkroger, C.D., Dunn, J.M., Zegeer, C.V., Srinivasan, R., Carter, D., Raborn, C., Lyon, C., Persaud, B. (2008). "Pedestrian Safety Prediction Methodology" (PDF). NCHRP Web-only Document 129: Phase III. Transportation Research Board, Washington, DC. doi:10.17226/23083. ISBN   978-0-309-42944-3.{{cite journal}}: CS1 maint: multiple names: authors list (link)
    • Jonsson, T. (2005). "Pedestrian Safety Prediction Methodology". Predictive Models for Accidents on Urban Links. A Focus on Vulnerable Road Users. Ph.D. Dissertation. Bulletin 226. Lund Institute of Technology, Department of Technology and Society, Traffic Engineering, Lund. The validation indicated that exponents were 0.5 for both the flows of pedestrians and motor vehicles in models for accidents involving vulnerable road users, and 1.0 for the motor vehicle flow exponent in the models for motor vehicle accidents. For bicyclist accidents the correct exponent for bicyclist flows is likely to be somewhat lower than 0.5, close to 0.35.
    • Lyon, C., Persaud, B.N. (2002). "Pedestrian collision prediction models for urban intersections". Transportation Research Record. 1818: 102–107. doi:10.3141/1818-16. S2CID   109584040. Collisions are estimated to increase with AADT and pedestrian volumes, although these relationships are nonlinear (as shown by the exponents of AADT and PEDS being significantly less than 1). This would confirm that the use of collision rates is based on an erroneous assumption of a linear relationship between collisions and volumes.{{cite journal}}: CS1 maint: multiple names: authors list (link)
    • Robinson, D.L. (2005). "Safety in numbers in Australia: more walkers and bicyclists, safer walking and cycling". Health Promotion Journal of Australia. 16 (1): 47–51. doi:10.1071/he05047. PMID   16389930. S2CID   1780497. As with overseas data, the exponential growth rule fits Australian data well. If cycling doubles, the risk per kilometre falls by about 34%; conversely, if cycling halves, the risk per kilometre will be about 52% higher.
    • Jensen, S. U., Andersen, T., Hansen, W., Kjærgaard, E., Krag, T., Larsen, J.E., Lund, B.L. Thost, P. (2000). "Collection of Cycle Concepts" (PDF). Road Directorate, Denmark. p. 15.{{cite web}}: CS1 maint: multiple names: authors list (link)
    • Jensen, S.U. (1998). "DUMAS – Safety of Pedestrians and Two-wheelers". Road Directorate, Denmark. pp. Note 51. when pedestrian and cycle traffic increases, the casualty rate per kilometre decreases.{{cite web}}: Missing or empty |url= (help)
    • Elvik, R. (2009). "The non-linearity of risk and the promotion of environmentally sustainable transport". Accident Analysis and Prevention. 41 (4): 849–855. doi:10.1016/j.aap.2009.04.009. PMID   19540975.
    • Daniels, S., Brijs, T., Nuyts, E., Wets, G. (2010). "Explaining variation in safety performance of roundabouts". Accident Analysis and Prevention. 42 (2): 393–402. doi:10.1016/j.aap.2009.08.019. hdl: 1942/10800 . PMID   20159059. Confirmation is found for the existence of a safety in numbers-effect for bicyclists, moped riders and – with less certainty – for pedestrians at roundabouts.{{cite journal}}: CS1 maint: multiple names: authors list (link)
    • Vandenbulcke, G., Thomas, I., de Geus, B., Degraeuwe, B., Torfs, R., Meeusen, R., Panis, L.I. (2009). "Mapping bicycle use and the risk of accidents for commuters who cycle to work in Belgium". Transport Policy. 16 (2): 77–87. doi:10.1016/j.tranpol.2009.03.004. Table2 shows that -- as expected -- the risk of cyclists becoming casualties of road accidents decreases as the proportion of cyclists increases.{{cite journal}}: CS1 maint: multiple names: authors list (link)
    • Ekman L. (1996). "On the treatment of flow in traffic safety analysis — a non-parametric approach applied on vulnerable road users". Lund, Sweden: Institutionen för Trafikteknik, Lunds Tekniska Högskola. Bulletin. 136. the conflict rate for bicyclists is twice as large at locations with low bicycle flow compared to locations with higher flow
    • Turner, S.A., Roozenburg, A.P., Francis, T. (2006). "Predicting accident rates for cyclists and pedestrians" (PDF). Land Transport New Zealand. Research. Report 289. A 'safety in numbers' effect is observed for cycle accidents at traffic signals, roundabouts and mid-block sites. An increase in cycle numbers will not therefore necessarily increase the number of accidents substantially. A 'safety in numbers' effect is also observed for pedestrian accidents at traffic signals and mid-block sites. Insufficient data exists to conclude whether a 'safety in numbers' effect occurs at roundabouts{{cite journal}}: CS1 maint: multiple names: authors list (link)
    • Turner, S.A., Binder, S., Roozenburg, A.P. (2009). "Cycle Safety: Reducing the Crash Risk" (PDF). Land Transport New Zealand. Research. Report 389. As shown in figure 2.20, an increase in the proportion of cyclists to the overall traffic volume causes an increase in expected crashes at mid-block locations, but the crash rate increases at a decreasing rate. That is to say, the crash rate per cyclist goes down as the cycle volume increases.{{cite journal}}: CS1 maint: multiple names: authors list (link)
    • Knowles, J., Adams, S., Cuerden, R., Savill, T. Reid, S., Tight, M. (2009). "Collisions involving pedal cyclists on Britain's roads: establishing the causes". Transport Research Laboratory Published Project. Report. PPR445. The research assessed as part of this study is strongly suggestive that a safety in numbers effect exists.{{cite journal}}: CS1 maint: multiple names: authors list (link)
    • Noland, R.B., Quddus, M.A., Ochieng, W.Y. (2008). "The effect of the London congestion charge on road casualties: an intervention analysis". Transportation . 35 (1): 73–91. doi:10.1007/s11116-007-9133-9. S2CID   55834633. While motorcycle casualties in Inner London seem to have increased after implementation of the congestion charge no similar effect is found for bicycle casualties. This is despite an increase in bicycle usage within the congestion charging zone.{{cite journal}}: CS1 maint: multiple names: authors list (link)
    • Ministerie van Verkeer en Waterstaat (2009). "Cycling in the Netherlands" (PDF): 14.{{cite journal}}: Cite journal requires |journal= (help)
    • Pucher J.; Dijkstra L. (2000). "Making walking and cycling safer: lessons from Europe" (PDF). Transportation Quarterly. 54 (3): 25–50.
    • Turner S.A., Wood, G.R., Luo, Q., Singh, R., Allatt, T. J., Affiliation: Civil and Natural Resources Engineering, University of Canterbury, New Zealand; Macquarie University, NSW, Australia; Beca Infrastructure Ltd, New Zealand. (2010). "Crash prediction models and the factors that influence cycle safety". Australas Coll Road Saf. 21 (3): 26–36. The key finding is that as cycle volumes increase, the risk per individual cyclist reduces - the 'safety in numbers' effect.{{cite journal}}: CS1 maint: multiple names: authors list (link)
    • Tin Tin, S., Woodward, A., Thornley, S., Ameratunga, S. (2011). "Regional variations in pedal cyclist injuries in New Zealand: safety in numbers or risk in scarcity?". Australian and New Zealand Journal of Public Health. 35 (4): 357–363. doi: 10.1111/j.1753-6405.2011.00731.x . PMID   21806731. S2CID   7600595. The injury rate increased with decreasing per capita time spent cycling.{{cite journal}}: CS1 maint: multiple names: authors list (link)
    • Daniels, S., Brijs, T., Nuyts, E., Wets, G (2011). "Extended prediction models for crashes at roundabouts". Safety Science. 49 (2): 198–207. doi:10.1016/j.ssci.2010.07.016. Confirmation is found for the existence of a 'safety-in-numbers' effect for different types of road users.{{cite journal}}: CS1 maint: multiple names: authors list (link)
    • de Geus B; Vandenbulcke G; Int Panis L; Thomas I; Degraeuwe B; Cumps E; Aertsens J; Torfs R; Meeusen R. (2012). "A prospective cohort study on minor accidents involving commuter cyclists in Belgium". Accident Analysis & Prevention. 45 (2): 683–693. doi:10.1016/j.aap.2011.09.045. PMID   22269558. The 'safety in numbers' principle is also applicable for minor bicycle accidents.
    • Nordback K; Marshall W; Janson B (2014). "Bicyclist safety performance functions for a U.S. city". Accident Analysis & Prevention. 65: 114–122. doi:10.1016/j.aap.2013.12.016. PMID   24448471. intersections with more cyclists have fewer collisions per cyclist, illustrating that cyclists are safer in numbers
  15. Leden, L. (2002). "Pedestrian risk decrease with pedestrian flow. A case study based on data from signalized intersections in Hamilton, Ontario". Accident Analysis and Prevention. 34 (4): 457–464. doi:10.1016/S0001-4575(01)00043-4. PMID   12067108. When risks for pedestrians were calculated as the expected number of reported pedestrian accidents per pedestrian, risk decreased with increasing pedestrian flows and increased with increasing vehicle flow.
  16. CBA of Cycling. Nordic Council of Ministers. 2005.
  17. "The London Cycling Action Plan. Transport for London, London, UK" (PDF). Transport for London. 2004.
  18. "Cycling in London: Final report. Transport for London, London" (PDF). Transport for London. 2008.
  19. "Central London congestion charging: Impacts monitoring, Sixth Annual Report. Transport for London, London". Transport for London. 2008. Archived from the original on 2013-07-11. Retrieved 2020-03-29.
  20. Transport for London (April 2005). "Congestion Charging: Third Annual Monitoring Report" (PDF).
  21. Nicholas Cecil (2008-01-28). "Number of cyclists treated for serious injuries doubles". Evening Standard. Archived from the original on 2008-01-29. Retrieved 2008-01-30.
  22. Harrison, J. (2001). "Planning for more cycling: The York experience bucks the trend". World Transport Policy & Practice. 7 (4).
  23. Senatsverwaltung fuer Stadtentwicklung. Office of Urban Development, Berlin, Germany (2003). "Focus on bicycling".{{cite journal}}: Cite journal requires |journal= (help)CS1 maint: multiple names: authors list (link)
  24. Pucher, J. & Buehler, R. (2007). "At the frontiers of cycling: Policy innovations in the Netherlands, Denmark, and Germany". World Transp. Policy Pract. 13 (3): 8–57.
  25. Pucher, J. & Dijkstra, L. (2000). "Making walking and cycling safer: lessons from Europe". Transportation Quarterly. 54 (3): 25–50. hdl:2027/mdp.39015047810828.
  26. NYC DOT (2008). "Safe Streets NYC: Traffic Safety Improvements in New York City".{{cite journal}}: Cite journal requires |journal= (help)
  27. A Joint Report from the New York City Departments of Health and Mental Hygiene, Parks and Recreation, Transportation, and the New York City Police Department (2005). "Bicyclist Fatalities and Serious Injuries in New York City 1996-2005".{{cite journal}}: Cite journal requires |journal= (help)CS1 maint: multiple names: authors list (link)
  28. "New York City Commuter cyclist indicator" (PDF).{{cite journal}}: Cite journal requires |journal= (help)
  29. US Census Bureau (2009). "U.S. Census website" . Retrieved 2020-03-29.{{cite journal}}: Cite journal requires |journal= (help)
  30. City of Portland, Portland Bureau of Transportation (2008). "Portland bicycle counts 2008".{{cite journal}}: Cite journal requires |journal= (help)
  31. City of Portland (2008). "Portland's 2008 bicycle friendly community application, Portland, OR".{{cite journal}}: Cite journal requires |journal= (help)
  32. City of Copenhagen Traffic Department (2007). "Copenhagen, city of cyclists: bicycle account 2006" (PDF). Archived from the original (PDF) on 2011-07-19. Retrieved 2010-10-14.{{cite journal}}: Cite journal requires |journal= (help)
  33. Ministerie van Verkeer en Waterstaat (2007). "Cycling in the Netherlands".{{cite journal}}: Cite journal requires |journal= (help)
  34. Robinson, D. (2005). "Safety in numbers in Australia: more walkers and bicyclists, safer walking and bicycling" (PDF). Health Promotion Journal of Australia. 16 (1): 47–51. doi:10.1071/he05047. PMID   16389930.