Spectrochemistry

Last updated

Spectrochemistry is the application of spectroscopy in several fields of chemistry. It includes analysis of spectra in chemical terms, and use of spectra to derive the structure of chemical compounds, and also to qualitatively and quantitively analyze their presence in the sample. It is a method of chemical analysis that relies on the measurement of wavelengths and intensity of electromagnetic radiation . [1]

Contents

Dichloromethane IR Spectrum Dichloromethane IR Spectrum.png
Dichloromethane IR Spectrum

History

Isaac Newton - English mathematician and Physicist Isaac Newton.png
Isaac Newton - English mathematician and Physicist
Joseph Von Fraunhofer- Bavarian Physicist Joseph von Fraunhofer, engraving by Christian Gottlob Scherff.jpg
Joseph Von Fraunhofer- Bavarian Physicist
Gustav Kirchhoff - German Physicist Gustav Kirchhoff (mezzo busto).jpg
Gustav Kirchhoff - German Physicist
Thomas Young - British Polymath Thomas Young by Thomas Lawrence.jpg
Thomas Young - British Polymath

It was not until 1666 that Isaac Newton showed that white lights from the sun could be dissipated into a continuous series of colors. So Newton introduced the concept which he called spectrum to describe this phenomenon. He used a small aperture to define the beam of light, a lens to collimate it, a glass prism to disperse it, and a screen to display the resulting spectrum. Newton's analysis of light was the beginning of the science of spectroscopy. Later, It became clear that the Sun's radiation might have components outside the visible portion of the spectrum. In 1800 William Hershel showed that the sun's radiation extended into infrared, and in 1801 John Wilhelm Ritter also made a similar observation in the ultraviolet . Joseph Von Fraunhofer extended Newton's discovery by observing the sun's spectrum when sufficiently dispersed was blocked by a fine dark lines now known as Fraunhofer lines. Fraunhofer also developed diffracting grating, which disperses the lights in much the same way as does a glass prism but with some advantages. the grating applied interference of lights to produce diffraction provides a direct measuring of wavelengths of diffracted beams. So by extending Thomas Young's study which demonstrated that a light beam passes slit emerges in patterns of light and dark edges Fraunhofer was able to directly measure the wavelengths of spectral lines. However, despite his enormous achievements, Fraunhofer was unable to understand the origins of the special line in which he observed. It was not until 33 years after his passing that Gustav Kirchhoff established that each element and compound has its unique spectrum and that by studying the spectrum of an unknown source, one could determine its chemical compositions, and with these advancements, spectroscopy became a truly scientific method of analyzing the structures of chemical compounds. Therefore, by recognizing that each atom and molecule has its spectrum Kirchhoff and Robert Bunsen established spectroscopy as a scientific tool for probing atomic and molecular structures and founded the field of spectrochemical analysis for analyzing the composition of materials. [3]

Robert Bunsen - German Chemist Bunsen Robert.jpg
Robert Bunsen - German Chemist

IR Spectra Tables & Charts

IR Spectrum Table by Frequency [4]

Frequency RangeAbsorption (cm−1)AppearanceGroupCompound ClassComments
4000–3000 cm−13700-3584medium, sharpO-H stretchingalcoholfree
3550-3200strong, broadO-H stretchingalcoholintermolecular bonded
3500mediumN-H stretchingprimary amine
3400
3400-3300mediumN-H stretchingaliphatic primary amine
3330-3250
3350-3310mediumN-H stretchingsecondary amine
3300-2500strong, broadO-H stretchingcarboxylic acidusually centered on 3000 cm−1
3200-2700weak, broadO-H stretchingalcoholintramolecular bonded
3000-2800strong, broadN-H stretchingamine salt
3000–2500 cm−1
3000–2500 cm−13333-3267strong, sharpC-H stretchingalkyne
3100-3000mediumC-H stretchingalkene
3000-2840mediumC-H stretchingalkane
2830-2695mediumC-H stretchingaldehydedoublet
2600-2550weakS-H stretchingthiol
2400–2000 cm−1
2400–2000 cm−12349strongO=C=O stretchingcarbon dioxide
2275-2250strong, broadN=C=O stretchingisocyanate
2260-2222weakCΞN stretchingnitrile
2260-2190weakCΞC stretchingalkynedisubstituted
2175-2140strongS-CΞN stretchingthiocyanate
2160-2120strongN=N=N stretchingazide
2150C=C=O stretchingketene
2145-2120strongN=C=N stretchingcarbodiimide
2140-2100weakCΞC stretchingalkynemonosubstituted
2140-1990strongN=C=S stretchingisothiocyanate
2000-1900mediumC=C=C stretchingallene
2000C=C=N stretchingketenimine
2000–1650 cm−1
2000–1650 cm−12000-1650weakC-H bendingaromatic compoundovertone
1870-1540
1818strongC=O stretchinganhydride
1750
1815-1785strongC=O stretchingacid halide
1800-1770strongC=O stretchingconjugated acid halide
1775strongC=O stretchingconjugated anhydride
1720
1770-1780strongC=O stretchingvinyl / phenyl ester
1760strongC=O stretchingcarboxylic acidmonomer
1750-1735strongC=O stretchingesters6-membered lactone
1750-1735strongC=O stretchingδ-lactoneγ: 1770
1745strongC=O stretchingcyclopentanone
1740-1720strongC=O stretchingaldehyde
1730-1715strongC=O stretchingα,β-unsaturated esteror formates
1725-1705strongC=O stretchingaliphatic ketoneor cyclohexanone or cyclopentenone
1720-1706strongC=O stretchingcarboxylic aciddimer
1710-1680strongC=O stretchingconjugated aciddimer
1710-1685strongC=O stretchingconjugated aldehyde
1690strongC=O stretchingprimary amidefree (associated: 1650)
1690-1640mediumC=N stretchingimine / oxime
1685-1666strongC=O stretchingconjugated ketone
1680strongC=O stretchingsecondary amidefree (associated: 1640)
1680strongC=O stretchingtertiary amidefree (associated: 1630)
1650strongC=O stretchingδ-lactamγ: 1750-1700 β: 1760-1730
1670–1600 cm−1
1670–1600 cm−11678-1668weakC=C stretchingalkenedisubstituted (trans)
1675-1665weakC=C stretchingalkenetrisubstituted
1675-1665weakC=C stretchingalkenetetrasubstituted
1662-1626mediumC=C stretchingalkenedisubstituted (cis)
1658-1648mediumC=C stretchingalkenevinylidene
1650-1600mediumC=C stretchingconjugated alkene
1650-1580mediumN-H bendingamine
1650-1566mediumC=C stretchingcyclic alkene
1648-1638strongC=C stretchingalkenemonosubstituted
1620-1610strongC=C stretchingα,β-unsaturated ketone
1600–1300 cm−1
1600–1300 cm−11550-1500strongN-O stretchingnitro compound
1372-1290
1465mediumC-H bendingalkanemethylene group
1450mediumC-H bendingalkanemethyl group
1375
1390-1380mediumC-H bendingaldehyde
1385-1380mediumC-H bendingalkanegem dimethyl
1370-1365
1400–1000 cm−1
1400–1000 cm−11440-1395mediumO-H bendingcarboxylic acid
1420-1330mediumO-H bendingalcohol
1415-1380strongS=O stretchingsulfate
1200-1185
1410-1380strongS=O stretchingsulfonyl chloride
1204-1177
1400-1000strongC-F stretchingfluoro compound
1390-1310mediumO-H bendingphenol
1372-1335strongS=O stretchingsulfonate
1195-1168
1370-1335strongS=O stretchingsulfonamide
1170-1155
1350-1342strongS=O stretchingsulfonic acidanhydrous
1165-1150hydrate: 1230-1120
1350-1300strongS=O stretchingsulfone
1160-1120
1342-1266strongC-N stretchingaromatic amine
1310-1250strongC-O stretchingaromatic ester
1275-1200strongC-O stretchingalkyl aryl ether
1075-1020
1250-1020mediumC-N stretchingamine
1225-1200strongC-O stretchingvinyl ether
1075-1020
1210-1163strongC-O stretchingester
1205-1124strongC-O stretchingtertiary alcohol
1150-1085strongC-O stretchingaliphatic ether
1124-1087strongC-O stretchingsecondary alcohol
1085-1050strongC-O stretchingprimary alcohol
1070-1030strongS=O stretchingsulfoxide
1050-1040strong, broadCO-O-CO stretchinganhydride
1000–650 cm−1
1000–650 cm−1995-985strongC=C bendingalkenemonosubstituted
915-905
980-960strongC=C bendingalkenedisubstituted (trans)
895-885strongC=C bendingalkenevinylidene
850-550strongC-Cl stretchinghalo compound
840-790mediumC=C bendingalkenetrisubstituted
730-665strongC=C bendingalkenedisubstituted (cis)
690-515strongC-Br stretchinghalo compound
600-500strongC-I stretchinghalo compound
900–700 cm−1
900–700 cm−1880 ± 20strongC-H bending1,2,4-trisubstituted
810 ± 20
880 ± 20strongC-H bending1,3-disubstituted
780 ± 20
(700 ± 20)
810 ± 20strongC-H bending1,4-disubstituted or
1,2,3,4-tetrasubstituted
780 ± 20strongC-H bending1,2,3-trisubstituted
(700 ± 20)
755 ± 20strongC-H bending1,2-disubstituted
750 ± 20strongC-H bendingmonosubstituted
700 ± 20benzene derivative

IR Spectra Table by Compound Class [5]

Compound ClassGroupAbsorption (cm−1)AppearanceComments
acid halideC=O stretching1815-1785strong
alcoholsO-H stretching3700-3584medium, sharpfree
O-H stretching3550-3200strong, broadintermolecular bonded
O-H stretching3200-2700weak, broadintramolecular bonded
O-H bending1420-1330medium
aldehydeC-H stretching2830-2695mediumdoublet
C=O stretching1740-1720strong
C-H bending1390-1380medium
aliphatic etherC-O stretching1150-1085strong
aliphatic ketoneC=O stretching1725-1705strongor cyclohexanone or cyclopentenone
aliphatic primary amineN-H stretching3400-3300medium
alkaneC-H stretching3000-2840medium
C-H bending1465mediummethylene group
C-H bending1450mediummethyl group
C-H bending1385-1380mediumgem dimethyl
C-H stretching3100-3000medium
C=C stretching1678-1668weakdisubstituted (trans)
C=C stretching1675-1665weaktrisubstituted
C=C stretching1675-1665weaktetrasubstituted
C=C stretching1662-1626mediumdisubstituted (cis)
C=C stretching1658-1648mediumvinylidene
C=C stretching1648-1638strongmonosubstituted
C=C bending995-985strongmonosubstituted
C=C bending980-960strongdisubstituted (trans)
C=C bending895-885strongvinylidene
C=C bending840-790mediumtrisubstituted
C=C bending730-665strongdisubstituted (cis)
alkyl aryl etherC-O stretching1275-1200strong
alkyneC-H stretching3333-3267strong, sharp
CΞC stretching2260-2190weakdisubstituted
CΞC stretching2140-2100weakmonosubstituted
alleneC=C=C stretching2000-1900medium
amineN-H bending1650-1580medium
C-N stretching1250-1020medium
amine saltN-H stretching3000-2800strong, broad
anhydrideC=O stretching1818strong
CO-O-CO stretching1050-1040strong, broad
aromatic amineC-N stretching1342-1266strong
aromatic compoundC-H bending2000-1650weakovertone
aromatic esterC-O stretching1310-1250strong
azideN=N=N stretching2160-2120strong
benzene derivative700 ± 20
carbodiimideN=C=N stretching2145-2120strong
carbon dioxideO=C=O stretching2349strong
carboxylic acidO-H stretching3300-2500strong, broadusually centered on 3000 cm−1
C=O stretching1760strongmonomer
C=O stretching1720-1706strongdimer
O-H bending1440-1395medium
conjugated acidC=O stretching1710-1680strongdimer
conjugated acid halideC=O stretching1800-1770strong
conjugated aldehydeC=O stretching1710-1685strong
conjugated alkeneC=C stretching1650-1600medium
conjugated anhydrideC=O stretching1775strong
conjugated ketoneC=O stretching1685-1666strong
cyclic alkeneC=C stretching1650-1566medium
cyclopentanoneC=O stretching1745strong
esterC-O stretching1210-1163strong
estersC=O stretching1750-1735strong6-membered lactone
fluoro compoundC-F stretching1400-1000strong
halo compoundC-Cl stretching850-550strong
C-Br stretching690-515strong
C-I stretching600-500strong
imine / oximeC=N stretching1690-1640medium
isocyanateN=C=O stretching2275-2250strong, broad
isothiocyanateN=C=S stretching2140-1990strong
keteneC=C=O stretching2150
ketenimineC=C=N stretching2000
monosubstitutedC-H bending750 ± 20strong
nitrileCΞN stretching2260-2222weak
nitro compoundN-O stretching1550-1500strong
none3330-3250
none1870-1540
none1750
none1720
none1372-1290
none1375
none1370-1365
none1200-1185
none1204-1177
none1195-1168
none1170-1155
none1165-1150hydrate: 1230-1120
none1160-1120
none1075-1020
none1075-1020
none915-905
none810 ± 20
none780 ± 20
none(700 ± 20)
none(700 ± 20)
phenolO-H bending1390-1310medium
primary alcoholC-O stretching1085-1050strong
primary amideC=O stretching1690strongfree (associated: 1650)
N-H stretching3500medium
secondary alcoholC-O stretching1124-1087strong
secondary amideC=O stretching1680strongfree (associated: 1640)
secondary amineN-H stretching3350-3310medium
sulfateS=O stretching1415-1380strong
sulfonamideS=O stretching1370-1335strong
sulfonateS=O stretching1372-1335strong
sulfoneS=O stretching1350-1300strong
sulfonic acidS=O stretching1350-1342stronganhydrous
sulfonyl chlorideS=O stretching1410-1380strong
sulfoxideS=O stretching1070-1030strong
tertiary alcoholC-O stretching1205-1124strong
tertiary amideC=O stretching1680strongfree (associated: 1630)
thiocyanateS-CΞN stretching2175-2140strong
thiolS-H stretching2600-2550weak
vinyl / phenyl esterC=O stretching1770-1780strong
vinyl etherC-O stretching1225-1200strong
α,β-unsaturated esterC=O stretching1730-1715strongor formates
α,β-unsaturated ketoneC=C stretching1620-1610strong
δ-lactamC=O stretching1650strongγ: 1750-1700 β: 1760-1730
δ-lactoneC=O stretching1750-1735strongγ: 1770
1,2,3,4-tetrasubstituted
1,2,3-trisubstitutedC-H bending780 ± 20strong
C-H bending880 ± 20strong
1,2-disubstitutedC-H bending755 ± 20strong
C-H bending880 ± 20strong
1,4-disubstituted orC-H bending810 ± 20strong

To use an IR spectrum table, first need to find the frequency or compound in the first column, depending on which type of chart that is being used. Then find the corresponding values for absorption, appearance and other attributes. The value for absorption is usually in cm−1.

NOTE: NOT ALL FREQUENCIES HAVE A RELATED COMPOUND.

Applications

Evaluation of Dual - Spectrum IR Spectrogram System on Invasive Ductal Carcinoma (IDC) Breast cancer

Breast Cancer Gross Appearance Breast cancer gross appearance.jpg
Breast Cancer Gross Appearance

Invasive Ductal Carcinoma (IDC) is one of the common types of breast cancer which accounts for 8 out of 10 of all invasive breast cancers. According to the American Cancer Society, more than 180,000 women in the United States find out that they have breast cancers each year, and most are diagnosed with this specific type of cancer. [6] While it is essential to detect breast cancer early to reduce the death rate there may be already more than 10,000,000 cells in breast cancer when it can be observed by x-ray mammograms. however, the IR Spectrum proposed by Szu et al seems to be more promising in detecting breast cancer cells several months ahead of a mammogram. Clinical tests have been carried out with approval of Institutional Review Board of National Taiwan University Hospital. So from August 2007 to June 2008 35 patients aged between (30-66) with an average age of 49 were enlisted in this project. the results established that about 63% of the success rate could be achieved with the cross-sectional data. Therefore the results concluded that breast cancers may be detected more accurately by cross-referencing S1 maps of multiple three-points. [7]

Molecular spectroscopic Methods to Elucidation of Lignin Structure

A Lignin in plant cell is a complex amorphous polymer and it is biosynthesized from three aromatic alcohols, namely P-Coumaryl , Coniferyl , and Sinapyl alcohols. Lignin is a highly branched polymer and accounts for 15-30% by weight of lignocellulosic biomass (LCBM) , so the structure of lignin will vary significantly according to the type of LCBM and the composition will depend on the degradation process. [8] This biosynthesis process is mainly consists of radical coupling reactions and it generates a particular lignin polymer in each plant species. So due to having a complex structure, various molecular spectroscopic methods have been applied to resolve the aromatic units and different interunit linkages in lignin from distinct plant species. [9]

General Lignin Structure Lignin.png
General Lignin Structure

Related Research Articles

<span class="mw-page-title-main">Infrared spectroscopy</span> Interaction of infrared radiation with matter

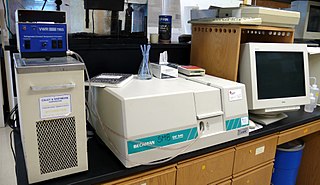
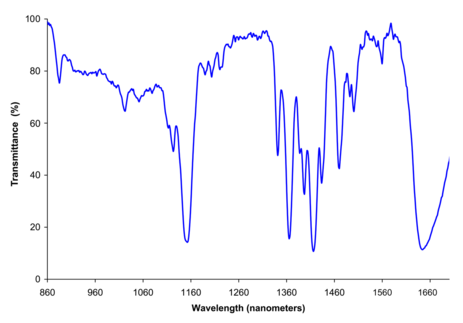
Infrared spectroscopy is the measurement of the interaction of infrared radiation with matter by absorption, emission, or reflection. It is used to study and identify chemical substances or functional groups in solid, liquid, or gaseous forms. It can be used to characterize new materials or identify and verify known and unknown samples. The method or technique of infrared spectroscopy is conducted with an instrument called an infrared spectrometer which produces an infrared spectrum. An IR spectrum can be visualized in a graph of infrared light absorbance on the vertical axis vs. frequency, wavenumber or wavelength on the horizontal axis. Typical units of wavenumber used in IR spectra are reciprocal centimeters, with the symbol cm−1. Units of IR wavelength are commonly given in micrometers, symbol μm, which are related to the wavenumber in a reciprocal way. A common laboratory instrument that uses this technique is a Fourier transform infrared (FTIR) spectrometer. Two-dimensional IR is also possible as discussed below.

<span class="mw-page-title-main">Spectroscopy</span> Study involving matter and electromagnetic radiation

Spectroscopy is the field of study that measures and interprets the electromagnetic spectra that result from the interaction between electromagnetic radiation and matter as a function of the wavelength or frequency of the radiation. Matter waves and acoustic waves can also be considered forms of radiative energy, and recently gravitational waves have been associated with a spectral signature in the context of the Laser Interferometer Gravitational-Wave Observatory (LIGO)

<span class="mw-page-title-main">Optical spectrometer</span> Spectrograph

An optical spectrometer is an instrument used to measure properties of light over a specific portion of the electromagnetic spectrum, typically used in spectroscopic analysis to identify materials. The variable measured is most often the light's intensity but could also, for instance, be the polarization state. The independent variable is usually the wavelength of the light or a unit directly proportional to the photon energy, such as reciprocal centimeters or electron volts, which has a reciprocal relationship to wavelength.

<span class="mw-page-title-main">Spectrum</span> Continuous range of values, such as wavelengths in physics

A spectrum is a condition that is not limited to a specific set of values but can vary, without gaps, across a continuum. The word was first used scientifically in optics to describe the rainbow of colors in visible light after passing through a prism. As scientific understanding of light advanced, it came to apply to the entire electromagnetic spectrum. It thereby became a mapping of a range of magnitudes (wavelengths) to a range of qualities, which are the perceived "colors of the rainbow" and other properties which correspond to wavelengths that lie outside of the visible light spectrum.

<span class="mw-page-title-main">Ultraviolet–visible spectroscopy</span> Range of spectroscopic analysis

UV spectroscopy or UV–visible spectrophotometry refers to absorption spectroscopy or reflectance spectroscopy in part of the ultraviolet and the full, adjacent visible regions of the electromagnetic spectrum. Being relatively inexpensive and easily implemented, this methodology is widely used in diverse applied and fundamental applications. The only requirement is that the sample absorb in the UV-Vis region, i.e. be a chromophore. Absorption spectroscopy is complementary to fluorescence spectroscopy. Parameters of interest, besides the wavelength of measurement, are absorbance (A) or transmittance (%T) or reflectance (%R), and its change with time.

<span class="mw-page-title-main">Astrochemistry</span> Study of molecules in the Universe and their reactions

Astrochemistry is the study of the abundance and reactions of molecules in the Universe, and their interaction with radiation. The discipline is an overlap of astronomy and chemistry. The word "astrochemistry" may be applied to both the Solar System and the interstellar medium. The study of the abundance of elements and isotope ratios in Solar System objects, such as meteorites, is also called cosmochemistry, while the study of interstellar atoms and molecules and their interaction with radiation is sometimes called molecular astrophysics. The formation, atomic and chemical composition, evolution and fate of molecular gas clouds is of special interest, because it is from these clouds that solar systems form.

<span class="mw-page-title-main">Emission spectrum</span> Frequencies of light emitted by atoms or chemical compounds

The emission spectrum of a chemical element or chemical compound is the spectrum of frequencies of electromagnetic radiation emitted due to an electron making a transition from a high energy state to a lower energy state. The photon energy of the emitted photon is equal to the energy difference between the two states. There are many possible electron transitions for each atom, and each transition has a specific energy difference. This collection of different transitions, leading to different radiated wavelengths, make up an emission spectrum. Each element's emission spectrum is unique. Therefore, spectroscopy can be used to identify elements in matter of unknown composition. Similarly, the emission spectra of molecules can be used in chemical analysis of substances.

<span class="mw-page-title-main">Absorption spectroscopy</span> Spectroscopic techniques that measure the absorption of radiation

Absorption spectroscopy refers to spectroscopic techniques that measure the absorption of radiation, as a function of frequency or wavelength, due to its interaction with a sample. The sample absorbs energy, i.e., photons, from the radiating field. The intensity of the absorption varies as a function of frequency, and this variation is the absorption spectrum. Absorption spectroscopy is performed across the electromagnetic spectrum.

<span class="mw-page-title-main">Chemical structure</span> Organized way in which molecules are ordered and sorted

A chemical structure determination includes a chemist's specifying the molecular geometry and, when feasible and necessary, the electronic structure of the target molecule or other solid. Molecular geometry refers to the spatial arrangement of atoms in a molecule and the chemical bonds that hold the atoms together, and can be represented using structural formulae and by molecular models; complete electronic structure descriptions include specifying the occupation of a molecule's molecular orbitals. Structure determination can be applied to a range of targets from very simple molecules, to very complex ones.

<span class="mw-page-title-main">Near-infrared spectroscopy</span> Analytical method

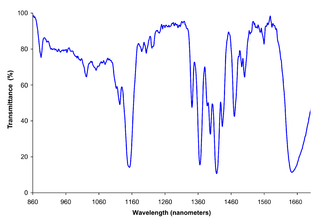
Near-infrared spectroscopy (NIRS) is a spectroscopic method that uses the near-infrared region of the electromagnetic spectrum. Typical applications include medical and physiological diagnostics and research including blood sugar, pulse oximetry, functional neuroimaging, sports medicine, elite sports training, ergonomics, rehabilitation, neonatal research, brain computer interface, urology, and neurology. There are also applications in other areas as well such as pharmaceutical, food and agrochemical quality control, atmospheric chemistry, combustion research and astronomy.

<span class="mw-page-title-main">Extended X-ray absorption fine structure</span> Measurement of X-ray absorption of a material as a function of energy

Extended X-ray absorption fine structure (EXAFS), along with X-ray absorption near edge structure (XANES), is a subset of X-ray absorption spectroscopy (XAS). Like other absorption spectroscopies, XAS techniques follow Beer's law. The X-ray absorption coefficient of a material as a function of energy is obtained using X-rays of a narrow energy resolution are directed at a sample and the incident and transmitted x-ray intensity is recorded as the incident x-ray energy is incremented.

Resonance Raman spectroscopy is a Raman spectroscopy technique in which the incident photon energy is close in energy to an electronic transition of a compound or material under examination. The frequency coincidence can lead to greatly enhanced intensity of the Raman scattering, which facilitates the study of chemical compounds present at low concentrations.

<span class="mw-page-title-main">Matrix isolation</span> Experimental chemistry technique

Matrix isolation is an experimental technique used in chemistry and physics. It generally involves a material being trapped within an unreactive matrix. A host matrix is a continuous solid phase in which guest particles are embedded. The guest is said to be isolated within the host matrix. Initially the term matrix-isolation was used to describe the placing of a chemical species in any unreactive material, often polymers or resins, but more recently has referred specifically to gases in low-temperature solids. A typical matrix isolation experiment involves a guest sample being diluted in the gas phase with the host material, usually a noble gas or nitrogen. This mixture is then deposited on a window that is cooled to below the melting point of the host gas. The sample may then be studied using various spectroscopic procedures.

The chemical state of a chemical element is due to its electronic, chemical and physical properties as it exists in combination with itself or a group of one or more other elements. A chemical state is often defined as an "oxidation state" when referring to metal cations. When referring to organic materials, a chemical state is usually defined as a chemical group, which is a group of several elements bonded together. Material scientists, solid state physicists, analytical chemists, surface scientists and spectroscopists describe or characterize the chemical, physical and/or electronic nature of the surface or the bulk regions of a material as having or existing as one or more chemical states.

In chemistry and molecular physics, fluxionalmolecules are molecules that undergo dynamics such that some or all of their atoms interchange between symmetry-equivalent positions. Because virtually all molecules are fluxional in some respects, e.g. bond rotations in most organic compounds, the term fluxional depends on the context and the method used to assess the dynamics. Often, a molecule is considered fluxional if its spectroscopic signature exhibits line-broadening due to chemical exchange. In some cases, where the rates are slow, fluxionality is not detected spectroscopically, but by isotopic labeling and other methods.

Chemical imaging is the analytical capability to create a visual image of components distribution from simultaneous measurement of spectra and spatial, time information. Hyperspectral imaging measures contiguous spectral bands, as opposed to multispectral imaging which measures spaced spectral bands.

Vibrational circular dichroism (VCD) is a spectroscopic technique which detects differences in attenuation of left and right circularly polarized light passing through a sample. It is the extension of circular dichroism spectroscopy into the infrared and near infrared ranges.

<span class="mw-page-title-main">Medullary breast carcinoma</span> Rare type of breast cancer

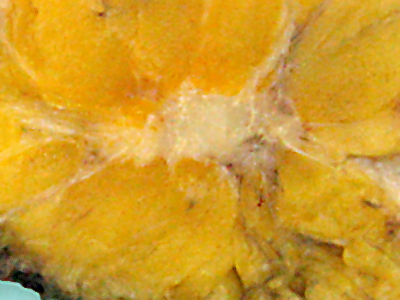
Medullary breast carcinoma is a rare type of breast cancer that is characterized as a relatively circumscribed tumor with pushing, rather than infiltrating, margins. It is histologically characterized as poorly differentiated cells with abundant cytoplasm and pleomorphic high grade vesicular nuclei. It involves lymphocytic infiltration in and around the tumor and can appear to be brown in appearance with necrosis and hemorrhage. Prognosis is measured through staging but can often be treated successfully and has a better prognosis than other infiltrating breast carcinomas.

<span class="mw-page-title-main">History of spectroscopy</span>

Modern spectroscopy in the Western world started in the 17th century. New designs in optics, specifically prisms, enabled systematic observations of the solar spectrum. Isaac Newton first applied the word spectrum to describe the rainbow of colors that combine to form white light. During the early 1800s, Joseph von Fraunhofer conducted experiments with dispersive spectrometers that enabled spectroscopy to become a more precise and quantitative scientific technique. Since then, spectroscopy has played and continues to play a significant role in chemistry, physics and astronomy. Fraunhofer observed and measured dark lines in the Sun's spectrum, which now bear his name although several of them were observed earlier by Wollaston.

The infrared Ca II triplet, commonly known as the calcium triplet, is a triplet of three ionised calcium spectral lines at the wavelengths of 8498 Å, 8542 Å and 8662 Å. The triplet has a strong emission, and is most prominently observed in the absorption of spectral type G, K and M stars.

References

  1. "Spectrochemical Analysis". Britannica. 23 September 2019. Retrieved 1 May 2021.{{cite web}}: CS1 maint: url-status (link)
  2. Deglr6328 (10 September 2006). "Dichloromethane near IR Spectrum". Wikipedia Commons. Retrieved 29 April 2021.{{cite web}}: CS1 maint: url-status (link)
  3. "The Era of Classical Spectroscopy". MIT Spectroscopy Lab - History. Retrieved 1 May 2021.{{cite web}}: CS1 maint: url-status (link)
  4. "IR spectrum table & chart". Millipore Sigma. Retrieved 29 April 2021.{{cite web}}: CS1 maint: url-status (link)
  5. "IR spectrum table & chart". Millipore Sigma. Retrieved 29 April 2021.{{cite web}}: CS1 maint: url-status (link)
  6. "Invasive Ductal Carcinoma: Diagnosis, Treatment, and More". Breastcancer.org. 21 January 2020. Retrieved 2 May 2020.{{cite web}}: CS1 maint: url-status (link)
  7. Lee, Chuang, Hsieh, Lee, Lee, Shih, Lee, Huang, Chang, Chen, Chia-Yen, Ching-Cheng, Hsin-Yu, Wan-Rou, Ching-Yen, Shyang-Rong, Si-Chen, Chiun-Sheng, Yeun-Chung, Chung-Ming Chen (14 June 2011). EVALUATION OF DUAL-SPECTRUM IR SPECTROGRAM SYSTEM ON INVASIVE DUCTAL CARCINOMA (IDC) BREAST CANCER. Institute of Biomedical Engineering, National Taiwan University, Taiwan. pp. 427–433.{{cite book}}: CS1 maint: multiple names: authors list (link)
  8. Lu, Lu, Hu, Xie, Wei, Fan, Yao, Yong-Chao, Hong-Qin, Feng-Jin, Xian-Yong, Xing (29 November 2017). "Structural Characterization of Lignin and Its Degradation Products with Spectroscopic Methods". Journal of Spectroscopy. 2017: 1–15. doi: 10.1155/2017/8951658 .{{cite journal}}: CS1 maint: multiple names: authors list (link)
  9. You, Xu, Tingting, Feng (5 October 2016). Applications of Molecular Spectroscopic Methods to the Elucidation of Lignin Structure. IntechOpen. doi:10.5772/64581. ISBN   978-953-51-2680-5 . Retrieved 1 May 2021.{{cite book}}: CS1 maint: url-status (link)