Biostatistics is a branch of statistics that applies statistical methods to a wide range of topics in biology. It encompasses the design of biological experiments, the collection and analysis of data from those experiments and the interpretation of the results.
Multivariate statistics is a subdivision of statistics encompassing the simultaneous observation and analysis of more than one outcome variable, i.e., multivariate random variables. Multivariate statistics concerns understanding the different aims and background of each of the different forms of multivariate analysis, and how they relate to each other. The practical application of multivariate statistics to a particular problem may involve several types of univariate and multivariate analyses in order to understand the relationships between variables and their relevance to the problem being studied.

Psychological statistics is application of formulas, theorems, numbers and laws to psychology. Statistical methods for psychology include development and application statistical theory and methods for modeling psychological data. These methods include psychometrics, factor analysis, experimental designs, and Bayesian statistics. The article also discusses journals in the same field.

Statistics is the discipline that concerns the collection, organization, analysis, interpretation, and presentation of data. In applying statistics to a scientific, industrial, or social problem, it is conventional to begin with a statistical population or a statistical model to be studied. Populations can be diverse groups of people or objects such as "all people living in a country" or "every atom composing a crystal". Statistics deals with every aspect of data, including the planning of data collection in terms of the design of surveys and experiments.
The following outline is provided as an overview of and topical guide to statistics:
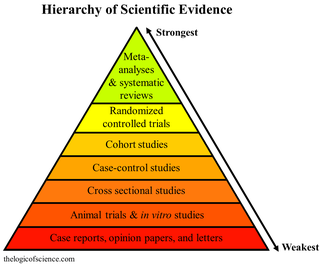
A meta-analysis is a statistical analysis that combines the results of multiple scientific studies. Meta-analyses can be performed when there are multiple scientific studies addressing the same question, with each individual study reporting measurements that are expected to have some degree of error. The aim then is to use approaches from statistics to derive a pooled estimate closest to the unknown common truth based on how this error is perceived. It is thus a basic methodology of Metascience. Meta-analytic results are considered the most trustworthy source of evidence by the evidence-based medicine literature.

In statistics, the standard score is the number of standard deviations by which the value of a raw score is above or below the mean value of what is being observed or measured. Raw scores above the mean have positive standard scores, while those below the mean have negative standard scores.
Chemometrics is the science of extracting information from chemical systems by data-driven means. Chemometrics is inherently interdisciplinary, using methods frequently employed in core data-analytic disciplines such as multivariate statistics, applied mathematics, and computer science, in order to address problems in chemistry, biochemistry, medicine, biology and chemical engineering. In this way, it mirrors other interdisciplinary fields, such as psychometrics and econometrics.
In statistics, an effect size is a value measuring the strength of the relationship between two variables in a population, or a sample-based estimate of that quantity. It can refer to the value of a statistic calculated from a sample of data, the value of a parameter for a hypothetical population, or to the equation that operationalizes how statistics or parameters lead to the effect size value. Examples of effect sizes include the correlation between two variables, the regression coefficient in a regression, the mean difference, or the risk of a particular event happening. Effect sizes complement statistical hypothesis testing, and play an important role in power analyses, sample size planning, and in meta-analyses. The cluster of data-analysis methods concerning effect sizes is referred to as estimation statistics.

In statistical modeling, regression analysis is a set of statistical processes for estimating the relationships between a dependent variable and one or more independent variables. The most common form of regression analysis is linear regression, in which one finds the line that most closely fits the data according to a specific mathematical criterion. For example, the method of ordinary least squares computes the unique line that minimizes the sum of squared differences between the true data and that line. For specific mathematical reasons, this allows the researcher to estimate the conditional expectation of the dependent variable when the independent variables take on a given set of values. Less common forms of regression use slightly different procedures to estimate alternative location parameters or estimate the conditional expectation across a broader collection of non-linear models.

MedCalc is a statistical software package designed for the biomedical sciences. It has an integrated spreadsheet for data input and can import files in several formats.
Bootstrapping is any test or metric that uses random sampling with replacement, and falls under the broader class of resampling methods. Bootstrapping assigns measures of accuracy to sample estimates. This technique allows estimation of the sampling distribution of almost any statistic using random sampling methods.
NCSS is a statistics package produced and distributed by NCSS, LLC. Created in 1981 by Jerry L. Hintze, NCSS, LLC specializes in providing statistical analysis software to researchers, businesses, and academic institutions. It also produces PASS Sample Size Software which is used in scientific study planning and evaluation.
Repeated measures design is a research design that involves multiple measures of the same variable taken on the same or matched subjects either under different conditions or over two or more time periods. For instance, repeated measurements are collected in a longitudinal study in which change over time is assessed.

PSPP is a free software application for analysis of sampled data, intended as a free alternative for IBM SPSS Statistics. It has a graphical user interface and conventional command-line interface. It is written in C and uses GNU Scientific Library for its mathematical routines. The name has "no official acronymic expansion".
Estimation statistics, or simply estimation, is a data analysis framework that uses a combination of effect sizes, confidence intervals, precision planning, and meta-analysis to plan experiments, analyze data and interpret results. It complements hypothesis testing approaches such as null hypothesis significance testing (NHST), by going beyond the question is an effect present or not, and provides information about how large an effect is. Estimation statistics is sometimes referred to as the new statistics.

The growth curve model in statistics is a specific multivariate linear model, also known as GMANOVA. It generalizes MANOVA by allowing post-matrices, as seen in the definition.

