Analysis of variance (ANOVA) is a collection of statistical models and their associated estimation procedures used to analyze the differences among means. ANOVA was developed by the statistician Ronald Fisher. ANOVA is based on the law of total variance, where the observed variance in a particular variable is partitioned into components attributable to different sources of variation. In its simplest form, ANOVA provides a statistical test of whether two or more population means are equal, and therefore generalizes the t-test beyond two means. In other words, the ANOVA is used to test the difference between two or more means.

Statistics is the discipline that concerns the collection, organization, analysis, interpretation, and presentation of data. In applying statistics to a scientific, industrial, or social problem, it is conventional to begin with a statistical population or a statistical model to be studied. Populations can be diverse groups of people or objects such as "all people living in a country" or "every atom composing a crystal". Statistics deals with every aspect of data, including the planning of data collection in terms of the design of surveys and experiments.

Statistical inference is the process of using data analysis to infer properties of an underlying distribution of probability. Inferential statistical analysis infers properties of a population, for example by testing hypotheses and deriving estimates. It is assumed that the observed data set is sampled from a larger population.
The following outline is provided as an overview of and topical guide to statistics:
Nonparametric statistics is a type of statistical analysis that does not rely on the assumption of a specific underlying distribution, or any other specific assumptions about the population parameters. This is in contrast to parametric statistics, which make such assumptions about the population. In nonparametric statistics, a distribution may not be specified at all, or a distribution may be specified but its parameters, such as the mean and variance, are not assumed to have a known value or distribution in advance. In some cases, parameters may be generated from the data, such as the median. Nonparametric statistics can be used for descriptive statistics or statistical inference. Nonparametric tests are often used when the assumptions of parametric tests are evidently violated.
In statistics and optimization, errors and residuals are two closely related and easily confused measures of the deviation of an observed value of an element of a statistical sample from its "true value". The error of an observation is the deviation of the observed value from the true value of a quantity of interest. The residual is the difference between the observed value and the estimated value of the quantity of interest. The distinction is most important in regression analysis, where the concepts are sometimes called the regression errors and regression residuals and where they lead to the concept of studentized residuals. In econometrics, "errors" are also called disturbances.
Sensitivity analysis is the study of how the uncertainty in the output of a mathematical model or system can be divided and allocated to different sources of uncertainty in its inputs. A related practice is uncertainty analysis, which has a greater focus on uncertainty quantification and propagation of uncertainty; ideally, uncertainty and sensitivity analysis should be run in tandem.

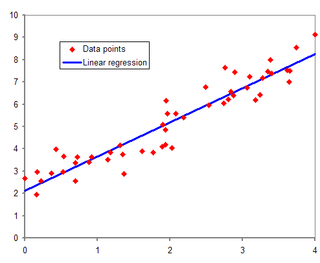
In statistical modeling, regression analysis is a set of statistical processes for estimating the relationships between a dependent variable and one or more independent variables. The most common form of regression analysis is linear regression, in which one finds the line that most closely fits the data according to a specific mathematical criterion. For example, the method of ordinary least squares computes the unique line that minimizes the sum of squared differences between the true data and that line. For specific mathematical reasons, this allows the researcher to estimate the conditional expectation of the dependent variable when the independent variables take on a given set of values. Less common forms of regression use slightly different procedures to estimate alternative location parameters or estimate the conditional expectation across a broader collection of non-linear models.

Mathematical statistics is the application of probability theory, a branch of mathematics, to statistics, as opposed to techniques for collecting statistical data. Specific mathematical techniques which are used for this include mathematical analysis, linear algebra, stochastic analysis, differential equations, and measure theory.
In statistics, ordinary least squares (OLS) is a type of linear least squares method for choosing the unknown parameters in a linear regression model by the principle of least squares: minimizing the sum of the squares of the differences between the observed dependent variable in the input dataset and the output of the (linear) function of the independent variable.
In robust statistics, robust regression seeks to overcome some limitations of traditional regression analysis. A regression analysis models the relationship between one or more independent variables and a dependent variable. Standard types of regression, such as ordinary least squares, have favourable properties if their underlying assumptions are true, but can give misleading results otherwise. Robust regression methods are designed to limit the effect that violations of assumptions by the underlying data-generating process have on regression estimates.
In statistics, resampling is the creation of new samples based on one observed sample. Resampling methods are:
- Permutation tests
- Bootstrapping
- Cross validation
Bootstrapping is any test or metric that uses random sampling with replacement, and falls under the broader class of resampling methods. Bootstrapping assigns measures of accuracy to sample estimates. This technique allows estimation of the sampling distribution of almost any statistic using random sampling methods.
In statistics, model specification is part of the process of building a statistical model: specification consists of selecting an appropriate functional form for the model and choosing which variables to include. For example, given personal income together with years of schooling and on-the-job experience , we might specify a functional relationship as follows:
In statistics, regression validation is the process of deciding whether the numerical results quantifying hypothesized relationships between variables, obtained from regression analysis, are acceptable as descriptions of the data. The validation process can involve analyzing the goodness of fit of the regression, analyzing whether the regression residuals are random, and checking whether the model's predictive performance deteriorates substantially when applied to data that were not used in model estimation.
In statistics, the Breusch–Godfrey test is used to assess the validity of some of the modelling assumptions inherent in applying regression-like models to observed data series. In particular, it tests for the presence of serial correlation that has not been included in a proposed model structure and which, if present, would mean that incorrect conclusions would be drawn from other tests or that sub-optimal estimates of model parameters would be obtained.
In statistics, model validation is the task of evaluating whether a chosen statistical model is appropriate or not. Oftentimes in statistical inference, inferences from models that appear to fit their data may be flukes, resulting in a misunderstanding by researchers of the actual relevance of their model. To combat this, model validation is used to test whether a statistical model can hold up to permutations in the data. This topic is not to be confused with the closely related task of model selection, the process of discriminating between multiple candidate models: model validation does not concern so much the conceptual design of models as it tests only the consistency between a chosen model and its stated outputs.
In statistics, linear regression is a linear approach for modelling a predictive relationship between a scalar response and one or more explanatory variables, which are measured without error. The case of one explanatory variable is called simple linear regression; for more than one, the process is called multiple linear regression. This term is distinct from multivariate linear regression, where multiple correlated dependent variables are predicted, rather than a single scalar variable.If the explanatory variables are measured with error then errors-in-variables models are required, also known as measurement error models.

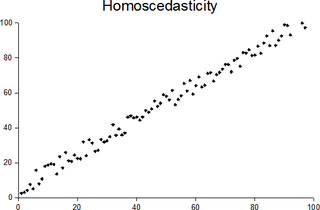
In statistics, a sequence of random variables is homoscedastic if all its random variables have the same finite variance; this is also known as homogeneity of variance. The complementary notion is called heteroscedasticity, also known as heterogeneity of variance. The spellings homoskedasticity and heteroskedasticity are also frequently used. Assuming a variable is homoscedastic when in reality it is heteroscedastic results in unbiased but inefficient point estimates and in biased estimates of standard errors, and may result in overestimating the goodness of fit as measured by the Pearson coefficient.


