The economy of Cyprus is a high-income economy as classified by the World Bank, and was included by the International Monetary Fund in its list of advanced economies in 2001. Cyprus adopted the euro as its official currency on 1 January 2008, replacing the Cypriot pound at an irrevocable fixed exchange rate of CYP 0.585274 per €1.

The economy of the Czech Republic is a developed export-oriented social market economy based in services, manufacturing, and innovation that maintains a high-income welfare state and the European social model. The Czech Republic participates in the European Single Market as a member of the European Union, and is therefore a part of the economy of the European Union. It uses its own currency, the Czech koruna, instead of the euro. It is a member of the Organisation for Economic Co-operation and Development (OECD). The Czech Republic ranks 16th in inequality-adjusted human development and 24th in World Bank Human Capital Index, ahead of countries such as the United States, the United Kingdom or France. It was described by The Guardian as "one of Europe's most flourishing economies".
The European Union (EU) is a supranational political and economic union of 27 member states that are located primarily in Europe. The Union has a total area of 4,233,255 km2 (1,634,469 sq mi) and an estimated total population of over 448 million. The EU has often been described as a sui generis political entity combining the characteristics of both a federation and a confederation.

The economy of Slovakia is based upon Slovakia becoming an EU member state in 2004, and adopting the euro at the beginning of 2009. Its capital, Bratislava, is the largest financial centre in Slovakia. As of Q1 2018, the unemployment rate was 5.72%.

The economy of Slovenia is a developed economy, and the country enjoys a high level of prosperity and stability as well as above-average GDP per capita by purchasing power parity at 92% of the EU average in 2022. The nominal GDP in 2023 is 68.108 billion USD, nominal GDP per capita (GDP/pc) in 2023 is USD 32,350. The highest GDP/pc is in central Slovenia, where the capital city Ljubljana is located. It is part of the Western Slovenia statistical region, which has a higher GDP/pc than eastern Slovenia.
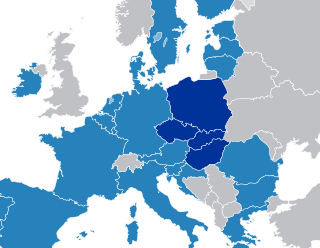
The Visegrád Group is a cultural and political alliance of four Central European countries: the Czech Republic, Hungary, Poland, and Slovakia. The alliance aims to advance co-operation in military, economic, cultural and energy affairs, and to further their integration with the EU. All four states are also members of the European Union (EU), the North Atlantic Treaty Organization (NATO), and the Bucharest Nine (B9).

The euro area, commonly called the eurozone (EZ), is a currency union of 20 member states of the European Union (EU) that have adopted the euro (€) as their primary currency and sole legal tender, and have thus fully implemented EMU policies.

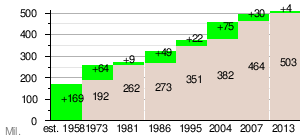
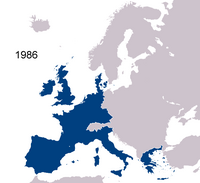
The European Union (EU) has expanded a number of times throughout its history by way of the accession of new member states to the Union. To join the EU, a state needs to fulfil economic and political conditions called the Copenhagen criteria, which require a stable democratic government that respects the rule of law, and its corresponding freedoms and institutions. According to the Maastricht Treaty, each current member state and the European Parliament must agree to any enlargement. The process of enlargement is sometimes referred to as European integration. This term is also used to refer to the intensification of co-operation between EU member states as national governments allow for the gradual harmonisation of national laws.
The following outline is provided as an overview of and topical guide to the European Union:
The special territories of members of the European Economic Area (EEA) are the 32 special territories of EU member states and EFTA member states which, for historical, geographical, or political reasons, enjoy special status within or outside the European Union and the European Free Trade Association.

Eurostat is a Directorate-General of the European Commission located in the Kirchberg quarter of Luxembourg City, Luxembourg. Eurostat's main responsibilities are to provide statistical information to the institutions of the European Union (EU) and to promote the harmonisation of statistical methods across its member states and candidates for accession as well as EFTA countries. The organisations in the different countries that cooperate with Eurostat are summarised under the concept of the European Statistical System.

Figures for the population of Europe vary according to the particular definition of Europe's boundaries. In 2018, Europe had a total population of over 751 million people. 448 million of that live in the European Union and 110 million live in European Russia, Russia being the most populous country in Europe.

The economy of the European Union is the joint economy of the member states of the European Union (EU). It is the second largest economy in the world in nominal terms, after the United States, and the third largest at purchasing power parity (PPP), after China and the US. The European Union's GDP is estimated to be $19.35 trillion (nominal) in 2024 or $26.64 trillion (PPP), representing around one-sixth of the global economy. Germany has the biggest national GDP of all EU countries, followed by France and Italy.
Statistics in the European Union are collected by Eurostat.

The largest enlargement of the European Union (EU), in terms of number of states and population, took place on 1 May 2004.
The demographics of the European Union show a highly populated, culturally diverse union of 27 member states. As of 1 January 2023, the population of the EU is around 448 million people.