A logarithmic scale is a way of displaying numerical data over a very wide range of values in a compact way. As opposed to a linear number line in which every unit of distance corresponds to adding by the same amount, on a logarithmic scale, every unit of length corresponds to multiplying the previous value by the same amount. Hence, such a scale is nonlinear. In nonlinear scale, the numbers 1, 2, 3, 4, 5, and so on would not be equally spaced. Rather, the numbers 10, 100, 1000, 10000, and 100000 would be equally spaced. Likewise, the numbers 2, 4, 8, 16, 32, and so on, would be equally spaced. Often exponential growth curves are displayed on a log scale, otherwise they would increase too quickly to fit within a small graph.
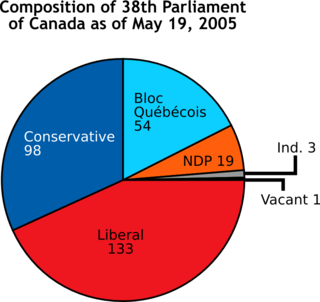
A chart is a graphical representation for data visualization, in which "the data is represented by symbols, such as bars in a bar chart, lines in a line chart, or slices in a pie chart". A chart can represent tabular numeric data, functions or some kinds of quality structure and provides different info.

Isometric projection is a method for visually representing three-dimensional objects in two dimensions in technical and engineering drawings. It is an axonometric projection in which the three coordinate axes appear equally foreshortened and the angle between any two of them is 120 degrees.

Graph drawing is an area of mathematics and computer science combining methods from geometric graph theory and information visualization to derive two-dimensional depictions of graphs arising from applications such as social network analysis, cartography, linguistics, and bioinformatics.

A bar chart or bar graph is a chart or graph that presents categorical data with rectangular bars with heights or lengths proportional to the values that they represent. The bars can be plotted vertically or horizontally. A vertical bar chart is sometimes called a column chart.

Infographics are graphic visual representations of information, data, or knowledge intended to present information quickly and clearly. They can improve cognition by using graphics to enhance the human visual system's ability to see patterns and trends. Similar pursuits are information visualization, data visualization, statistical graphics, information design, or information architecture. Infographics have evolved in recent years to be for mass communication, and thus are designed with fewer assumptions about the readers' knowledge base than other types of visualizations. Isotypes are an early example of infographics conveying information quickly and easily to the masses.
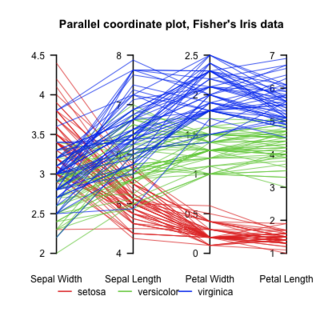
Parallel coordinates are a common way of visualizing and analyzing high-dimensional datasets.
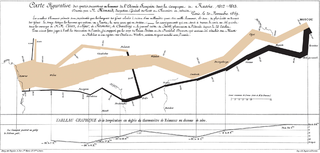
Data and information visualization is the practice of designing and creating easy-to-communicate and easy-to-understand graphic or visual representations of a large amount of complex quantitative and qualitative data and information with the help of static, dynamic or interactive visual items. Typically based on data and information collected from a certain domain of expertise, these visualizations are intended for a broader audience to help them visually explore and discover, quickly understand, interpret and gain important insights into otherwise difficult-to-identify structures, relationships, correlations, local and global patterns, trends, variations, constancy, clusters, outliers and unusual groupings within data. When intended for the general public to convey a concise version of known, specific information in a clear and engaging manner, it is typically called information graphics.

A heat map is a 2-dimensional data visualization technique that represents the magnitude of individual values within a dataset as a color. The variation in color may be by hue or intensity.
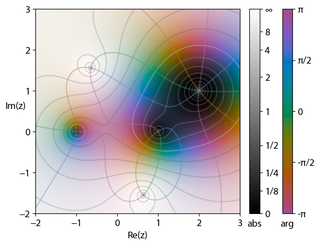
In complex analysis, domain coloring or a color wheel graph is a technique for visualizing complex functions by assigning a color to each point of the complex plane. By assigning points on the complex plane to different colors and brightness, domain coloring allows for a function from the complex plane to itself — whose graph would normally require four space dimensions — to be easily represented and understood. This provides insight to the fluidity of complex functions and shows natural geometric extensions of real functions.

Patrick M. Hanrahan is an American computer graphics researcher, the Canon USA Professor of Computer Science and Electrical Engineering in the Computer Graphics Laboratory at Stanford University. His research focuses on rendering algorithms, graphics processing units, as well as scientific illustration and visualization. He has received numerous awards, including the 2019 Turing Award.
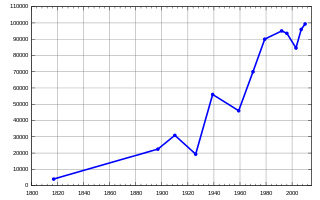
A line chart or line graph, also known as curve chart, is a type of chart that displays information as a series of data points called 'markers' connected by straight line segments. It is a basic type of chart common in many fields. It is similar to a scatter plot except that the measurement points are ordered and joined with straight line segments. A line chart is often used to visualize a trend in data over intervals of time – a time series – thus the line is often drawn chronologically. In these cases they are known as run charts.
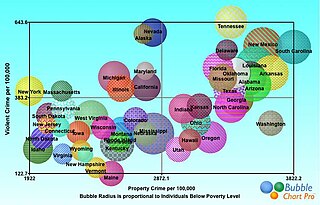
A bubble chart is a type of chart that displays three dimensions of data. Each entity with its triplet (v1, v2, v3) of associated data is plotted as a disk that expresses two of the vi values through the disk's xy location and the third through its size. Bubble charts can facilitate the understanding of social, economical, medical, and other scientific relationships.

Voreen is an open-source volume visualization library and development platform. Through the use of GPU-based volume rendering techniques it allows high frame rates on standard graphics hardware to support interactive volume exploration.

Layered graph drawing or hierarchical graph drawing is a type of graph drawing in which the vertices of a directed graph are drawn in horizontal rows or layers with the edges generally directed downwards. It is also known as Sugiyama-style graph drawing after Kozo Sugiyama, who first developed this drawing style.
Jarke J. (Jack) van Wijk is a Dutch computer scientist, a professor in the Department of Mathematics and Computer Science at the Eindhoven University of Technology, and an expert in information visualization.

Jean-Daniel Fekete is a French computer scientist.
Michael Bostock is an American computer scientist and data visualization specialist. He is one of the co-creators of Observable and a key developer of D3.js, a JavaScript library used to produce dynamic, interactive data visualizations for web browsers. He also contributed to the preceding Protovis framework.

Kwan-Liu Ma is an American computer scientist. He was born and grew up in Taipei, Taiwan and came to the United States pursuing advanced study in 1983. He is a distinguished professor of computer science at the University of California, Davis. His research interests include visualization, computer graphics, human computer interaction, and high-performance computing.

A horizon chart or horizon graph is a 2-dimensional data visualisation displaying a quantitative data over a continuous interval, most commonly a time period. The horizon chart is valuable for enabling readers to identify trends and extreme values within large datasets. Similar to sparklines and ridgeline plot, horizon chart may not be the most suitable visualisation for precisely pinpointing specific values. Instead, its strength lies in providing an overview and highlighting patterns and outliers in the data.
