Tag cloud

Last updated
Tag cloud of a mailing list Foundation-l word cloud without headers and quotes.png
Tag cloud of a mailing list
A tag cloud with terms related to Web 2.0 Web 2.0 Map.svg
A tag cloud with terms related to Web 2.0

A tag cloud (also known as a word cloud or weighted list in visual design) is a visual representation of text data which is often used to depict keyword metadata on websites, or to visualize free form text. Tags are usually single words, and the importance of each tag is shown with font size or color. [2] [3] When used as website navigation aids, the terms are hyperlinked to items associated with the tag.

Contents

History

Heidi Paris: initial cover draft for the German edition of "A Thousand Plateaus" by Gilles Deleuze and Felix Guattari, dated Nov 14 1991 Heidi Paris - Tausend Plateaus - Coverentwurf 1991.jpg
Heidi Paris: initial cover draft for the German edition of "A Thousand Plateaus" by Gilles Deleuze and Fèlix Guattari, dated Nov 14 1991

In the language of visual design, a tag cloud (or word cloud) is one kind of "weighted list", as commonly used on geographic maps to represent the relative size of cities in terms of relative typeface size. An early printed example of a weighted list of English keywords was the "subconscious files" in Douglas Coupland's Microserfs (1995). A German appearance occurred in 1992. [4]

The specific visual form and common use of the term "tag cloud" rose to prominence in the first decade of the 21st century as a widespread feature of early Web 2.0 websites and blogs, used primarily to visualize the frequency distribution of keyword metadata that describe website content, and as a navigation aid.

The first tag clouds on a high-profile website were on the photo sharing site Flickr, created by Flickr co-founder and interaction designer Stewart Butterfield in 2004. That implementation was based on Jim Flanagan's Search Referral Zeitgeist, [5] a visualization of Web site referrers. Tag clouds were also popularized around the same time by Del.icio.us and Technorati, among others.

Oversaturation of the tag cloud method and ambivalence about its utility as a web-navigation tool led to a decline of usage among these early adopters. [6] Flickr gave a five-word acceptance speech for the 2006 "Best Practices" Webby Award, which simply stated "sorry about the tag clouds." [7]

A second generation of software development discovered a wider diversity of uses for tag clouds as a basic visualization method for text data. Several extensions of tag clouds have been proposed in this context.

Types

A data cloud showing the population of each of the world's countries. Created in R with the wordcloud package, using data from Country population. The proportional sizes of China and India were divided in half. Word population tagcloud 2011.png
A data cloud showing the population of each of the world's countries. Created in R with the wordcloud package, using data from Country population. The proportional sizes of China and India were divided in half.

There are three main types of tag cloud applications in social software, distinguished by their meaning rather than appearance. In the first type, there is a tag for the frequency of each item, whereas in the second type, there are global tag clouds where the frequencies are aggregated over all items and users. In the third type, the cloud contains categories, with size indicating number of subcategories.

Frequency

In the first type, size represents the number of times that tag has been applied to a single item. [8] This is useful as a means of displaying metadata about an item that has been democratically "voted" on and where precise results are not desired.

In the second, more commonly used type,[ citation needed ] size represents the number of items to which a tag has been applied, as a presentation of each tag's popularity.

Significance

Instead of frequency, the size can be used to represent the significance of words and word co-occurrences, compared to a background corpus (for example, compared to all the text in Wikipedia). [9] This approach cannot be used standalone, but it relies on comparing the document frequencies to expected distributions.

Categorization

In the third type, tags are used as a categorization method for content items. Tags are represented in a cloud where larger tags represent the quantity of content items in that category.

There are some approaches to construct tag clusters instead of tag clouds, e.g., by applying tag co-occurrences in documents. [10]

More generally, the same visual technique can be used to display non-tag data, [11] as in a word cloud or a data cloud.

The term keyword cloud is sometimes used as a search engine marketing (SEM) term that refers to a group of keywords that are relevant to a specific website. In recent years tag clouds have gained popularity because of their role in search engine optimization of Web pages as well as supporting the user in navigating the content in an information system efficiently. [12] Tag clouds as a navigational tool make the resources of a website more connected, [13] when crawled by a search engine spider, which may improve the site's search engine rank. From a user interface perspective they are often used to summarize search results to support the user in finding content in a particular information system more quickly. [14]

Visual appearance

Tag clouds are typically represented using inline HTML elements. The tags can appear in alphabetical order, in a random order, they can be sorted by weight, and so on. Sometimes, further visual properties are manipulated in addition to font size, such as the font color, intensity, or weight. [15] Most popular is a rectangular tag arrangement with alphabetical sorting in a sequential line-by-line layout. The decision for an optimal layout should be driven by the expected user goals. [15] Some prefer to cluster the tags semantically so that similar tags will appear near each other [16] [17] [18] or use embedding techniques such as tSNE to position words. [9] Edges can be added to emphasize the co-occurrences of tags and visualize interactions. [9] Heuristics can be used to reduce the size of the tag cloud whether or not the purpose is to cluster the tags. [17]

Tag cloud visual taxonomy is determined by a number of attributes: tag ordering rule (e.g. alphabetically, by importance, by context, randomly, ordered for visual quality), shape of the entire cloud (e.g. rectangular, circle, given map borders), shape of tag bounds (rectangle, or character body), tag rotation (none, free, limited), vertical tag alignment (sticking to typographical baselines, free). A tag cloud on the web must address problems of modeling and controlling aesthetics, constructing a two-dimensional layout of tags, and all these must be done in short time on volatile browser platform. Tags clouds to be used on the web must be in HTML, not graphics, to make them robot-readable, they must be constructed on the client side using the fonts available in the browser, and they must fit in a rectangular box. [19]

Data clouds

A data cloud showing stock price movement. Color indicates positive or negative change, font size indicates percentage change. Top 500 by volume on the NYSE.png
A data cloud showing stock price movement. Color indicates positive or negative change, font size indicates percentage change.

A data cloud or cloud data is a data display which uses font size and/or color to indicate numerical values. [20] It is similar to a tag cloud [21] but instead of word count, displays data such as population or stock market prices.

Text clouds

Text cloud comparing 2002 State of the Union Address by U.S. President Bush and 2011 State of the Union Address by President Obama. State of the union word clouds.png
Text cloud comparing 2002 State of the Union Address by U.S. President Bush and 2011 State of the Union Address by President Obama.
Malayalam text cloud with science-related words Malayalam World Cloud with Science related words -BlueBackground.svg
Malayalam text cloud with science-related words

A text cloud or word cloud is a visualization of word frequency in a given text as a weighted list. [23] The technique has recently[ when? ] been popularly used to visualize the topical content of political speeches. [22] [24]

Collocate clouds

Extending the principles of a text cloud, a collocate cloud provides a more focused view of a document or corpus. Instead of summarising an entire document, the collocate cloud examines the usage of a particular word. The resulting cloud contains the words which are often used in conjunction with the search word. These collocates are formatted to show frequency (as size) as well as collocational strength (as brightness). This provides interactive ways to browse and explore language. [25]

Perception

Tag clouds have been the subjects of investigation in several usability studies. The following summary is based on an overview of research results given by Lohmann et al.: [15]

Felix et al. [26] compared how human reading performance differs from traditional tag clouds that map numeric values to the size of the font and alternative designs that uses for example color or additional shapes like circle and bars. They also compared how different arrangement of the words affects performance.

Creation

Tag cloud constructed from Wikipedia's top 1000 vital articles sorted by number of views. Wikipedia Wordle - Top 1000 vital article hits.png
Tag cloud constructed from Wikipedia's top 1000 vital articles sorted by number of views.

In principle, the font size of a tag in a tag cloud is determined by its incidence. For a word cloud of categories like weblogs, frequency, for example, corresponds to the number of weblog entries that are assigned to a category. For smaller frequencies one can specify font sizes directly, from one to whatever the maximum font size. For larger values, a scaling should be made. In a linear normalization, the weight of a descriptor is mapped to a size scale of 1 through f, where and are specifying the range of available weights.

for ; else
  • : display fontsize
  • : max. fontsize
  • : count
  • : min. count
  • : max. count

Since the number of indexed items per descriptor is usually distributed according to a power law, [28] for larger ranges of values, a logarithmic representation makes sense. [29]

Implementations of tag clouds also include text parsing and filtering out unhelpful tags such as common words, numbers, and punctuation.

There are also websites creating artificially or randomly weighted tag clouds, for advertising, or for humorous results.

See also

Related Research Articles

Spamdexing is the deliberate manipulation of search engine indexes. It involves a number of methods, such as link building and repeating unrelated phrases, to manipulate the relevance or prominence of resources indexed in a manner inconsistent with the purpose of the indexing system.

An HTML element is a type of HTML document component, one of several types of HTML nodes. The first used version of HTML was written by Tim Berners-Lee in 1993 and there have since been many versions of HTML. The most commonly used version is HTML 4.01, which became official standard in December 1999. An HTML document is composed of a tree of simple HTML nodes, such as text nodes, and HTML elements, which add semantics and formatting to parts of document. Each element can have HTML attributes specified. Elements can also have content, including other elements and text.

An image retrieval system is a computer system used for browsing, searching and retrieving images from a large database of digital images. Most traditional and common methods of image retrieval utilize some method of adding metadata such as captioning, keywords, title or descriptions to the images so that retrieval can be performed over the annotation words. Manual image annotation is time-consuming, laborious and expensive; to address this, there has been a large amount of research done on automatic image annotation. Additionally, the increase in social web applications and the semantic web have inspired the development of several web-based image annotation tools.

<span class="mw-page-title-main">Picasa</span> Image organizer and image viewer (2002–2016)

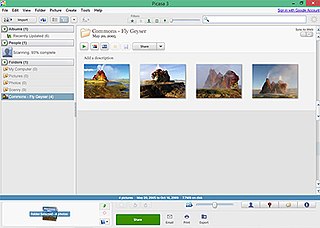
Picasa was a cross-platform image organizer and image viewer for organizing and editing digital photos, integrated with a now defunct photo-sharing website, originally created by a company named Lifescape in 2002. "Picasa" is a blend of the name of Spanish painter Pablo Picasso, the word casa and "pic" for pictures.

<span class="mw-page-title-main">Tag (metadata)</span> Keyword assigned to information

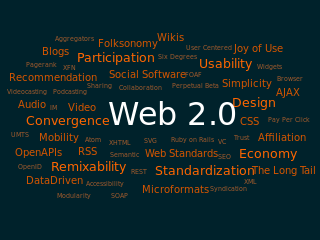
In information systems, a tag is a keyword or term assigned to a piece of information. This kind of metadata helps describe an item and allows it to be found again by browsing or searching. Tags are generally chosen informally and personally by the item's creator or by its viewer, depending on the system, although they may also be chosen from a controlled vocabulary.

In information retrieval, tf–idf, short for term frequency–inverse document frequency, is a measure of importance of a word to a document in a collection or corpus, adjusted for the fact that some words appear more frequently in general. It was often used as a weighting factor in searches of information retrieval, text mining, and user modeling. A survey conducted in 2015 showed that 83% of text-based recommender systems in digital libraries used tf–idf.

Keyword density is the percentage of times a keyword or phrase appears on a web page compared to the total number of words on the page. In the context of search engine optimization, keyword density can be used to determine whether a web page is relevant to a specified keyword or keyword phrase.

Product finders are information systems that help consumers to identify products within a large palette of similar alternative products. Product finders differ in complexity, the more complex among them being a special case of decision support systems. Conventional decision support systems, however, aim at specialized user groups, e.g. marketing managers, whereas product finders focus on consumers.

Search engine indexing is the collecting, parsing, and storing of data to facilitate fast and accurate information retrieval. Index design incorporates interdisciplinary concepts from linguistics, cognitive psychology, mathematics, informatics, and computer science. An alternate name for the process, in the context of search engines designed to find web pages on the Internet, is web indexing.

Knowledge management software is a subset of content management software, which contains a range of software that specializes in the way information is collected, stored and/or accessed. The concept of knowledge management is based on a range of practices used by an individual, a business, or a large corporation to identify, create, represent and redistribute information for a range of purposes. Software that enables an information practice or range of practices at any part of the processes of information management can be deemed to be called information management software. A subset of information management software that emphasizes an approach to build knowledge out of information that is managed or contained is often called knowledge management software.

The Corpus of Contemporary American English (COCA) is a one-billion-word corpus of contemporary American English. It was created by Mark Davies, retired professor of corpus linguistics at Brigham Young University (BYU).

A selection-based search system is a search engine system in which the user invokes a search query using only the mouse. A selection-based search system allows the user to search the internet for more information about any keyword or phrase contained within a document or webpage in any software application on their desktop computer using the mouse.

Folksonomy is a classification system in which end users apply public tags to online items, typically to make those items easier for themselves or others to find later. Over time, this can give rise to a classification system based on those tags and how often they are applied or searched for, in contrast to a taxonomic classification designed by the owners of the content and specified when it is published. This practice is also known as collaborative tagging, social classification, social indexing, and social tagging. Folksonomy was originally "the result of personal free tagging of information [...] for one's own retrieval", but online sharing and interaction expanded it into collaborative forms. Social tagging is the application of tags in an open online environment where the tags of other users are available to others. Collaborative tagging is tagging performed by a group of users. This type of folksonomy is commonly used in cooperative and collaborative projects such as research, content repositories, and social bookmarking.

MAXQDA is a software program designed for computer-assisted qualitative and mixed methods data, text and multimedia analysis in academic, scientific, and business institutions. It is being developed and distributed by VERBI Software based in Berlin, Germany.

Patent visualisation is an application of information visualisation. The number of patents has been increasing, encouraging companies to consider intellectual property as a part of their strategy. Patent visualisation, like patent mapping, is used to quickly view a patent portfolio.

QDA Miner is mixed methods and qualitative data analysis software developed by Provalis Research. The program was designed to assist researchers in managing, coding and analyzing qualitative data.

WordStat is a content analysis and text mining software. It was first released in 1998 after being developed by Normand Peladeau from Provalis Research. The latest version 9 was released in 2021.

Social navigation is a form of social computing introduced by Paul Dourish and Matthew Chalmers in 1994, who defined it as when "movement from one item to another is provoked as an artifact of the activity of another or a group of others". According to later research in 2002, "social navigation exploits the knowledge and experience of peer users of information resources" to guide users in the information space, and that it is becoming more difficult to navigate and search efficiently with all the digital information available from the World Wide Web and other sources. Studying others' navigational trails and understanding their behavior can help improve one's own search strategy by guiding them to make more informed decisions based on the actions of others.

Interpolation sort is a kind of bucket sort. It uses an interpolation formula to assign data to the bucket. A general interpolation formula is:

References

  1. Word-Cloud Generator (archive)
  2. Martin Halvey and Mark T. Keane, An Assessment of Tag Presentation Techniques Archived 2017-05-14 at the Wayback Machine , poster presentation at WWW 2007, 2007
  3. Helic, Denis; Trattner, Christoph; Strohmaier, Markus; Andrews, Keith (2011). "Are tag clouds useful for navigation? A network-theoretic analysis". International Journal of Social Computing and Cyber-Physical Systems. 1 (1): 33. doi: 10.1504/IJSCCPS.2011.043603 . ISSN   2040-0721.
  4. Gilles Deleuze, Felix Guattari (1992). Tausend Plateaus. Kapitalismus und Schizophrenie. ISBN   978-3-88396-094-4.
  5. A copy of Jim Flanagan's Search Referral Zeitgeist was available at archive.org but has since been blocked. In the comments of a blog entry Archived 2006-04-26 at the Wayback Machine , a user identified as Steve Minutillo attribute the idea to Jim Flanagan, stating that Flanagan's site had such displays in 2002.
  6. "Tag Clouds R.I.P.?". Readwriteweb.com. 2011-03-30. Archived from the original on 2012-03-19.
  7. "Welcome to the Webby Awards". Webbyawards.com. 2011-10-28. Archived from the original on 2006-07-03. Retrieved 2013-07-27.
  8. Bielenberg, K. and Zacher, M., Groups in Social Software: Utilizing Tagging to Integrate Individual Contexts for Social Navigation Archived 2007-10-08 at the Wayback Machine , Masters Thesis submitted to the Program of Digital Media, Universität Bremen (2006)
  9. 1 2 3 Schubert, Erich; Spitz, Andreas; Weiler, Michael; Geiß, Johanna; Gertz, Michael (2017-08-11). "Semantic Word Clouds with Background Corpus Normalization and t-distributed Stochastic Neighbor Embedding". arXiv: 1708.03569 [cs.IR].
  10. Knautz, K., Soubusta, S., & Stock, W.G. (2010). Tag clusters as information retrieval interfaces Archived 2011-07-17 at the Wayback Machine . Proceedings of the 43rd Annual Hawaii International Conference on System Sciences (HICSS-43), January 5–8, 2010. IEEE Computer Society Press (10 pages).
  11. Aouiche, Kamel; Lemire, Daniel; Godin, Robert (2007). "Collaborative OLAP with Tag Clouds: Web 2.0 OLAP Formalism and Experimental Evaluation". arXiv: 0710.2156 [cs.DB].
  12. Helic, D.; Trattner, C.; Strohmaier, M.; Andrews, K. (2011). "Are Tag Clouds Useful for Navigation? A Network-Theoretic Analysis" (PDF). International Journal of Social Computing and Cyber-Physical Systems. 1 (1): 33–55. doi: 10.1504/IJSCCPS.2011.043603 .
  13. Trattner, C.:Linking Related Content in Web Encyclopedias with search query tag clouds Archived 2012-06-15 at the Wayback Machine . IADIS International Journal on WWW/Internet, Volume 9, Issue 2, 2011
  14. Tratter, C., Lin, Y., Parra, D., Yue, Z., Brusilovsky, P.: Evaluating Tag-Based Information Access in Image Collections Archived 2012-06-15 at the Wayback Machine . In Proceedings of the 23rd ACM Conference on Hypertext and Social Media (HT 2012). ACM, New York, NY, USA, 2012
  15. 1 2 3 Lohmann, S., Ziegler, J., Tetzlaff, L. Comparison of Tag Cloud Layouts: Task-Related Performance and Visual Exploration Archived 2009-10-07 at the Wayback Machine , T. Gross et al. (Eds.): INTERACT 2009, Part I, LNCS 5726, pp. 392–404, 2009.
  16. Hassan-Montero, Y., Herrero-Solana, V. Improving Tag-Clouds as Visual Information Retrieval Interfaces Archived 2006-08-13 at the Wayback Machine . InSciT 2006: Mérida, Spain. October 25–28, 2006.
  17. 1 2 Kaser, Owen; Lemire, Daniel (2007). "Tag-Cloud Drawing: Algorithms for Cloud Visualization". arXiv: cs/0703109 .
  18. Salonen, J. 2007. Self-organising map based tag clouds – Creating spatially meaningful representations of tagging data Archived 2008-12-24 at the Wayback Machine . Proceedings of the 1st OPAALS conference, 26–27 November 2007, Rome, Italy.
  19. Marszałkowski, J., Mokwa, D., Drozdowski, M., Rusiecki, L., Narożny, H. Fast algorithms for online construction of web tag clouds, Engineering Applications of Artificial Intelligence 64, pp. 378–390, 2017.
  20. Apel, Warren. "ManyEyes Visualization and Commentary: World Population Data Cloud.". Archived from the original on 2007-10-29. Retrieved 2007-08-26.
  21. Wattenberg, Martin. "ManyEyes Visualization: Ad cloud". Archived from the original on 2008-02-14. Retrieved 2007-03-12.
  22. 1 2 Steinbock, Daniel. "TagCrowd visualization: State of the Union". Archived from the original on 2011-04-11. Retrieved 2011-03-05.
  23. Lamantia, Joe. "Text Clouds: A New Form of Tag Cloud?". Archived from the original on 2008-09-10. Retrieved 2008-09-11.{{cite web}}: CS1 maint: bot: original URL status unknown (link)
  24. Mehta, Chirag. "US Presidential Speeches Tag Cloud". Archived from the original on 2007-10-19. Retrieved 2008-09-11.
  25. "Collocate cloud" . Retrieved 2008-12-05.
  26. Felix, Cristian; Franconeri, Steven; Bertini, Enrico (Jan 2018). "Taking Word Clouds Apart: An Empirical Investigation of the Design Space for Keyword Summaries". IEEE Transactions on Visualization and Computer Graphics. 24 (1): 657–666. doi:10.1109/TVCG.2017.2746018. PMID   28866593. S2CID   6570943.
  27. "Monthly wiki page Hits for en.wikipedia". Wikistics.falsikon.de. 2009-08-31. Archived from the original on 2013-04-19. Retrieved 2013-07-27.
  28. Voss, Jakob (2006). "Collaborative thesaurus tagging the Wikipedia way". arXiv: cs/0604036 .
  29. "Kentbyte: Tag Cloud Font Distribution Algorithm. June 2005". Echochamberproject.com. Archived from the original on 2013-10-02. Retrieved 2013-07-27.