
Rendering or image synthesis is the process of generating a photorealistic or non-photorealistic image from a 2D or 3D model by means of a computer program. The resulting image is referred to as the render. Multiple models can be defined in a scene file containing objects in a strictly defined language or data structure. The scene file contains geometry, viewpoint, texture, lighting, and shading information describing the virtual scene. The data contained in the scene file is then passed to a rendering program to be processed and output to a digital image or raster graphics image file. The term "rendering" is analogous to the concept of an artist's impression of a scene. The term "rendering" is also used to describe the process of calculating effects in a video editing program to produce the final video output.

Information visualization is the study of visual representations of abstract data to reinforce human cognition. The abstract data include both numerical and non-numerical data, such as text and geographic information. It is related to data visualization, infographics, and scientific visualization. One definition is that it's information visualization when the spatial representation is chosen, whereas it's scientific visualization when the spatial representation is given.

Scientific visualization is an interdisciplinary branch of science concerned with the visualization of scientific phenomena. It is also considered a subset of computer graphics, a branch of computer science. The purpose of scientific visualization is to graphically illustrate scientific data to enable scientists to understand, illustrate, and glean insight from their data. Research into how people read and misread various types of visualizations is helping to determine what types and features of visualizations are most understandable and effective in conveying information.
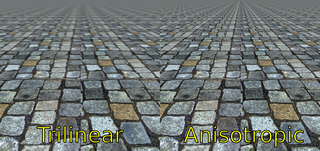
In 3D computer graphics, anisotropic filtering is a method of enhancing the image quality of textures on surfaces of computer graphics that are at oblique viewing angles with respect to the camera where the projection of the texture appears to be non-orthogonal.

Visualization or visualisation is any technique for creating images, diagrams, or animations to communicate a message. Visualization through visual imagery has been an effective way to communicate both abstract and concrete ideas since the dawn of humanity. Examples from history include cave paintings, Egyptian hieroglyphs, Greek geometry, and Leonardo da Vinci's revolutionary methods of technical drawing for engineering and scientific purposes.

In scientific visualization and computer graphics, volume rendering is a set of techniques used to display a 2D projection of a 3D discretely sampled data set, typically a 3D scalar field.
Non-photorealistic rendering (NPR) is an area of computer graphics that focuses on enabling a wide variety of expressive styles for digital art, in contrast to traditional computer graphics, which focuses on photorealism. NPR is inspired by other artistic modes such as painting, drawing, technical illustration, and animated cartoons. NPR has appeared in movies and video games in the form of cel-shaded animation as well as in scientific visualization, architectural illustration and experimental animation.
Theresa-Marie Rhyne is an expert in the field of computer-generated visualization and a consultant who specializes in applying artistic color theories to visualization and digital media. She has consulted with the Stanford University Visualization Group on a color suggestion prototype system (2013), the Center for Visualization at the University of California at Davis (2013), the Scientific Computing and Imaging Institute at the University of Utah & (2014) on applying color theory to ensemble data visualization and the Advanced Research Computing Unit at Virginia Tech (2019). Her book on "Applying Color Theory to Digital Media and Visualization" was published by CRC Press on November 17, 2016. In 2017, Theresa-Marie began exploring color harmony Harmony (color) with the Munsell color system and her work on "Visual Analytics with Complementary and Analogous Color Harmony" was published in the Munsell Color Blog. In 2018, she organized and contributed to the SIGGRAPH 2018 panel on "Color Mavens Advise on Digital Media Creation and Tools", that included representation from X-Rite/Pantone, Adobe, Rochester Institute of Technology and Pixar and was presented in Vancouver, Canada. In 2019, she combined "her Munsell Color Harmony work with Scientific Visualization efforts". As of 2020, she began writing on applying color to data visualizations for Nightingale, the journal of the Data Visualization Society and a Medium publication.
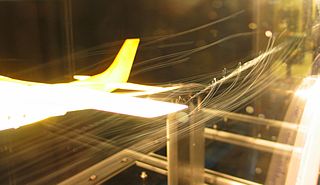
Flow visualization or flow visualisation in fluid dynamics is used to make the flow patterns visible, in order to get qualitative or quantitative information on them.

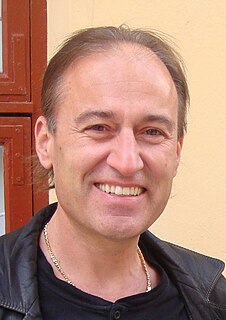
Patrick M. Hanrahan is an American computer graphics researcher, the Canon USA Professor of Computer Science and Electrical Engineering in the Computer Graphics Laboratory at Stanford University. His research focuses on rendering algorithms, graphics processing units, as well as scientific illustration and visualization. He has received numerous awards, including the 2019 Turing Award.

Fluid animation refers to computer graphics techniques for generating realistic animations of fluids such as water and smoke. Fluid animations are typically focused on emulating the qualitative visual behavior of a fluid, with less emphasis placed on rigorously correct physical results, although they often still rely on approximate solutions to the Euler equations or Navier–Stokes equations that govern real fluid physics. Fluid animation can be performed with different levels of complexity, ranging from time-consuming, high-quality animations for films, or visual effects, to simple and fast animations for real-time animations like computer games.
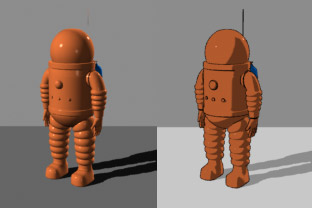
A projection augmented model is an element sometimes employed in virtual reality systems. It consists of a physical three-dimensional model onto which a computer image is projected to create a realistic looking object. Importantly, the physical model is the same geometric shape as the object that the PA model depicts.
In scientific visualization, Lagrangian–Eulerian advection is a technique mainly used for the visualization of unsteady flows. The computer graphics generated by the technique can help scientists visualize changes in velocity fields. This technique uses a hybrid Lagrangian and Eulerian specification of the flow field. It is a special case of a line integral convolution.

In scientific visualization, line integral convolution (LIC) is a technique proposed by Brian Cabral and Leith Leedom to visualize a vector field, such as fluid motion. Compared to other integration-based techniques that compute field lines of the input vector field, LIC has the advantage that all structural features of the vector field are displayed, without the need to adapt the start and end points of field lines to the specific vector field. LIC is a method from the texture advection family.

In scientific visualization, image-based flow visualization is a computer modelling technique developed by Jarke van Wijk to visualize two dimensional flows of liquids such as water and air, like the wind movement of a tornado. Compared with integration techniques it has the advantage of producing a whole image at every step, as the technique relies upon graphical computing methods for frame-by-frame capture of the model of advective transport of a decaying dye. It is a method from the texture advection family.
Markus Gross is a Professor of Computer science at the Swiss Federal Institute of Technology Zürich (ETH), head of its Computer Graphics Laboratory, and the director of Disney Research, Zurich. His research interests include physically based modeling, computer animation, immersive displays, and video technology. He has published more than 400 scientific papers on algorithms and methods in the field of computer graphics and computer vision, and holds more than 30 patents. He has graduated more than 50 PhD students so far.

Demetri Terzopoulos is a Distinguished Professor and Chancellor's Professor of Computer Science in the Henry Samueli School of Engineering and Applied Science at the University of California, Los Angeles, where he directs the UCLA Computer Graphics & Vision Laboratory.
Holly Rushmeier is an American computer scientist and is the John C. Malone Professor of Computer Science at Yale University. She is known for her contributions to the field of computer graphics.
IEEE Transactions on Visualization and Computer Graphics is a peer-reviewed scientific journal published by the IEEE Computer Society. It covers subjects related to computer graphics and visualization techniques, systems, software, hardware, and user interface issues. TVCG has been considered the top journal in the field of visualization.

Hanspeter Pfister is a Swiss computer scientist. He is the An Wang Professor of Computer Science at the Harvard John A. Paulson School of Engineering and Applied Sciences and an affiliate faculty member of the Center for Brain Science at Harvard University. His research in visual computing lies at the intersection of scientific visualization, information visualization, computer graphics, and computer vision and spans a wide range of topics, including biomedical image analysis and visualization, image and video analysis, and visual analytics in data science.
