Scientific visualization

Last updated
A scientific visualization of a simulation of a Rayleigh-Taylor instability caused by two mixing fluids. Rayleigh-Taylor instability.jpg
A scientific visualization of a simulation of a Rayleigh–Taylor instability caused by two mixing fluids.
Surface rendering of Arabidopsis thaliana pollen grains with confocal microscope. Tolmuterad.jpg
Surface rendering of Arabidopsis thaliana pollen grains with confocal microscope.

Scientific visualization (also spelled scientific visualisation) is an interdisciplinary branch of science concerned with the visualization of scientific phenomena. [2] It is also considered a subset of computer graphics, a branch of computer science. The purpose of scientific visualization is to graphically illustrate scientific data to enable scientists to understand, illustrate, and glean insight from their data. Research into how people read and misread various types of visualizations is helping to determine what types and features of visualizations are most understandable and effective in conveying information. [3] [4]

Contents

History

Charles Minard's flow map of Napoleon's March. Minard's Map (vectorized).svg
Charles Minard's flow map of Napoleon's March.

One of the earliest examples of three-dimensional scientific visualisation was Maxwell's thermodynamic surface, sculpted in clay in 1874 by James Clerk Maxwell. [5] This prefigured modern scientific visualization techniques that use computer graphics. [6]

Notable early two-dimensional examples include the flow map of Napoleon's March on Moscow produced by Charles Joseph Minard in 1869; [2] the "coxcombs" used by Florence Nightingale in 1857 as part of a campaign to improve sanitary conditions in the British army; [2] and the dot map used by John Snow in 1855 to visualise the Broad Street cholera outbreak. [2]

Data visualization methods

Criteria for classifications:


Two-dimensional data sets

Scientific visualization using computer graphics gained in popularity as graphics matured. Primary applications were scalar fields and vector fields from computer simulations and also measured data. The primary methods for visualizing two-dimensional (2D) scalar fields are color mapping and drawing contour lines. 2D vector fields are visualized using glyphs and streamlines or line integral convolution methods. 2D tensor fields are often resolved to a vector field by using one of the two eigenvectors to represent the tensor each point in the field and then visualized using vector field visualization methods.

Three-dimensional data sets

For 3D scalar fields the primary methods are volume rendering and isosurfaces. Methods for visualizing vector fields include glyphs (graphical icons) such as arrows, streamlines and streaklines, particle tracing, line integral convolution (LIC) and topological methods. Later, visualization techniques such as hyperstreamlines [7] were developed to visualize 2D and 3D tensor fields.

Topics

Maximum intensity projection (MIP) of a whole body PET scan. PET-MIPS-anim.gif
Maximum intensity projection (MIP) of a whole body PET scan.
Solar System image of the main asteroid belt and the Trojan asteroids. InnerSolarSystem-en.png
Solar System image of the main asteroid belt and the Trojan asteroids.
Scientific visualization of Fluid Flow: Surface waves in water 2006-01-14 Surface waves.jpg
Scientific visualization of Fluid Flow: Surface waves in water
Chemical imaging of a simultaneous release of SF6 and NH3. FIRST measurement of SF6 and NH3.jpg
Chemical imaging of a simultaneous release of SF6 and NH3.
Topographic scan of a glass surface by an Atomic force microscope. AFMimageRoughGlass20x20.png
Topographic scan of a glass surface by an Atomic force microscope.

Computer animation

Computer animation is the art, technique, and science of creating moving images via the use of computers. It is becoming more common to be created by means of 3D computer graphics, though 2D computer graphics are still widely used for stylistic, low bandwidth, and faster real-time rendering needs. Sometimes the target of the animation is the computer itself, but sometimes the target is another medium, such as film. It is also referred to as CGI (Computer-generated imagery or computer-generated imaging), especially when used in films. Applications include medical animation, which is most commonly utilized as an instructional tool for medical professionals or their patients.

Computer simulation

Computer simulation is a computer program, or network of computers, that attempts to simulate an abstract model of a particular system. Computer simulations have become a useful part of mathematical modelling of many natural systems in physics, and computational physics, chemistry and biology; human systems in economics, psychology, and social science; and in the process of engineering and new technology, to gain insight into the operation of those systems, or to observe their behavior. [8] The simultaneous visualization and simulation of a system is called visulation.

Computer simulations vary from computer programs that run a few minutes, to network-based groups of computers running for hours, to ongoing simulations that run for months. The scale of events being simulated by computer simulations has far exceeded anything possible (or perhaps even imaginable) using the traditional paper-and-pencil mathematical modeling: over 10 years ago, a desert-battle simulation, of one force invading another, involved the modeling of 66,239 tanks, trucks and other vehicles on simulated terrain around Kuwait, using multiple supercomputers in the DoD High Performance Computing Modernization Program. [9]

Information visualization

Information visualization is the study of "the visual representation of large-scale collections of non-numerical information, such as files and lines of code in software systems, library and bibliographic databases, networks of relations on the internet, and so forth". [2]

Information visualization focused on the creation of approaches for conveying abstract information in intuitive ways. Visual representations and interaction techniques take advantage of the human eye's broad bandwidth pathway into the mind to allow users to see, explore, and understand large amounts of information at once. [10] The key difference between scientific visualization and information visualization is that information visualization is often applied to data that is not generated by scientific inquiry. Some examples are graphical representations of data for business, government, news and social media.

Interface technology and perception

Interface technology and perception shows how new interfaces and a better understanding of underlying perceptual issues create new opportunities for the scientific visualization community. [11]

Surface rendering

Rendering is the process of generating an image from a model, by means of computer programs. The model is a description of three-dimensional objects in a strictly defined language or data structure. It would contain geometry, viewpoint, texture, lighting, and shading information. The image is a digital image or raster graphics image. The term may be by analogy with an "artist's rendering" of a scene. 'Rendering' is also used to describe the process of calculating effects in a video editing file to produce final video output. Important rendering techniques are:

Scanline rendering and rasterisation
A high-level representation of an image necessarily contains elements in a different domain from pixels. These elements are referred to as primitives. In a schematic drawing, for instance, line segments and curves might be primitives. In a graphical user interface, windows and buttons might be the primitives. In 3D rendering, triangles and polygons in space might be primitives.
Ray casting
Ray casting is primarily used for realtime simulations, such as those used in 3D computer games and cartoon animations, where detail is not important, or where it is more efficient to manually fake the details in order to obtain better performance in the computational stage. This is usually the case when a large number of frames need to be animated. The resulting surfaces have a characteristic 'flat' appearance when no additional tricks are used, as if objects in the scene were all painted with matte finish.
Radiosity
Radiosity, also known as Global Illumination, is a method that attempts to simulate the way in which directly illuminated surfaces act as indirect light sources that illuminate other surfaces. This produces more realistic shading and seems to better capture the 'ambience' of an indoor scene. A classic example is the way that shadows 'hug' the corners of rooms.
Ray tracing
Ray tracing is an extension of the same technique developed in scanline rendering and ray casting. Like those, it handles complicated objects well, and the objects may be described mathematically. Unlike scanline and casting, ray tracing is almost always a Monte Carlo technique, that is one based on averaging a number of randomly generated samples from a model.

Volume rendering

Volume rendering is a technique used to display a 2D projection of a 3D discretely sampled data set. A typical 3D data set is a group of 2D slice images acquired by a CT or MRI scanner. Usually these are acquired in a regular pattern (e.g., one slice every millimeter) and usually have a regular number of image pixels in a regular pattern. This is an example of a regular volumetric grid, with each volume element, or voxel represented by a single value that is obtained by sampling the immediate area surrounding the voxel.

Volume visualization

According to Rosenblum (1994) "volume visualization examines a set of techniques that allows viewing an object without mathematically representing the other surface. Initially used in medical imaging, volume visualization has become an essential technique for many sciences, portraying phenomena become an essential technique such as clouds, water flows, and molecular and biological structure. Many volume visualization algorithms are computationally expensive and demand large data storage. Advances in hardware and software are generalizing volume visualization as well as real time performances".

Developments of web-based technologies, and in-browser rendering have allowed of simple volumetric presentation of a cuboid with a changing frame of reference to show volume, mass and density data. [11]

Applications

This section will give a series of examples how scientific visualization can be applied today. [12]

In the natural sciences

Star formation: The featured plot is a Volume plot of the logarithm of gas/dust density in an Enzo star and galaxy simulation. Regions of high density are white while less dense regions are more blue and also more transparent.

Gravitational waves: Researchers used the Globus Toolkit to harness the power of multiple supercomputers to simulate the gravitational effects of black-hole collisions.

Massive Star Supernovae Explosions: In the image, three-Dimensional Radiation Hydrodynamics Calculations of Massive Star Supernovae Explosions The DJEHUTY stellar evolution code was used to calculate the explosion of SN 1987A model in three dimensions.

Molecular rendering: VisIt's general plotting capabilities were used to create the molecular rendering shown in the featured visualization. The original data was taken from the Protein Data Bank and turned into a VTK file before rendering.

In geography and ecology

Terrain visualization : VisIt can read several file formats common in the field of Geographic Information Systems (GIS), allowing one to plot raster data such as terrain data in visualizations. The featured image shows a plot of a DEM dataset containing mountainous areas near Dunsmuir, CA. Elevation lines are added to the plot to help delineate changes in elevation.

Tornado Simulation: This image was created from data generated by a tornado simulation calculated on NCSA's IBM p690 computing cluster. High-definition television animations of the storm produced at NCSA were included in an episode of the PBS television series NOVA called "Hunt for the Supertwister." The tornado is shown by spheres that are colored according to pressure; orange and blue tubes represent the rising and falling airflow around the tornado.

Climate visualization: This visualization depicts the carbon dioxide from various sources that are advected individually as tracers in the atmosphere model. Carbon dioxide from the ocean is shown as plumes during February 1900.

Atmospheric Anomaly in Times Square In the image the results from the SAMRAI simulation framework of an atmospheric anomaly in and around Times Square are visualized.

View of a 4D cube projected into 3D: orthogonal projection (left) and perspective projection (right).

In mathematics

Scientific visualization of mathematical structures has been undertaken for purposes of building intuition and for aiding the forming of mental models. [16]

Domain coloring of f(x) =
.mw-parser-output .sfrac{white-space:nowrap}.mw-parser-output .sfrac.tion,.mw-parser-output .sfrac .tion{display:inline-block;vertical-align:-0.5em;font-size:85%;text-align:center}.mw-parser-output .sfrac .num,.mw-parser-output .sfrac .den{display:block;line-height:1em;margin:0 0.1em}.mw-parser-output .sfrac .den{border-top:1px solid}.mw-parser-output .sr-only{border:0;clip:rect(0,0,0,0);height:1px;margin:-1px;overflow:hidden;padding:0;position:absolute;width:1px}
(x -1)(x-2-i)/x +2+2i Domain coloring x2-1 x-2-i x-2-i d x2+2+2i.xcf
Domain coloring of f(x) = (x −1)(x−2−i)/x +2+2i

Higher-dimensional objects can be visualized in form of projections (views) in lower dimensions. In particular, 4-dimensional objects are visualized by means of projection in three dimensions. The lower-dimensional projections of higher-dimensional objects can be used for purposes of virtual object manipulation, allowing 3D objects to be manipulated by operations performed in 2D, [17] and 4D objects by interactions performed in 3D. [18]

In complex analysis, functions of the complex plane are inherently 4-dimensional, but there is no natural geometric projection into lower dimensional visual representations. Instead, colour vision is exploited to capture dimensional information using techniques such as domain coloring.

In the formal sciences

Computer mapping of topographical surfaces: Through computer mapping of topographical surfaces, mathematicians can test theories of how materials will change when stressed. The imaging is part of the work on the NSF-funded Electronic Visualization Laboratory at the University of Illinois at Chicago.

Curve plots: VisIt can plot curves from data read from files and it can be used to extract and plot curve data from higher-dimensional datasets using lineout operators or queries. The curves in the featured image correspond to elevation data along lines drawn on DEM data and were created with the feature lineout capability. Lineout allows you to interactively draw a line, which specifies a path for data extraction. The resulting data was then plotted as curves.

Image annotations: The featured plot shows Leaf Area Index (LAI), a measure of global vegetative matter, from a NetCDF dataset. The primary plot is the large plot at the bottom, which shows the LAI for the whole world. The plots on top are actually annotations that contain images generated earlier. Image annotations can be used to include material that enhances a visualization such as auxiliary plots, images of experimental data, project logos, etc.

Scatter plot: VisIt's Scatter plot allows visualizing multivariate data of up to four dimensions. The Scatter plot takes multiple scalar variables and uses them for different axes in phase space. The different variables are combined to form coordinates in the phase space and they are displayed using glyphs and colored using another scalar variable.

In the applied sciences

Porsche 911 model (NASTRAN model): The featured plot contains a Mesh plot of a Porsche 911 model imported from a NASTRAN bulk data file. VisIt can read a limited subset of NASTRAN bulk data files, in general enough to import model geometry for visualization.

YF-17 aircraft Plot: The featured image displays plots of a CGNS dataset representing a YF-17 jet aircraft. The dataset consists of an unstructured grid with solution. The image was created by using a pseudocolor plot of the dataset's Mach variable, a Mesh plot of the grid, and Vector plot of a slice through the Velocity field.

City rendering: An ESRI shapefile containing a polygonal description of the building footprints was read in and then the polygons were resampled onto a rectilinear grid, which was extruded into the featured cityscape.

Inbound traffic measured: This image is a visualization study of inbound traffic measured in billions of bytes on the NSFNET T1 backbone for the month of September 1991. The traffic volume range is depicted from purple (zero bytes) to white (100 billion bytes). It represents data collected by Merit Network, Inc. [19]

Organizations

Important laboratories in the field are:

Conferences in this field, ranked by significance in scientific visualization research, [20] are:

See further: Computer graphics organizations, Supercomputing facilities

See also

General
Publications
Software

Related Research Articles

<span class="mw-page-title-main">Rendering (computer graphics)</span> Process of generating an image from a model

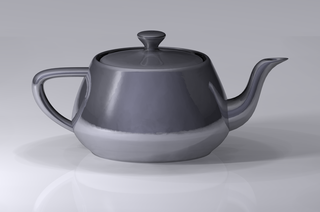
Rendering or image synthesis is the process of generating a photorealistic or non-photorealistic image from a 2D or 3D model by means of a computer program. The resulting image is referred to as the render. Multiple models can be defined in a scene file containing objects in a strictly defined language or data structure. The scene file contains geometry, viewpoint, texture, lighting, and shading information describing the virtual scene. The data contained in the scene file is then passed to a rendering program to be processed and output to a digital image or raster graphics image file. The term "rendering" is analogous to the concept of an artist's impression of a scene. The term "rendering" is also used to describe the process of calculating effects in a video editing program to produce the final video output.

<span class="mw-page-title-main">Voxel</span> Element representing a value on a grid in three dimensional space

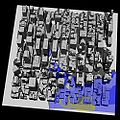
In 3D computer graphics, a voxel represents a value on a regular grid in three-dimensional space. As with pixels in a 2D bitmap, voxels themselves do not typically have their position explicitly encoded with their values. Instead, rendering systems infer the position of a voxel based upon its position relative to other voxels.

<span class="mw-page-title-main">Visualization (graphics)</span> Set of techniques for creating images, diagrams, or animations to communicate a message

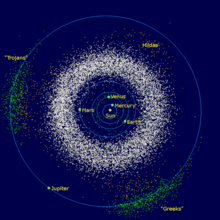
Visualization or visualisation is any technique for creating images, diagrams, or animations to communicate a message. Visualization through visual imagery has been an effective way to communicate both abstract and concrete ideas since the dawn of humanity. from history include cave paintings, Egyptian hieroglyphs, Greek geometry, and Leonardo da Vinci's revolutionary methods of technical drawing for engineering and scientific purposes.

<span class="mw-page-title-main">Volume rendering</span> Representing a 3D-modeled object or dataset as a 2D projection

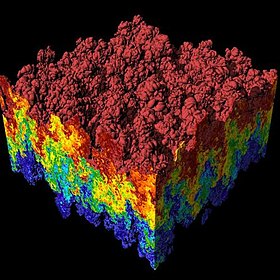
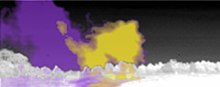
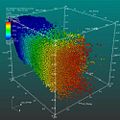
In scientific visualization and computer graphics, volume rendering is a set of techniques used to display a 2D projection of a 3D discretely sampled data set, typically a 3D scalar field.

<span class="mw-page-title-main">Non-photorealistic rendering</span> Style of rendering

Non-photorealistic rendering (NPR) is an area of computer graphics that focuses on enabling a wide variety of expressive styles for digital art, in contrast to traditional computer graphics, which focuses on photorealism. NPR is inspired by other artistic modes such as painting, drawing, technical illustration, and animated cartoons. NPR has appeared in movies and video games in the form of cel-shaded animation as well as in scientific visualization, architectural illustration and experimental animation.

<span class="mw-page-title-main">VTK</span> Open-source software system for 3D computer graphics, image processing and visualization

The Visualization Toolkit (VTK) is an open-source software system for 3D computer graphics, image processing and scientific visualization.

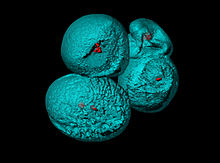
Volume ray casting, sometimes called volumetric ray casting, volumetric ray tracing, or volume ray marching, is an image-based volume rendering technique. It computes 2D images from 3D volumetric data sets. Volume ray casting, which processes volume data, must not be mistaken with ray casting in the sense used in ray tracing, which processes surface data. In the volumetric variant, the computation doesn't stop at the surface but "pushes through" the object, sampling the object along the ray. Unlike ray tracing, volume ray casting does not spawn secondary rays. When the context/application is clear, some authors simply call it ray casting. Because ray marching does not necessarily require an exact solution to ray intersection and collisions, it is suitable for real time computing for many applications for which ray tracing is unsuitable.

<span class="mw-page-title-main">3D rendering</span> Process of converting 3D scenes into 2D images

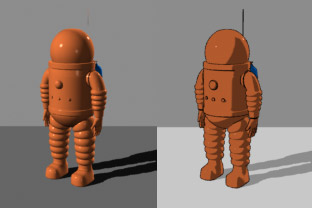
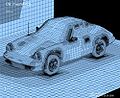
3D rendering is the 3D computer graphics process of converting 3D models into 2D images on a computer. 3D renders may include photorealistic effects or non-photorealistic styles.

<span class="mw-page-title-main">ParaView</span> Scientific visualization software

ParaView is an open-source multiple-platform application for interactive, scientific visualization. It has a client–server architecture to facilitate remote visualization of datasets, and generates level of detail (LOD) models to maintain interactive frame rates for large datasets. It is an application built on top of the Visualization Toolkit (VTK) libraries. ParaView is an application designed for data parallelism on shared-memory or distributed-memory multicomputers and clusters. It can also be run as a single-computer application.

<span class="mw-page-title-main">3D computer graphics</span> Graphics that use a three-dimensional representation of geometric data

3D computer graphics, sometimes called CGI, 3-D-CGI or three-dimensional computer graphics, are graphics that use a three-dimensional representation of geometric data that is stored in the computer for the purposes of performing calculations and rendering digital images, usually 2D images but sometimes 3D images. The resulting images may be stored for viewing later or displayed in real time.

<span class="mw-page-title-main">VisIt</span>

VisIt is an open-source interactive parallel visualization and graphical analysis tool for viewing scientific data. It can be used to visualize scalar and vector fields defined on 2D and 3D structured and unstructured meshes. VisIt was designed to handle big data set sizes in the terascale range and small data sets in the kilobyte range.

<span class="mw-page-title-main">Computer graphics (computer science)</span> Sub-field of computer science

Computer graphics is a sub-field of computer science which studies methods for digitally synthesizing and manipulating visual content. Although the term often refers to the study of three-dimensional computer graphics, it also encompasses two-dimensional graphics and image processing.

<span class="mw-page-title-main">Computer graphics</span> Graphics created using computers

Computer graphics deals with generating images and art with the aid of computers. Today, computer graphics is a core technology in digital photography, film, video games, digital art, cell phone and computer displays, and many specialized applications. A great deal of specialized hardware and software has been developed, with the displays of most devices being driven by computer graphics hardware. It is a vast and recently developed area of computer science. The phrase was coined in 1960 by computer graphics researchers Verne Hudson and William Fetter of Boeing. It is often abbreviated as CG, or typically in the context of film as computer generated imagery (CGI). The non-artistic aspects of computer graphics are the subject of computer science research.

<span class="mw-page-title-main">Scientific Computing and Imaging Institute</span> Research institute at the University of Utah

The Scientific Computing and Imaging (SCI) Institute is a permanent research institute at the University of Utah that focuses on the development of new scientific computing and visualization techniques, tools, and systems with primary applications to biomedical engineering. The SCI Institute is noted worldwide in the visualization community for contributions by faculty, alumni, and staff. Faculty are associated primarily with the School of Computing, Department of Bioengineering, Department of Mathematics, and Department of Electrical and Computer Engineering, with auxiliary faculty in the Medical School and School of Architecture.

<span class="mw-page-title-main">Voreen</span> Volume visualization library and development platform

Voreen is an open-source volume visualization library and development platform. Through the use of GPU-based volume rendering techniques it allows high frame rates on standard graphics hardware to support interactive volume exploration.

<span class="mw-page-title-main">MeVisLab</span>

MeVisLab is a cross-platform application framework for medical image processing and scientific visualization. It includes advanced algorithms for image registration, segmentation, and quantitative morphological and functional image analysis. An IDE for graphical programming and rapid user interface prototyping is available.

<span class="mw-page-title-main">Computer-generated imagery</span> Application of computer graphics to create or contribute to images

Computer-generated imagery (CGI) is a specific-technology or application of computer graphics for creating or improving images in art, printed media, simulators, videos and video games. These images are either static or dynamic. CGI both refers to 2D computer graphics and 3D computer graphics with the purpose of designing characters, virtual worlds, or scenes and special effects. The application of CGI for creating/improving animations is called computer animation, or CGI animation.

<span class="mw-page-title-main">Line integral convolution</span> Method for visualizing vector fields

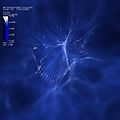
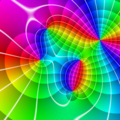
In scientific visualization, line integral convolution (LIC) is a method to visualize a vector field, such as fluid motion.

Visual computing is a generic term for all computer science disciplines dealing with images and 3D models, such as computer graphics, image processing, visualization, computer vision, virtual and augmented reality and video processing. Visual computing also includes aspects of pattern recognition, human computer interaction, machine learning and digital libraries. The core challenges are the acquisition, processing, analysis and rendering of visual information. Application areas include industrial quality control, medical image processing and visualization, surveying, robotics, multimedia systems, virtual heritage, special effects in movies and television, and computer games.

This is a glossary of terms relating to computer graphics.

References

  1. Visualizations that have been created with VisIt. at wci.llnl.gov. Updated: November 8, 2007
  2. 1 2 3 4 5 Michael Friendly (2008). "Milestones in the history of thematic cartography, statistical graphics, and data visualization".
  3. Mason, Betsy (November 12, 2019). "Why scientists need to be better at data visualization". Knowable Magazine. doi: 10.1146/knowable-110919-1 . S2CID   209062044.{{cite journal}}: CS1 maint: date and year (link)
  4. O'Donoghue, Seán I.; Baldi, Benedetta Frida; Clark, Susan J.; Darling, Aaron E.; Hogan, James M.; Kaur, Sandeep; Maier-Hein, Lena; McCarthy, Davis J.; Moore, William J.; Stenau, Esther; Swedlow, Jason R.; Vuong, Jenny; Procter, James B. (2018-07-20). "Visualization of Biomedical Data". Annual Review of Biomedical Data Science. 1 (1): 275–304. doi:10.1146/annurev-biodatasci-080917-013424. hdl: 10453/125943 . S2CID   199591321 . Retrieved 25 June 2021.
  5. James Clerk Maxwell and P. M. Harman (2002), The Scientific Letters and Papers of James Clerk Maxwell, Volume 3; 1874–1879 , Cambridge University Press, ISBN   0-521-25627-5, p. 148.
  6. Thomas G.West (February 1999). "Images and reversals: James Clerk Maxwell, working in wet clay". ACM SIGGRAPH Computer Graphics. 33 (1): 15–17. doi:10.1145/563666.563671. S2CID   13968486.
  7. Delmarcelle, T; Hesselink, L. (1993). "Visualizing second-order tensor fields with hyperstreamlines". IEEE Computer Graphics and Applications. 13 (4): 25–33. doi:10.1109/38.219447. hdl: 2060/19950012873 . S2CID   7698377.
  8. Steven Strogatz (2007). "The End of Insight". In: What is your dangerous idea? John Brockman (ed). HarperCollins.
  9. "Researchers stage largest military simulation ever". (news), Jet Propulsion Laboratory, Caltech, December 1997.
  10. James J. Thomas and Kristin A. Cook (Ed.) (2005). Illuminating the Path: The R&D Agenda for Visual Analytics Archived 2008-09-29 at the Wayback Machine . National Visualization and Analytics Center. p.30
  11. 1 2 Lawrence J. Rosenblum (ed.) (1994). Scientific Visualization: Advances and challenges. Academic Press.
  12. All examples both images and text here, unless another source is given, are from the Lawrence Livermore National Laboratory (LLNL), from the LLNL website, Retrieved 10–11 July 2008.
  13. The data used to make this image were provided by Tom Abel Ph.D. and Matthew Turk of the Kavli Institute for Particle Astrophysics and Cosmology.
  14. BLACK-HOLE COLLISIONS The Globus software creators Ian Foster, Carl Kesselman and Steve Tuecke. Publication Summer 2002.
  15. Image courtesy of Forrest Hoffman and Jamison Daniel of Oak Ridge National Laboratory
  16. Andrew J. Hanson, Tamara Munzner, George Francis: Interactive methods for visualizable geometry, Computer, vol. 27, no. 7, pp. 73–83 (abstract)
  17. Andrew J. Hanson: Constrained 3D navigation with 2D controller, Visualization '97., Proceedings, 24 October 1997, pp. 175-182 (abstract)
  18. Hui Zhang, Andrew J. Hanson: Shadow-Driven 4D Haptic Visualization, IEEE Transactions on Visualization and Computer Graphics, vol. 13, no. 6, pp. 1688-1695 (abstract)
  19. Image by Donna Cox and Robert Patterson. The National Science Foundation Press Release 08-112.
  20. Kosara, Robert (11 November 2013). "A Guide to the Quality of Different Visualization Venues". eagereyes. Retrieved 7 April 2017.

Further reading