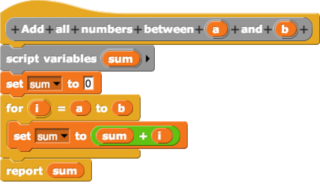
In computing, a visual programming language, also known as diagrammatic programming, graphical programming or block coding, is a programming language that lets users create programs by manipulating program elements graphically rather than by specifying them textually. A VPL allows programming with visual expressions, spatial arrangements of text and graphic symbols, used either as elements of syntax or secondary notation. For example, many VPLs are based on the idea of "boxes and arrows", where boxes or other screen objects are treated as entities, connected by arrows, lines or arcs which represent relations. VPLs are generally the basis of Low-code development platforms.

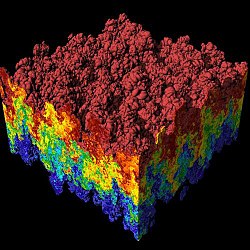
Scientific visualization is an interdisciplinary branch of science concerned with the visualization of scientific phenomena. It is also considered a subset of computer graphics, a branch of computer science. The purpose of scientific visualization is to graphically illustrate scientific data to enable scientists to understand, illustrate, and glean insight from their data. Research into how people read and misread various types of visualizations is helping to determine what types and features of visualizations are most understandable and effective in conveying information.
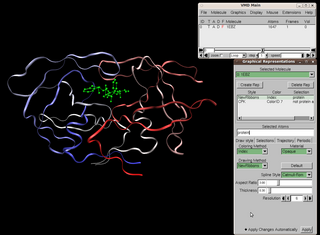
Visual Molecular Dynamics (VMD) is a molecular modelling and visualization computer program. VMD is developed mainly as a tool to view and analyze the results of molecular dynamics simulations. It also includes tools for working with volumetric data, sequence data, and arbitrary graphics objects. Molecular scenes can be exported to external rendering tools such as POV-Ray, RenderMan, Tachyon, Virtual Reality Modeling Language (VRML), and many others. Users can run their own Tcl and Python scripts within VMD as it includes embedded Tcl and Python interpreters. VMD runs on Unix, Apple Mac macOS, and Microsoft Windows. VMD is available to non-commercial users under a distribution-specific license which permits both use of the program and modification of its source code, at no charge.

In scientific visualization and computer graphics, volume rendering is a set of techniques used to display a 2D projection of a 3D discretely sampled data set, typically a 3D scalar field.
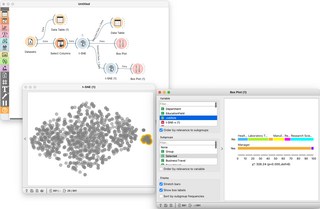
Orange is an open-source data visualization, machine learning and data mining toolkit. It features a visual programming front-end for explorative qualitative data analysis and interactive data visualization.
SALOME is a multi-platform open source (LGPL-2.1-or-later) scientific computing environment, allowing the realization of industrial studies of physics simulations.
The Portable, Extensible Toolkit for Scientific Computation, is a suite of data structures and routines developed by Argonne National Laboratory for the scalable (parallel) solution of scientific applications modeled by partial differential equations. It employs the Message Passing Interface (MPI) standard for all message-passing communication. PETSc is the world’s most widely used parallel numerical software library for partial differential equations and sparse matrix computations. PETSc received an R&D 100 Award in 2009. The PETSc Core Development Group won the SIAM/ACM Prize in Computational Science and Engineering for 2015.
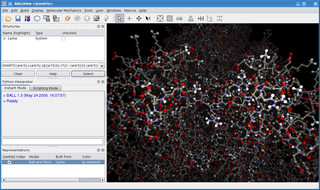
BALL is a C++ class framework and set of algorithms and data structures for molecular modelling and computational structural bioinformatics, a Python interface to this library, and a graphical user interface to BALL, the molecule viewer BALLView.

VSim is a cross-platform computational framework for multiphysics, compatible with Windows, Linux, and macOS.

ParaView is an open-source multiple-platform application for interactive, scientific visualization. It has a client–server architecture to facilitate remote visualization of datasets, and generates level of detail (LOD) models to maintain interactive frame rates for large datasets. It is an application built on top of the Visualization Toolkit (VTK) libraries. ParaView is an application designed for data parallelism on shared-memory or distributed-memory multicomputers and clusters. It can also be run as a single-computer application.
3D Slicer (Slicer) is a free and open source software package for image analysis and scientific visualization. Slicer is used in a variety of medical applications, including autism, multiple sclerosis, systemic lupus erythematosus, prostate cancer, lung cancer, breast cancer, schizophrenia, orthopedic biomechanics, COPD, cardiovascular disease and neurosurgery.

VisTrails is a scientific workflow management system developed at the Scientific Computing and Imaging Institute at the University of Utah that provides support for data exploration and visualization. It is written in Python and employs Qt via PyQt bindings. The system is open source, released under the GPL v2 license. The pre-compiled versions for Windows, Mac OS X, and Linux come with an installer and several packages, including VTK, matplotlib, and ImageMagick. VisTrails also supports user-defined packages.
Web-based simulation (WBS) is the invocation of computer simulation services over the World Wide Web, specifically through a web browser. Increasingly, the web is being looked upon as an environment for providing modeling and simulation applications, and as such, is an emerging area of investigation within the simulation community.

Simulation Open Framework Architecture (SOFA) is an open source framework primarily targeted at real-time physical simulation, with an emphasis on medical simulation.

The Scientific Computing and Imaging (SCI) Institute is a permanent research institute at the University of Utah that focuses on the development of new scientific computing and visualization techniques, tools, and systems with primary applications to biomedical engineering. The SCI Institute is noted worldwide in the visualization community for contributions by faculty, alumni, and staff. Faculty are associated primarily with the School of Computing, Department of Bioengineering, Department of Mathematics, and Department of Electrical and Computer Engineering, with auxiliary faculty in the Medical School and School of Architecture.

MeVisLab is a cross-platform application framework for medical image processing and scientific visualization. It includes advanced algorithms for image registration, segmentation, and quantitative morphological and functional image analysis. An IDE for graphical programming and rapid user interface prototyping is available.

VisualFEA is a finite element analysis software program for Microsoft Windows and Mac OS X. It is developed and distributed by Intuition Software, Inc. of South Korea, and used chiefly for structural and geotechnical analysis. Its strongest point is its intuitive, user-friendly design based on graphical pre- and postprocessing capabilities. It has educational features for teaching and learning structural mechanics, and finite element analysis through graphical simulation. It is widely used in college-level courses related to structural mechanics and finite element methods.
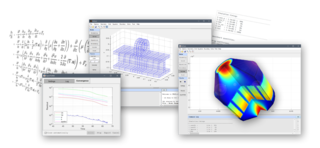
FEATool Multiphysics is a physics, finite element analysis (FEA), and partial differential equation (PDE) simulation toolbox. FEATool Multiphysics features the ability to model fully coupled heat transfer, fluid dynamics, chemical engineering, structural mechanics, fluid-structure interaction (FSI), electromagnetics, as well as user-defined and custom PDE problems in 1D, 2D (axisymmetry), or 3D, all within a graphical user interface (GUI) or optionally as script files. FEATool has been employed and used in academic research, teaching, and industrial engineering simulation contexts.